The main category of Forex News.
You can use the search box below to find what you need.
[wd_asp id=1]
The main category of Forex News.
You can use the search box below to find what you need.
[wd_asp id=1]
The overall result was a net loss of 3.97%, giving an average return of -1.32% per trade.
Last week’s key takeaways were:
There were a few other events last week which were of lower significance:

The most important items over this coming week will be:
This month, I forecasted that the USD/JPY currency pair would increase in value. The performance of this forecast to date is as follows:

Last week, I made no weekly forecast. Although there were some large directional movements in the NZD/JPY and EUR/NOK currency crosses, I had little faith that these would reverse over the coming week, so I did not want to take these trades. This was a great call, as both would have been losers.
Last week, the NZD/JPY currency cross experienced an unusually large directional price movement. However, I do not have faith that the price will revert over the coming week, so I again make no weekly forecast.
Directional volatility in the Forex market fell slightly last week, with 41% of the most important currency pairs fluctuating by more than 1%.
Last week, the Swiss Franc was the strongest major currency, while the Australian Dollar was the weakest.
You can trade these forecasts in a real or demo Forex brokerage account.

The US Dollar Index printed a bullish candlestick last week, closing near the top of its range. This is a sign of short-term bullish momentum. However, bulls could not push the price into the zone of strong resistance between 103.92 and 104.15. Another bearish factor—a strong one—is that the greenback is now well established within a long-term bearish trend, being below its levels of both three months ago and six months ago.
I see the US Dollar as ripe for a bearish turnaround at the current price area. Once we start to see some kind of convincing bearish reversal in the price action, a trade against the US Dollar over the coming week could be a good idea.
Alternatively, if the US Dollar can establish itself above 104.15 over the coming days, that will be a bullish sign and likely a signal to stop shorting the Dollar.

The EUR/USD currency pair advanced quite strongly at the start of last week to make the highest daily close in three months. The close was near the top of the day’s range at the breakout, and the closing price was above the technically significant level of $1.0920. For these reasons, many trend traders took a long trade entry here. However, the price turned bearish by failing to rise above the nearby resistance level at $1.0945, which lowered the price. The downward move then got a tailwind by increasing strength in the US Dollar towards the end of the week.
Trend traders might still be involved on the long side until the price breaks below $1.0800 or the support level nearby at $1.0833. However, given that last week’s candlestick, shown in the price chart below, is a bearish pin bar, it may not be wise to be long here. Zooming out, the long-term price action is quite consolidative, which might be another reason not to be in a trade here.
I will enter a long trade if we get a daily close this week above $1.0939. This is not likely likely to happen.

I expected the USD/CHF currency pair to have potential support at $0.8820.
The H1 price chart below shows how an engulfing bar, marked by the up arrow, rejected this support level right at the start of last Thursday’s Tokyo session, signalling the timing of this bullish rejection.
This trade could still be open, but so far, it has given a maximum reward-to-risk ratio of approximately 3 to 1.

Gold advanced quite strongly at the start of last week to advance to a new record high well above $2,450. However, the price then broke down quite strongly over the rest of the week, so the weekly candlestick ended up as a bearish pin bar.
Although the price action can be seen as a bearish development, it is worth noting that the decline has not been very large and that a support level just below $2,400 succeeded in holding the price up during the final hours of last week’s market.
The price of Gold may well continue to fall as the new week gets underway, but if the support level holds and the price rises again to make a daily close above $2,468, I will enter a long trade.
Most trend traders will remain long here, but it is probably unwise to enter a new long trade without the price making a significant high first.

The S&P 500 Index reached a new all-time high last week after rising firmly during the first part of the week. However, we then saw a strong selloff over the latter days of the week, so strong that the price fell by more than three times the long-term average true range, which is enough for most trend traders to exit a long trade which has been nicely profitable.
While the US stock market has a way of bouncing back, the price action here suggests a major bearish reversal. The weekly candle is a bearish outside candle that closed very near the low of its range.
The US stock market has risen strongly recently, so we may be overdue for a fairly strong correction. Alternatively, the price might bounce back. There is much talk about a rotation away from tech stocks. It is true the NASDAQ 100 Index performed even worse last week, but we still see the broader stock market also selling off.
The best strategy here is remaining on the sidelines and only getting involved on the long side if we get a strong rebound ending in a new record-high daily close.

The NASDAQ 100 Index sold off strongly last week, after making then rejecting a record high during the previous week with a bearish doji candlestick.
While the US stock market has a way of bouncing back, the price action here suggests a major bearish reversal. The weekly candle is large and bearish, and it closed very near the low of its range. The weekly decline was the worst since April.
The US stock market has risen strongly recently, so we may be overdue for a fairly strong correction. Alternatively, the price might bounce back. There is much talk about a rotation away from tech stocks. Technology stocks have performed poorly over the past two weeks after going on a record run.
The best strategy here is remaining on the sidelines and only getting involved on the long side if we get a strong rebound ending in a new record-high daily close. I do not think that this is a likely scenario.

I see the best trading opportunities this week as follows:
Ready to trade our weekly Forex analysis? We’ve made a Forex brokers list worth checking out.
You have reached your limit of 5 free articles for this month.
Access all our articles, insights, and analysts.
Your coupon code
Gold price is on a three-day corrective decline from record highs of $2,484 on Friday, paring back weekly gains amid a solid rebound staged by the US Dollar (USD) alongside the US Treasury bond yields.
The Greenback witnessed a dramatic comeback in the second half of Thursday’s trading after risk-aversion gripped markets, as Wall Street traders remained wary, rotating away from high-priced megacap growth stocks amid second-quarter earnings season.
Escalating trade tensions between the US and China combined with uncertainty on whether the US Federal Reserve (Fed) will go for another interest-rate cut after lowering rates in September weighed on the market sentiment, lifting the US Treasury bond yields across the curve. This, in turn, propelled the US Dollar from four-month troughs against its major currency rivals.
Markets are fully pricing in the September Fed rate cut while another cut in December is also likely, according to the CME Group’s FedWAtch Tool.
San Francisco Fed President Mary Daly participated in a ‘fireside chat’ at a conference late Thursday, noting that she is looking for more confidence that inflation is moving back to the Fed’s 2% target before calling for an interest rate cut.
Meanwhile, data on Thursday showed that US jobless claims rose to the highest level in nearly a year to a seasonally adjusted 243,000 for the week ended July 13. On the other hand, The Philly Fed Manufacturing Index jumped from 1.3 in June to an impressive 13.9 in July, reaching its highest point since April and smashing the 2.9 forecast. Mixed US economic data combined with prudent Fed commentary raised concerns on the scope of the Fed rate cuts this year.
Looking ahead, all eyes will remain on the speeches from the Fed officials, as the US central bank enters its ‘blackout period’ on Saturday before July 30-31 policy meeting. Fed policymakers John Williams and Raphael Bostic are due to speak later in the American session on Friday.
Also, Gold traders will stay cautious, as the end-of-the-week flows will remain in play and position readjustments ahead of next week’s advance US Gross Domestic Product (GDP) data for the second quarter.
Despite the recent retracement, the bullish bias for Gold price remains intact so long as the 14-day Relative Strength Index (RSI) remains above the 50 level. The indicator is currently at 60.
The previous week’s 21-day and 50-day Simple Moving Averages (SMA) Bull Cross also continues to lean in favor of Gold buyers.
The immediate support for Gold price is seen at the previous week’s high of $2,425. A sustained move below that level could accentuate the downside toward the 21-day SMA at $2,373.
Ahead of that, the $2,400 mark could come into play.
On the flip side, if Gold price resumes its uptrend, the previous lifetime high at $2,450 will be put to the test, above which the new all-time high of $2,484 will be challenged en route the $2,500 barrier.
Gold has played a key role in human’s history as it has been widely used as a store of value and medium of exchange. Currently, apart from its shine and usage for jewelry, the precious metal is widely seen as a safe-haven asset, meaning that it is considered a good investment during turbulent times. Gold is also widely seen as a hedge against inflation and against depreciating currencies as it doesn’t rely on any specific issuer or government.
Central banks are the biggest Gold holders. In their aim to support their currencies in turbulent times, central banks tend to diversify their reserves and buy Gold to improve the perceived strength of the economy and the currency. High Gold reserves can be a source of trust for a country’s solvency. Central banks added 1,136 tonnes of Gold worth around $70 billion to their reserves in 2022, according to data from the World Gold Council. This is the highest yearly purchase since records began. Central banks from emerging economies such as China, India and Turkey are quickly increasing their Gold reserves.
Gold has an inverse correlation with the US Dollar and US Treasuries, which are both major reserve and safe-haven assets. When the Dollar depreciates, Gold tends to rise, enabling investors and central banks to diversify their assets in turbulent times. Gold is also inversely correlated with risk assets. A rally in the stock market tends to weaken Gold price, while sell-offs in riskier markets tend to favor the precious metal.
The price can move due to a wide range of factors. Geopolitical instability or fears of a deep recession can quickly make Gold price escalate due to its safe-haven status. As a yield-less asset, Gold tends to rise with lower interest rates, while higher cost of money usually weighs down on the yellow metal. Still, most moves depend on how the US Dollar (USD) behaves as the asset is priced in dollars (XAU/USD). A strong Dollar tends to keep the price of Gold controlled, whereas a weaker Dollar is likely to push Gold prices up.
Gold price is on a three-day corrective decline from record highs of $2,484 on Friday, paring back weekly gains amid a solid rebound staged by the US Dollar (USD) alongside the US Treasury bond yields.
The Greenback witnessed a dramatic comeback in the second half of Thursday’s trading after risk-aversion gripped markets, as Wall Street traders remained wary, rotating away from high-priced megacap growth stocks amid second-quarter earnings season.
Escalating trade tensions between the US and China combined with uncertainty on whether the US Federal Reserve (Fed) will go for another interest-rate cut after lowering rates in September weighed on the market sentiment, lifting the US Treasury bond yields across the curve. This, in turn, propelled the US Dollar from four-month troughs against its major currency rivals.
Markets are fully pricing in the September Fed rate cut while another cut in December is also likely, according to the CME Group’s FedWAtch Tool.
San Francisco Fed President Mary Daly participated in a ‘fireside chat’ at a conference late Thursday, noting that she is looking for more confidence that inflation is moving back to the Fed’s 2% target before calling for an interest rate cut.
Meanwhile, data on Thursday showed that US jobless claims rose to the highest level in nearly a year to a seasonally adjusted 243,000 for the week ended July 13. On the other hand, The Philly Fed Manufacturing Index jumped from 1.3 in June to an impressive 13.9 in July, reaching its highest point since April and smashing the 2.9 forecast. Mixed US economic data combined with prudent Fed commentary raised concerns on the scope of the Fed rate cuts this year.
Looking ahead, all eyes will remain on the speeches from the Fed officials, as the US central bank enters its ‘blackout period’ on Saturday before July 30-31 policy meeting. Fed policymakers John Williams and Raphael Bostic are due to speak later in the American session on Friday.
Also, Gold traders will stay cautious, as the end-of-the-week flows will remain in play and position readjustments ahead of next week’s advance US Gross Domestic Product (GDP) data for the second quarter.
Despite the recent retracement, the bullish bias for Gold price remains intact so long as the 14-day Relative Strength Index (RSI) remains above the 50 level. The indicator is currently at 60.
The previous week’s 21-day and 50-day Simple Moving Averages (SMA) Bull Cross also continues to lean in favor of Gold buyers.
The immediate support for Gold price is seen at the previous week’s high of $2,425. A sustained move below that level could accentuate the downside toward the 21-day SMA at $2,373.
Ahead of that, the $2,400 mark could come into play.
On the flip side, if Gold price resumes its uptrend, the previous lifetime high at $2,450 will be put to the test, above which the new all-time high of $2,484 will be challenged en route the $2,500 barrier.
Gold has played a key role in human’s history as it has been widely used as a store of value and medium of exchange. Currently, apart from its shine and usage for jewelry, the precious metal is widely seen as a safe-haven asset, meaning that it is considered a good investment during turbulent times. Gold is also widely seen as a hedge against inflation and against depreciating currencies as it doesn’t rely on any specific issuer or government.
Central banks are the biggest Gold holders. In their aim to support their currencies in turbulent times, central banks tend to diversify their reserves and buy Gold to improve the perceived strength of the economy and the currency. High Gold reserves can be a source of trust for a country’s solvency. Central banks added 1,136 tonnes of Gold worth around $70 billion to their reserves in 2022, according to data from the World Gold Council. This is the highest yearly purchase since records began. Central banks from emerging economies such as China, India and Turkey are quickly increasing their Gold reserves.
Gold has an inverse correlation with the US Dollar and US Treasuries, which are both major reserve and safe-haven assets. When the Dollar depreciates, Gold tends to rise, enabling investors and central banks to diversify their assets in turbulent times. Gold is also inversely correlated with risk assets. A rally in the stock market tends to weaken Gold price, while sell-offs in riskier markets tend to favor the precious metal.
The price can move due to a wide range of factors. Geopolitical instability or fears of a deep recession can quickly make Gold price escalate due to its safe-haven status. As a yield-less asset, Gold tends to rise with lower interest rates, while higher cost of money usually weighs down on the yellow metal. Still, most moves depend on how the US Dollar (USD) behaves as the asset is priced in dollars (XAU/USD). A strong Dollar tends to keep the price of Gold controlled, whereas a weaker Dollar is likely to push Gold prices up.
The US dollar plunged during a major portion of the week, but it looks like the 155 yen level is trying to hold out of support. This of course is a large round psychologically significant figure and an area that people will be paying close attention to. So, with that being said, it looks like we are going to do something along the lines of forming a hammer. If we can break above the top of the candlestick, then it could open up the possibility of a move to the 160 yen level. And then perhaps to the 162 yen level.
Clearing that of course just kicks off the next leg higher. And although the Bank of Japan continues to intervene occasionally, the reality is there’s only so much that they can do. After all, the debt level in Japan is so massive, the interest rates rising could just absolutely rumble the economy. Japan is essentially stuck.
And at this point in time, it looks like inflation continues to be an issue in the United States. So, rates are going to stay high in the US for a while. And even if we do get cuts, you’re probably talking about 25 basis points between now and the end of the year, which is not enough to change the overall fundamentals of this pair. The question now is more or less, are we going sideways for a while and then going higher or are we just going to turn around and go higher? I have no interest in shorting this market.
For a look at all of today’s economic events, check out our economic calendar.
This article was originally posted on FX Empire
The bear trend can be expected to continue until there are signs that sentiment is starting to change. Certainly, having found support at this week at a low of 2.015 shows potential for a bullish reversal but there are no signs of it yet. Given the current price pattern natural gas would need to rise above 2.21 and stay above it for an indication of strength that may be sustainable for at least a few days. If that happens a test of the 200-Day MA as resistance is a likely target as it is also marked by several other indicators. The 200-Day line is now at 2.44.
A rally above 2.21 would also put natural gas well above the internal downtrend line, a sign of strengthening. That would make the higher trendline a target. Notice that the purple 20-Day MA has converged with the internal trend line, and they are identifying a similar area of price. The 20-Day line is now at 2.41. That would put the target of the 20-Day MA slightly below the 200-Day line, as it is now. There are several other indicators identifying a similar price area as the 200-Day MA. Together, they create a potential resistance zone from 2.44 to 2.62.
Natural gas is about to complete its fifth week in a row with lower weekly lows and lower highs. Also, this week it is on track to close at the highest price relative to the week’s trading range. In other words, relative to the week’s range, this week is set to close stronger than the prior five weeks. Not a big deal, but rather a small indication that natural gas is seeing some support off this week’s lows.
For a look at all of today’s economic events, check out our economic calendar.
The U.S. dollar initially pulled back just a bit against the Japanese Yen, only to turn around and show signs of life. We tested the 50-day EMA before pulling back just a bit, but ultimately, this is a pair that I think has offered enough value that people have begun to get involved yet again. The 155 yen level underneath, of course, is an area that I think a lot of people will be paying attention to as it is a large round, psychologically significant figure, and an area where we’ve seen buyers step in previously. With this being said, the market is likely to go looking to the 160 yen level, which is a large round figure as well.
All things being equal, this is a market that I think as the interest rate differential continues to favor the United States, we will continue to see this market rally quite a bit over the longer term. We have recently seen the Bank of Japan get involved, but this is just a band aid really for Japan in what is a bigger wound. They simply can get involved to slow the ascent of the dollar against the yen down, but to change the fundamentals, they just can’t do.
The interest rate differential is huge, and that’s because Japan simply cannot raise rates with the amount of debt that Japan has. The 155 yen level underneath is massive support, so if we were to somehow break down below there, it would obviously be a big deal. But I think at this point we are in the midst of stabilizing and if we can take off to the upside, perhaps clearing the 158.40 yen level, then the floodgates open and the buyers rush in.
For a look at all of today’s economic events, check out our economic calendar.
This article was originally posted on FX Empire
The Australian dollar has drifted a little bit lower during the trading session on Friday and now we are hanging around the 0.67 level. The 0.67 level, of course, is an area that previously had been resistance and now market memory dictates that we could see a little bit of support. The 50 day EMA is sitting just below, and it is rallying. So, I think there’s an area where we might see buyers come in and try to pick up a little bit of cheap Aussie dollars.
The 0.6650 level underneath continues to offer plenty of support, but I think given enough time, we will probably try to see the market turn things around. If we were to break down below the 0.6650 level, then it’s likely that the Aussie dollar could go looking to the 200-day EMA. If we can break to the upside and clear the most recent swing high, then we could go looking to the 0.6850 level.
In general, this is a market that I think continues to be noisy, but that’s nothing new. All you have to do is look at the last several months and see just how choppy this pair typically is. The Australian dollar, of course, is highly influenced by commodities and Asia, so keep that in mind as well. But as things stand right now, I think we’ve got a market that may have a little bit of interest underneath. We’ll just have to see how Friday ends up.
For a look at all of today’s economic events, check out our economic calendar.
This article was originally posted on FX Empire
This tells you just how weak the Japanese yen actually is. And with that being the case, I think you have to look at it through the prism of a market that is telling you anti-yen sentiment is still a big thing. As long as you get paid to hang on to this pair at the end of every day, it makes sense that you continue to hold it. I don’t have any interest whatsoever in trying to short this market right now.
I think the 170 yen level ends up being a major support level based on psychology, if nothing else. So, with that, I am looking at each dip as a potential buying opportunity. And I recognize that at this point, market participants continue to pay attention to that interest rate differential. The meeting in September, according to the ECB, is wide open for potential interest rates changes so we’ll have to wait and see but what we do know is that the Bank of Japan simply can’t do much right now with its interest rate policy due to the fact that the debt in Japan is so overextended and therefore it’s essentially stuck.
The Bank of Japan has intervened a couple of times recently, but you can see that the pair still looks very well supported so longer term, we’re still very much in an uptrend and I just don’t see why you would try to short it. After all, Japan is essentially stuck with its debt problem, and for years I have been hearing “Japan is a bug looking for a windshield.” It may be in the process of finding that windshield.
It is also worth noting that the ECB suggested that the September meeting is “wide open”, meaning for rate cuts, and the Euro still bounced against the yen. That might say everything in all actuality.
Ready to trade our daily forex forecast? Here are the best forex brokers in Japan to choose from.
The USD/JPY price analysis is slightly bullish as the yen retreats from its recent highs amid signs the BoJ might not hike interest rates in July. Meanwhile, the dollar was steady despite poor US data. The yen has pulled back from its Wednesday highs after a series of interventions by the Bank of Japan to support the currency.
–Are you interested in learning more about Forex brokers? Check our detailed guide-
However, the focus is now on monetary policy outlooks in the US and Japan. Notably, Japan’s government lowered this year’s growth estimates. This comes from the recent drop in demand amid higher import costs from a weak yen. The government cut growth from 1.3% to 0.9%. A weak economy complicates Japan’s outlook for rate hikes, as higher borrowing costs could further hurt the economy.
Meanwhile, a Reuters poll on Friday revealed that the BoJ will forego a hike in July to support weak economic demand. This is bearish for the yen as the rate gap between Japan and the US will remain longer. However, economists also believe the central bank will scale back bond purchases. At the same time, most project the next rate hike in October.
There was some positive news for the yen as Japan’s core inflation accelerated in June, keeping hopes for a hike alive. The country’s core CPI rose 2.6%, slightly below forecasts of a 2.7% gain. Still, it was better than the 2.5% increase reported in May.
On the other hand, the US dollar was steady despite data showing weakness in the US labor market. Unemployment claims rose to 243,000, beating forecasts for 230,000.
Investors do not expect high-impact reports from the US or Japan today, meaning the pair might consolidate.
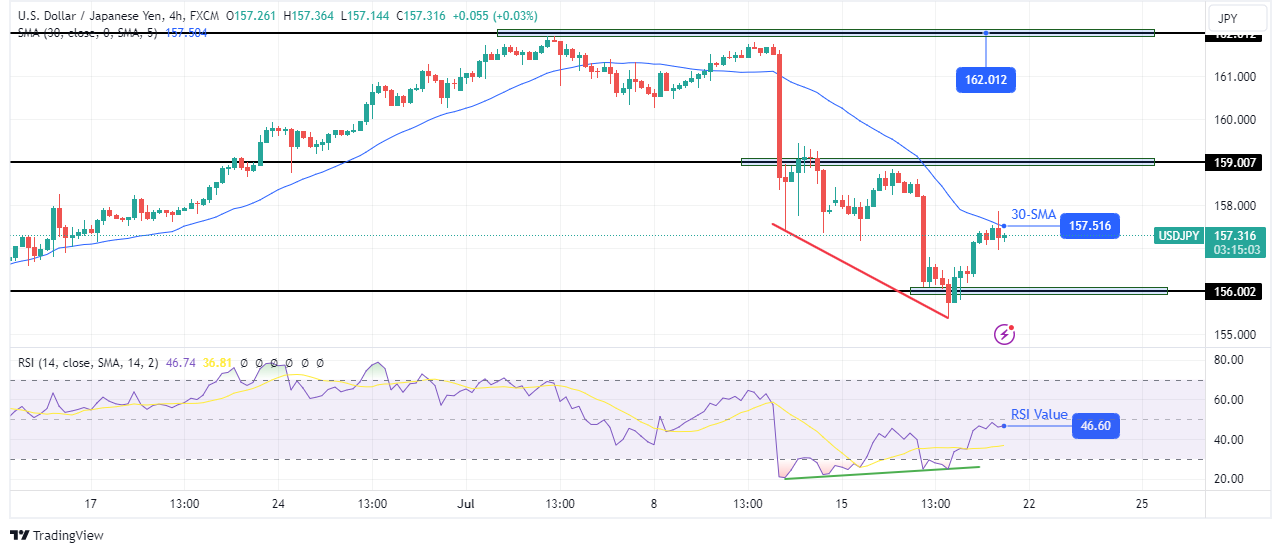
On the technical side, the USD/JPY price has pulled back after reaching the 156.00 key support level. It has found solid resistance at the 30-SMA. Notably, the price is in a developed downtrend with consistent lower highs and lows.
–Are you interested in learning more about crypto signals Telegram groups? Check our detailed guide-
However, the RSI is making higher lows, indicating a bullish divergence with the price. Therefore, there is a chance that bulls will break above the 30-SMA to retest the 159.00 resistance. However, if bears are still in control, the price will make a lower low below 156.00.
Looking to trade forex now? Invest at eToro!
68% of retail investor accounts lose money when trading CFDs with this provider. You should consider whether you can afford to take the high risk of losing your money.
The EUR/USD outlook points south as the euro falls after an ambiguous European Central Bank meeting. Meanwhile, the dollar recovered slightly after mixed economic data from the US in the previous session.
–Are you interested in learning more about Forex brokers? Check our detailed guide-
On Thursday, the ECB maintained rates but did not provide clear guidance on the outlook for rate cuts in the year’s second half, saying inflation remains high. However, forecasts showed that the central bank expects inflation to continue declining.
Furthermore, policymakers have lost the confidence they had before the June meeting. Initially, inflation in the Eurozone had been on a clear downtrend. As a result, the ECB committed to cut rates in June. However, as the meeting approached, it became clear that inflation had stalled. Therefore, although the central bank cut rates, some experts felt it was rushed. Others said the ECB only cut because it had committed to do it.
Economists believe there will be two more rate cuts in the Eurozone in September and December. However, at the meeting on Thursday, the message was that September was open. This means the outlook will depend on incoming data.
On the other hand, the dollar recovered from its lows on Thursday after a set of mixed economic reports. The unemployment claims jumped to 243,000 in the last week, beating forecasts for 230,000. Meanwhile, manufacturing activity in the US Atlantic region grew more than expected in July.
There will be no key reports from the Eurozone or the US today. As a result, investors will continue digesting yesterday’s ECB meeting.
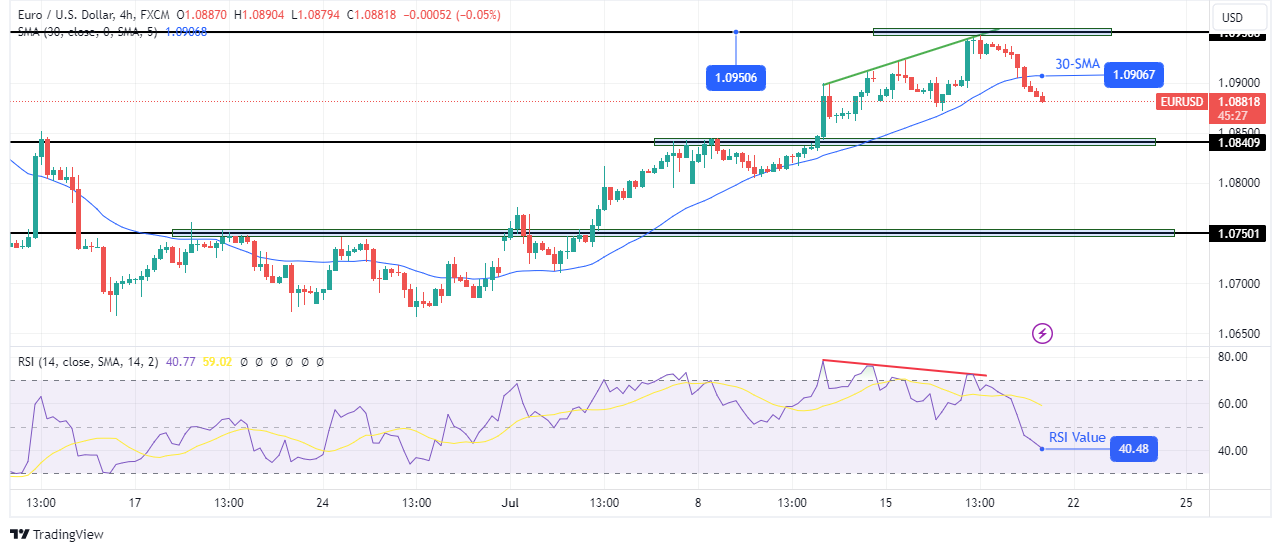
On the technical side, the EUR/USD price trades below the 30-SMA with the RSI under 50, showing a bearish trend. The shift in sentiment came after the RSI made a bearish divergence with the price. This was a sign that the previous bullish trend had reached a point where bulls were tired.
–Are you interested in learning more about crypto signals Telegram groups? Check our detailed guide-
As a result, bears took control with a break below the 30-SMA. At the moment, they are eyeing the 1.0840 support level. The price must now make lower lows and highs to confirm a bearish trend. Otherwise, the price might start consolidating or resume the bullish trend.
Looking to trade forex now? Invest at eToro!
68% of retail investor accounts lose money when trading CFDs with this provider. You should consider whether you can afford to take the high risk of losing your money.
With that being the case, you should also keep in mind that the market has an interest rate differential that a lot of people will pay attention to. After all you get paid quite nicely for, um, holding on to the pound against the yen. The Bank of England does have an interest rate decision in the next week or so. So that could come into play, but quite frankly it’s a situation where the bank of Japan just can’t do anything, although they may have been instrumental in part of the falling, if you will, of yen related pairs due to the fact that there has been a lot of negativity out there and then the Bank of Japan tends to pounce on that when they get the opportunity.
Either way, I think as long as we can stay above the 50-day EMA underneath and the 200 level, this remains a market that is still very much in an uptrend. And although it has been somewhat vicious on the way down, the reality is that it is still very much in an uptrend. So, with this, I am looking for momentum to the upside to jump on until then, I’m just going to be sitting on the sidelines and waiting for the value play to present itself yet again. Don’t feel rushed to get into the market, but I do think that if we can break above the 204 yen level, it’s likely that this pair will continue to climb higher.
Ready to trade our daily Forex analysis? We’ve made this forex brokers list for you to check out.