The main category of Forex News.
You can use the search box below to find what you need.
[wd_asp id=1]
The main category of Forex News.
You can use the search box below to find what you need.
[wd_asp id=1]
(MENAFN– Daily Forex)
The British pound has rallied a bit during the trading session on Tuesday.
I continue to monitor the ¥205 level as a potential support barrier, as it has held true for some time.
Furthermore, we have also seen the market try to push back against any selling, and it’s probably worth noting that the bank of Japan continues to see a lot of resistance against its interventions.
Central BankThe central bank will continue to drive this market in one direction or the other, and it’s obvious at this point in time that the Bank of Japan can do nothing to stem the flow. After all, the market is likely to continue to see the interest rate differential and was the reason to hang on to this pair, and the fact that we ended up forming a couple of hammers in a row does suggest that people are becoming more and more comfortable with buying this market. This asset will continue to pay off at the end of every day, and therefore I think you’ve got a situation where eventually we will try to get back to the highs.Top Forex Brokers
1 Get Started 74% of retail CFD accounts lose money
Underneath, the 200 for yen level is a support barrier as well, and if we were to break down below there, then we could see this market go looking to the 50-Day EMA, which is sitting just above the ¥200 level. The ¥200 level is for me the bottom of the overall trend, and as long as we can stay above there, the market is likely to continue to go much higher. In fact, I would love to see a pullback to that area so I could buy“cheap British pound.”That being said, it certainly looks like this is a market that is not afraid anymore, and the Bank of Japan probably understands that there is only so much you can do. At this point, it is probably more or less all about the idea of trying to slow down the destruction of its own currency as it cannot raise interest rates.Ready to trade our daily analysis & predictions ? Here are the best brokers for beginners to choose from.MENAFN18072024000131011023ID1108453229

Joe Biden signed an executive order not too awfully long ago in the last couple of years, which bans quite a bit of exporting of liquefied natural gas, not all, but quite a bit. So that’s why Europeans don’t get as much relief from the United States as you would expect. That is expected to be lifted into Donald Trump administration. And if that’s the case, it will massively change the dynamics of this market.
But as things stand right now, it is almost solely a domestic market. So, by all means, keep an eye on the US if you want to know what’s going on here. I use it as something to trade cyclically via ETF. If you don’t have the ability to trade an ETF, a very small CFD swing position is possible here, obviously to the upside, but you have to be willing to just let it go. It’s going to have to last probably a couple months to realize its full potential.
For a look at all of today’s economic events, check out our economic calendar.
The GBP/USD outlook is slightly bearish as the pound retreats from recent highs after downbeat employment figures. However, the bullish trend might continue since the dollar is weak amid an increase in Fed rate cut expectations.
–Are you interested in learning more about Forex brokers? Check our detailed guide-
Data on Thursday showed a higher-than-expected number of unemployment claims in the UK in the previous month. The claimant count was 32,300, compared to estimates of 23,400. Still, this was a decline from the last reading of 51,900. If unemployment is higher than estimated, the economy performs poorer than expected. This could pressure the Bank of England to start lowering borrowing costs.
However, separate employment figures revealed that average weekly earnings minus bonuses grew by 5.7%, meeting forecasts. Furthermore, data from the previous session showed that service inflation remained high at 5.7%. Therefore, market participants have lowered the chances that the BoE will cut rates in August from 50% to 40%.
Notably, unlike other major currencies, the pound has remained resilient against the dollar this year. So far, it has gained about 2.1% in 2024 against the dollar. The recent rally came due to increased expectations for a Fed rate cut. Inflation in the US has maintained its downtrend, giving policymakers more confidence it will reach the target. As a result, investors are placing a 100% likelihood of a rate cut in September. This has pressured the dollar, allowing the pound to rally. Retail sales data tomorrow could shed more light on the UK economy.
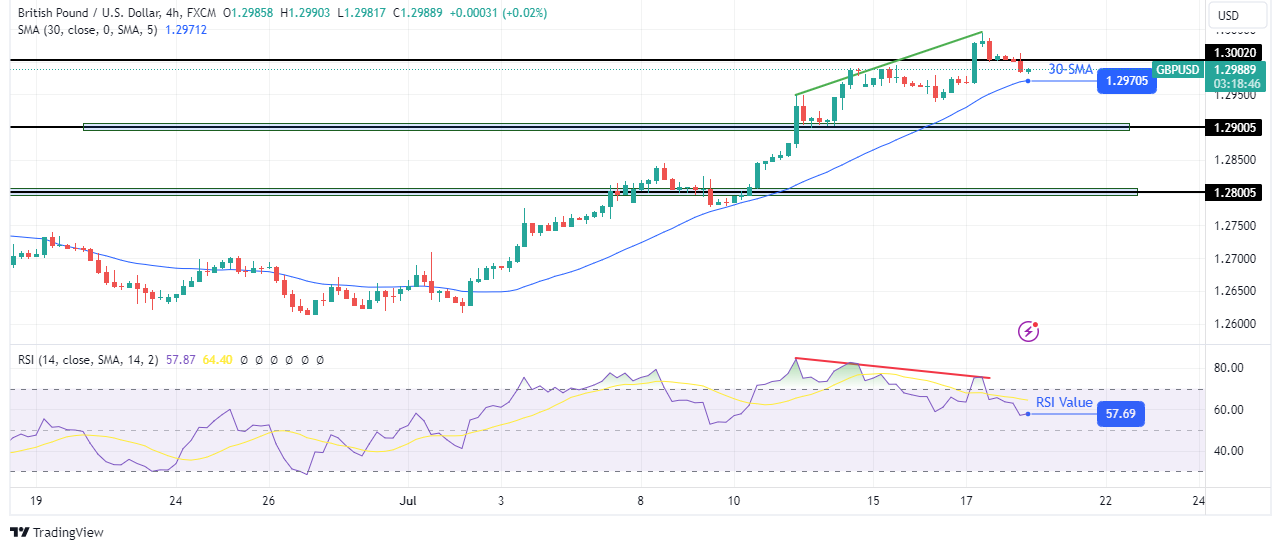
On the technical side, the GBP/USD price is in a bullish trend that recently made a new high. However, the price is currently pulling back and is nearing the 30-SMA support. Bulls made a solid attempt to push the price above the 1.3002 key level.
–Are you interested in learning more about crypto signals Telegram groups? Check our detailed guide-
However, as the price made a higher high, the RSI made a lower one, indicating weakness. Consequently, the price fell back below the key level. If bears are stronger, they might take over with a break below the 30-SMA. However, if the SMA holds firm, bulls might retest the 1.3002 level and break above to make a higher high.
Looking to trade forex now? Invest at eToro!
68% of retail investor accounts lose money when trading CFDs with this provider. You should consider whether you can afford to take the high risk of losing your money.
You have reached your limit of 5 free articles for this month.
Access all our articles, insights, and analysts.
Your coupon code
Gold price has found fresh demand above $2,450 in early trading on Thursday, looking to regain upside momentum, following a brief correction from a new record high of $2,484 set on Wednesday.
Wednesday’s Gold price retracement could be attributed to profit-taking after the bright metal touched its highest level on record. In the early part of the day, Gold price rallied hard, courtesy of the recent dovish comments from US Federal Reserve (Fed) policymakers and mixed US Retail Sales, which cemented an interest-rate cut in September.
Markets are fully pricing in the September Fed rate cut while odds of another cut in December stand at above 60%, according to the CME Group’s FedWAtch Tool.
Additionally, robust physical Gold demand from India and the weekend’s assassination attempt on former US President Donald Trump also played a part in lifting the sentiment around Gold price.
However, the renewed strength in Gold price early Thursday is seen on the back of simmering tensions surrounding US-China trade, which could escalate on a likely Trump presidency. Following the Trump attack, markets are speculating Donald Trump will win the US Presidential election race.
A report that the US was considering tighter curbs on exports of advanced semiconductor technology to China sent chip stocks and the Nasdaq tumbling overnight, led by AI pioneer Nvidia and Apple, per Reuters.
The upside attempts in Gold price, however, could be capped if the US Dollar stages a decisive comeback on risk aversion. The modest rebound in the US Treasury bond yields could also act as a headwind to the Gold price advance.
On the other side, should the USD/JPY resume its downslide amid suspected Japanese forex market intervention, the US Dollar will likely follow suit, providing extra legs to the Gold price upswing.
Markets will also pay close attention to the mid-tier US Jobless Claims data and speeches from a few Fed policymakers for a fresh trading impetus in Gold price. These speeches will dictate the market expectations on the Fed interest rate outlook before the Fed’s ‘blackout period’ kicks in on Saturday.
The European Central Bank’s (ECB) policy announcements and President Christine Lagarde’s press conference will be scrutinized for the timings and scope of additional rate cuts, which could have some impact on the non-interest-bearing Gold price.
As noted before, the path of least resistance for Gold price remains to the upside, as the 14-day Relative Strength Index (RSI) has eased after prodding the overbought territory. The RSI indicator stays well above the 50 level, pointing to more upside in the offing.
The previous week’s 21-day and 50-day Simple Moving Averages (SMA) Bull Cross also continues to favor Gold buyers.
Gold price remains poised to capture the $2,500 level if the record high at $2,484 is taken out convincingly. The next resistance level is seen at the $2,550 psychological mark.
On the flip side, if Gold price resumes correction, the previous lifetime high at $2,450 will be put to the test again, below which the $2,400 figure will come into play.
The next relevant support levels are seen at the July 11 low of $2,371 and the $2,350 psychological levels.
Gold has played a key role in human’s history as it has been widely used as a store of value and medium of exchange. Currently, apart from its shine and usage for jewelry, the precious metal is widely seen as a safe-haven asset, meaning that it is considered a good investment during turbulent times. Gold is also widely seen as a hedge against inflation and against depreciating currencies as it doesn’t rely on any specific issuer or government.
Central banks are the biggest Gold holders. In their aim to support their currencies in turbulent times, central banks tend to diversify their reserves and buy Gold to improve the perceived strength of the economy and the currency. High Gold reserves can be a source of trust for a country’s solvency. Central banks added 1,136 tonnes of Gold worth around $70 billion to their reserves in 2022, according to data from the World Gold Council. This is the highest yearly purchase since records began. Central banks from emerging economies such as China, India and Turkey are quickly increasing their Gold reserves.
Gold has an inverse correlation with the US Dollar and US Treasuries, which are both major reserve and safe-haven assets. When the Dollar depreciates, Gold tends to rise, enabling investors and central banks to diversify their assets in turbulent times. Gold is also inversely correlated with risk assets. A rally in the stock market tends to weaken Gold price, while sell-offs in riskier markets tend to favor the precious metal.
The price can move due to a wide range of factors. Geopolitical instability or fears of a deep recession can quickly make Gold price escalate due to its safe-haven status. As a yield-less asset, Gold tends to rise with lower interest rates, while higher cost of money usually weighs down on the yellow metal. Still, most moves depend on how the US Dollar (USD) behaves as the asset is priced in dollars (XAU/USD). A strong Dollar tends to keep the price of Gold controlled, whereas a weaker Dollar is likely to push Gold prices up.
Gold price has found fresh demand above $2,450 in early trading on Thursday, looking to regain upside momentum, following a brief correction from a new record high of $2,484 set on Wednesday.
Wednesday’s Gold price retracement could be attributed to profit-taking after the bright metal touched its highest level on record. In the early part of the day, Gold price rallied hard, courtesy of the recent dovish comments from US Federal Reserve (Fed) policymakers and mixed US Retail Sales, which cemented an interest-rate cut in September.
Markets are fully pricing in the September Fed rate cut while odds of another cut in December stand at above 60%, according to the CME Group’s FedWAtch Tool.
Additionally, robust physical Gold demand from India and the weekend’s assassination attempt on former US President Donald Trump also played a part in lifting the sentiment around Gold price.
However, the renewed strength in Gold price early Thursday is seen on the back of simmering tensions surrounding US-China trade, which could escalate on a likely Trump presidency. Following the Trump attack, markets are speculating Donald Trump will win the US Presidential election race.
A report that the US was considering tighter curbs on exports of advanced semiconductor technology to China sent chip stocks and the Nasdaq tumbling overnight, led by AI pioneer Nvidia and Apple, per Reuters.
The upside attempts in Gold price, however, could be capped if the US Dollar stages a decisive comeback on risk aversion. The modest rebound in the US Treasury bond yields could also act as a headwind to the Gold price advance.
On the other side, should the USD/JPY resume its downslide amid suspected Japanese forex market intervention, the US Dollar will likely follow suit, providing extra legs to the Gold price upswing.
Markets will also pay close attention to the mid-tier US Jobless Claims data and speeches from a few Fed policymakers for a fresh trading impetus in Gold price. These speeches will dictate the market expectations on the Fed interest rate outlook before the Fed’s ‘blackout period’ kicks in on Saturday.
The European Central Bank’s (ECB) policy announcements and President Christine Lagarde’s press conference will be scrutinized for the timings and scope of additional rate cuts, which could have some impact on the non-interest-bearing Gold price.
As noted before, the path of least resistance for Gold price remains to the upside, as the 14-day Relative Strength Index (RSI) has eased after prodding the overbought territory. The RSI indicator stays well above the 50 level, pointing to more upside in the offing.
The previous week’s 21-day and 50-day Simple Moving Averages (SMA) Bull Cross also continues to favor Gold buyers.
Gold price remains poised to capture the $2,500 level if the record high at $2,484 is taken out convincingly. The next resistance level is seen at the $2,550 psychological mark.
On the flip side, if Gold price resumes correction, the previous lifetime high at $2,450 will be put to the test again, below which the $2,400 figure will come into play.
The next relevant support levels are seen at the July 11 low of $2,371 and the $2,350 psychological levels.
Gold has played a key role in human’s history as it has been widely used as a store of value and medium of exchange. Currently, apart from its shine and usage for jewelry, the precious metal is widely seen as a safe-haven asset, meaning that it is considered a good investment during turbulent times. Gold is also widely seen as a hedge against inflation and against depreciating currencies as it doesn’t rely on any specific issuer or government.
Central banks are the biggest Gold holders. In their aim to support their currencies in turbulent times, central banks tend to diversify their reserves and buy Gold to improve the perceived strength of the economy and the currency. High Gold reserves can be a source of trust for a country’s solvency. Central banks added 1,136 tonnes of Gold worth around $70 billion to their reserves in 2022, according to data from the World Gold Council. This is the highest yearly purchase since records began. Central banks from emerging economies such as China, India and Turkey are quickly increasing their Gold reserves.
Gold has an inverse correlation with the US Dollar and US Treasuries, which are both major reserve and safe-haven assets. When the Dollar depreciates, Gold tends to rise, enabling investors and central banks to diversify their assets in turbulent times. Gold is also inversely correlated with risk assets. A rally in the stock market tends to weaken Gold price, while sell-offs in riskier markets tend to favor the precious metal.
The price can move due to a wide range of factors. Geopolitical instability or fears of a deep recession can quickly make Gold price escalate due to its safe-haven status. As a yield-less asset, Gold tends to rise with lower interest rates, while higher cost of money usually weighs down on the yellow metal. Still, most moves depend on how the US Dollar (USD) behaves as the asset is priced in dollars (XAU/USD). A strong Dollar tends to keep the price of Gold controlled, whereas a weaker Dollar is likely to push Gold prices up.
You have reached your limit of 5 free articles for this month.
Access all our articles, insights, and analysts.
Your coupon code
EUR/USD extended its weekly rally and touched its highest level since mid-March near 1.0950 on Wednesday. The pair stays in a consolidation phase below this level as investors wait for the European Central Bank (ECB) to announce monetary policy decisions.
The table below shows the percentage change of Euro (EUR) against listed major currencies this week. Euro was the strongest against the New Zealand Dollar.
| USD | EUR | GBP | JPY | CAD | AUD | NZD | CHF | |
|---|---|---|---|---|---|---|---|---|
| USD | -0.24% | -0.01% | -1.06% | 0.22% | 0.69% | 0.57% | -1.17% | |
| EUR | 0.24% | 0.26% | -0.63% | 0.65% | 0.96% | 1.01% | -0.73% | |
| GBP | 0.00% | -0.26% | -0.79% | 0.39% | 0.70% | 0.70% | -1.00% | |
| JPY | 1.06% | 0.63% | 0.79% | 1.29% | 1.55% | 1.61% | -0.30% | |
| CAD | -0.22% | -0.65% | -0.39% | -1.29% | 0.40% | 0.35% | -1.40% | |
| AUD | -0.69% | -0.96% | -0.70% | -1.55% | -0.40% | 0.03% | -1.69% | |
| NZD | -0.57% | -1.01% | -0.70% | -1.61% | -0.35% | -0.03% | -1.74% | |
| CHF | 1.17% | 0.73% | 1.00% | 0.30% | 1.40% | 1.69% | 1.74% |
The heat map shows percentage changes of major currencies against each other. The base currency is picked from the left column, while the quote currency is picked from the top row. For example, if you pick the Euro from the left column and move along the horizontal line to the US Dollar, the percentage change displayed in the box will represent EUR (base)/USD (quote).
The persistent selling pressure surrounding the US Dollar (USD) fuelled another leg higher in EUR/USD midweek. In the absence of high-tier data releases, dovish comments from Federal Reserve (Fed) officials didn’t allow the USD to stage a rebound.
The ECB is widely expected to leave monetary policy settings unchanged after having lowered key rates by 25 basis points in June.
Investors will scrutinize the statement language and comments from ECB President Christine Lagarde in the post-meeting press conference to figure out whether the ECB will lower key rates again in September.
In case Lagarde adopts an optimistic tone regarding the inflation outlook, the Euro could come under selling pressure even if she refrains from confirming a rate cut in September. On the other hand, the Euro could stay resilient against its rivals if Lagarde reiterates the data-dependent approach and voices concerns over upside risks to inflation.
The US economic docket will feature weekly Initial Jobless Claims data, which is forecast to come in at 230,000 following the 222,000 reported in the previous week. A reading above the market expectation could make it difficult for the USD to find demand, while a print below 220,000 could have the opposite impact on the USD valuation.
EUR/USD stays within the ascending regression channel coming from late June and the Relative Strength Index (RSI) indicator on the 4-hour chart holds above 60, suggesting that the pair remains technically bullish.
EUR/USD could face first resistance at 1.0950 (static level, mid-point of the ascending channel) before 1.0980 (upper limit of the ascending channel), 1.1000 (psychological level, static level) and 1.1030 (static level). On the downside, the lower limit of the ascending channel forms key support at 1.0900 ahead of 1.0870 (50-period Simple Moving Average) and 1.0840 (static level).
The European Central Bank (ECB) in Frankfurt, Germany, is the reserve bank for the Eurozone. The ECB sets interest rates and manages monetary policy for the region. The ECB primary mandate is to maintain price stability, which means keeping inflation at around 2%. Its primary tool for achieving this is by raising or lowering interest rates. Relatively high interest rates will usually result in a stronger Euro and vice versa. The ECB Governing Council makes monetary policy decisions at meetings held eight times a year. Decisions are made by heads of the Eurozone national banks and six permanent members, including the President of the ECB, Christine Lagarde.
In extreme situations, the European Central Bank can enact a policy tool called Quantitative Easing. QE is the process by which the ECB prints Euros and uses them to buy assets – usually government or corporate bonds – from banks and other financial institutions. QE usually results in a weaker Euro. QE is a last resort when simply lowering interest rates is unlikely to achieve the objective of price stability. The ECB used it during the Great Financial Crisis in 2009-11, in 2015 when inflation remained stubbornly low, as well as during the covid pandemic.
Quantitative tightening (QT) is the reverse of QE. It is undertaken after QE when an economic recovery is underway and inflation starts rising. Whilst in QE the European Central Bank (ECB) purchases government and corporate bonds from financial institutions to provide them with liquidity, in QT the ECB stops buying more bonds, and stops reinvesting the principal maturing on the bonds it already holds. It is usually positive (or bullish) for the Euro.
EUR/USD extended its weekly rally and touched its highest level since mid-March near 1.0950 on Wednesday. The pair stays in a consolidation phase below this level as investors wait for the European Central Bank (ECB) to announce monetary policy decisions.
The table below shows the percentage change of Euro (EUR) against listed major currencies this week. Euro was the strongest against the New Zealand Dollar.
| USD | EUR | GBP | JPY | CAD | AUD | NZD | CHF | |
|---|---|---|---|---|---|---|---|---|
| USD | -0.24% | -0.01% | -1.06% | 0.22% | 0.69% | 0.57% | -1.17% | |
| EUR | 0.24% | 0.26% | -0.63% | 0.65% | 0.96% | 1.01% | -0.73% | |
| GBP | 0.00% | -0.26% | -0.79% | 0.39% | 0.70% | 0.70% | -1.00% | |
| JPY | 1.06% | 0.63% | 0.79% | 1.29% | 1.55% | 1.61% | -0.30% | |
| CAD | -0.22% | -0.65% | -0.39% | -1.29% | 0.40% | 0.35% | -1.40% | |
| AUD | -0.69% | -0.96% | -0.70% | -1.55% | -0.40% | 0.03% | -1.69% | |
| NZD | -0.57% | -1.01% | -0.70% | -1.61% | -0.35% | -0.03% | -1.74% | |
| CHF | 1.17% | 0.73% | 1.00% | 0.30% | 1.40% | 1.69% | 1.74% |
The heat map shows percentage changes of major currencies against each other. The base currency is picked from the left column, while the quote currency is picked from the top row. For example, if you pick the Euro from the left column and move along the horizontal line to the US Dollar, the percentage change displayed in the box will represent EUR (base)/USD (quote).
The persistent selling pressure surrounding the US Dollar (USD) fuelled another leg higher in EUR/USD midweek. In the absence of high-tier data releases, dovish comments from Federal Reserve (Fed) officials didn’t allow the USD to stage a rebound.
The ECB is widely expected to leave monetary policy settings unchanged after having lowered key rates by 25 basis points in June.
Investors will scrutinize the statement language and comments from ECB President Christine Lagarde in the post-meeting press conference to figure out whether the ECB will lower key rates again in September.
In case Lagarde adopts an optimistic tone regarding the inflation outlook, the Euro could come under selling pressure even if she refrains from confirming a rate cut in September. On the other hand, the Euro could stay resilient against its rivals if Lagarde reiterates the data-dependent approach and voices concerns over upside risks to inflation.
The US economic docket will feature weekly Initial Jobless Claims data, which is forecast to come in at 230,000 following the 222,000 reported in the previous week. A reading above the market expectation could make it difficult for the USD to find demand, while a print below 220,000 could have the opposite impact on the USD valuation.
EUR/USD stays within the ascending regression channel coming from late June and the Relative Strength Index (RSI) indicator on the 4-hour chart holds above 60, suggesting that the pair remains technically bullish.
EUR/USD could face first resistance at 1.0950 (static level, mid-point of the ascending channel) before 1.0980 (upper limit of the ascending channel), 1.1000 (psychological level, static level) and 1.1030 (static level). On the downside, the lower limit of the ascending channel forms key support at 1.0900 ahead of 1.0870 (50-period Simple Moving Average) and 1.0840 (static level).
The European Central Bank (ECB) in Frankfurt, Germany, is the reserve bank for the Eurozone. The ECB sets interest rates and manages monetary policy for the region. The ECB primary mandate is to maintain price stability, which means keeping inflation at around 2%. Its primary tool for achieving this is by raising or lowering interest rates. Relatively high interest rates will usually result in a stronger Euro and vice versa. The ECB Governing Council makes monetary policy decisions at meetings held eight times a year. Decisions are made by heads of the Eurozone national banks and six permanent members, including the President of the ECB, Christine Lagarde.
In extreme situations, the European Central Bank can enact a policy tool called Quantitative Easing. QE is the process by which the ECB prints Euros and uses them to buy assets – usually government or corporate bonds – from banks and other financial institutions. QE usually results in a weaker Euro. QE is a last resort when simply lowering interest rates is unlikely to achieve the objective of price stability. The ECB used it during the Great Financial Crisis in 2009-11, in 2015 when inflation remained stubbornly low, as well as during the covid pandemic.
Quantitative tightening (QT) is the reverse of QE. It is undertaken after QE when an economic recovery is underway and inflation starts rising. Whilst in QE the European Central Bank (ECB) purchases government and corporate bonds from financial institutions to provide them with liquidity, in QT the ECB stops buying more bonds, and stops reinvesting the principal maturing on the bonds it already holds. It is usually positive (or bullish) for the Euro.
In a report sent to Rigzone by Fitch Group recently, analysts at BMI, a unit of Fitch Solutions, revealed their latest Brent oil price forecasts.
According to the report, the BMI analysts now expect the Brent price to average $85 per barrel in 2024, $82 per barrel in 2025, and $81 per barrel across 2026, 2027, and 2028.
A Bloomberg Consensus included in the report projected that the Brent price will average $84 per barrel this year, $80 per barrel next year, $79 per barrel in 2026, $73 per barrel in 2027, and $72 per barrel in 2028. BMI is a contributor to the Bloomberg Consensus, the report highlighted.
“This month we have held to our current forecast for Brent crude to average $85 per barrel this year and $82 per barrel the next,” the analysts said in the report.
“To meet our forecast for 2024, crude oil prices will have to average around $86 per barrel for the rest of the year, up from $83.5 per barrel in the year to date,” they added.
“In light of this, the balance of risk to our forecast lies firmly to the downside. However, we have opted not to revise our outlook at this point, but rather wait and see how price action plays out over the coming peak demand season in the northern hemisphere,” they continued.
Macro Outlook
In the report, the analysts said they find it difficult to make a straightforwardly bullish case for Brent off the back of the global macroeconomic outlook.
“Economic growth has shown greater than expected resilience in H1, but sticky inflation, delayed interest rate cuts, increased tariffs on China, and political risks associated with the U.S. presidential elections all paint a murkier picture for the second half of the year,” they said.
The analysts added, however, that there are bright spots too.
“Firstly, our economists are holding to their view that the U.S. Federal Reserve will cut its benchmark funds rate from 5.50 percent currently to 4.75 percent by year-end,” they said in the report.
“Secondly, despite the various risks the global economy faces, our economists believe that growth will remain relatively well-supported over the coming quarters,” they added.
“Thirdly, geopolitical risks remain elevated. The level of the risk premia currently being priced into Brent is extremely questionable,” they continued.
“Fourthly, the U.S. dollar could provide support to Brent,” the analysts went on to state, noting that “this is the shakiest of the arguments in our bullish case”.
Demand
The BMI analysts stated in the report that, as with the global macros, there is no clear-cut bullish case to be made for demand.
“However, there is ample data to defend our current price view,” they said.
“The strongest argument lies in our above-consensus forecasts for demand … the average growth forecast across the EIA, IEA, and OPEC sits at 1.4 million barrels per day for 2024, whereas we put growth for the year at 1.9 million barrels per day,” they added.
The analysts noted in the report that demand growth is highly concentrated, “with Mainland China and India accounting for over 40 percent of the net global increase in fuels consumption we forecast this year”.
“Chinese crude oil imports are highly volatile and import growth decelerated sharply year on year in the backend of 2023,” they said.
“However, growth has been recovering in 2024 and we expect further gains going forward, due to rising demand in the domestic transport and petrochemicals sectors, expanded oil refining capacity, and increased import quotas for private refiners this year,” they added.
OPEC+
The supply side has been generally supportive of prices and should remain so over the second half of 2024, the BMI analysts stated in the report.
“OPEC+ is maintaining its close management of the market, as evidenced in its recent decision to rollover its voluntary production curbs in their current form to the end of Q3, to extend the production cut deal until the end of 2025, and to only gradually return cut barrels to the market over the course of the next 18 months should conditions be supportive of increased supply,” they said.
The analysts added, however, that oil prices have not responded well to the news.
“OPEC+ action should physically tighten the market over the coming months, as demand rises strongly in the Middle East and GCC members are forced to meaningful curb their exports,” they analysts said in the report.
“Furthermore, the group has reaffirmed its commitment to adjust its production in response to changing market conditions and (implicitly) in support of prices,” they added.
Other Price Projections
In a research note sent to Rigzone by the J.P. Morgan Commodities Research team last Thursday, analysts at J.P. Morgan said, “summer inventory draws should be enough to get Brent back into the high $80s-$90 range by September”.
“Our price outlook calls for Brent to average $75 in 2025, sharply down from $83 in 2024, with prices exiting the year at $64,” they added in the note.
In a report sent to Rigzone last Tuesday by Standard Chartered Bank Commodities Research Head Paul Horsnell, the company projected that the nearby future ICE Brent price will average $98 per barrel in the third quarter of 2024 and $106 per barrel in the fourth quarter.
The company expects the commodity to average $109 per barrel in 2025, $128 per barrel in 2026, and $115 per barrel in 2027, according to the report.
In its latest short term energy outlook (STEO), which was released last month, the U.S. Energy Information Administration (EIA) projected that the Brent spot price will average $87.79 per barrel in 2024 and $85.38 per barrel in 2025.
The EIA’s previous April STEO forecast that the Brent spot price would average $88.55 per barrel this year and $86.98 per barrel next year.
To contact the author, email andreas.exarheas@rigzone.com
<
script type=”text/javascript”>
var hasDelayTriggerd = false;
var loadJS = function (url, implementationCode, location) {
//url is URL of external file, implementationCode is the code
//to be called from the file, location is the location to
//insert the
Source link
In general, the large scale of the suspected intervention in the currency markets by the Japanese Ministry of Finance, along with the weakness of the US dollar due to weak inflation data, has prompted markets to reconsider betting against the yen, and is suspected of sparking a bout of short pressure on the currency, while the momentum of the Japanese yen has slowed economic growth. Moreover, the recovery has prompted some investors not to ignore another round of intervention by Tokyo.
On the monetary policy front, the Bank of Japan is expected to announce plans to scale back bond purchases and possibly raise interest rates again at its next policy meeting later this quarter.

On the stock exchanges front, Japan’s Nikkei index falls on tech selloff. According to trading platforms, the Nikkei 225 index fell 0.43% to close at 41,098 on Wednesday, reversing gains made earlier in the session, weighed down by losses in Japanese technology stocks that followed a selloff in major U.S. technology names. Clearly, the moves came as investors continue to shift to other sectors that are expected to benefit from U.S. rate cuts, with the Dow Jones and Russell 2000 currently outperforming the S&P 500 and Nasdaq Composite. Meanwhile, the broader TOPIX index rose 0.37% to 2,915 for a second straight day.
On the local market level, A Reuters Tankan survey showed that business sentiment among major manufacturers in Japan improved to its highest level in seven months in July, despite declining confidence among non-manufacturers amid volatile economic expectations. The losses in the technology sector led the decline, with Tokyo Electron (-7.5%), Disco Corp (-4.5%), Lazartec (-5%), Advantest (-2.6%), and Rorzy Corp (-6.1%) among the hardest hit.
The USD/JPY pair has been in a selling position following recent intervention by the Bank of Japan, but the pair may find buyers at a key support area visible on the daily chart. Technically, the price has formed higher lows connected by an ascending trend line that has held since March 2023. Thus, the retreat to this support area shows that additional levels indicated by the Fibonacci retracement tool may attract buyers.
Meanwhile The 38.2% Fib level appears to be holding as support around the key psychological level of 156.00, but a larger pullback to the 50% Fibonacci level at 154.00 might be appropriate. Also, the 61.8% Fibonacci retracement aligns with the 200-day simple moving average (SMA) and the trend line at 152.05. Regarding moving averages, the 100 SMA is above the 200 SMA, emphasizing that the stronger path is upward or that the uptrend is likely to gain momentum rather than reverse. In this scenario, USD/JPY could revisit the swing high around 162.00 or at least the area of interest at 160.00.
Simultaneously, the stochastic indicator is heading south, indicating that the correction might continue, but the oscillator is also nearing the oversold region, suggesting exhaustion. Moreover, a turn to the upside would mean that buyers are ready to return. Also, the Relative Strength Index (RSI) is moving downwards and has some ground to cover before reaching the oversold area, so the correction might persist until that happens.
Want to trade our daily forex analysis and predictions? Here’s a list of forex brokers in Japan to check out.
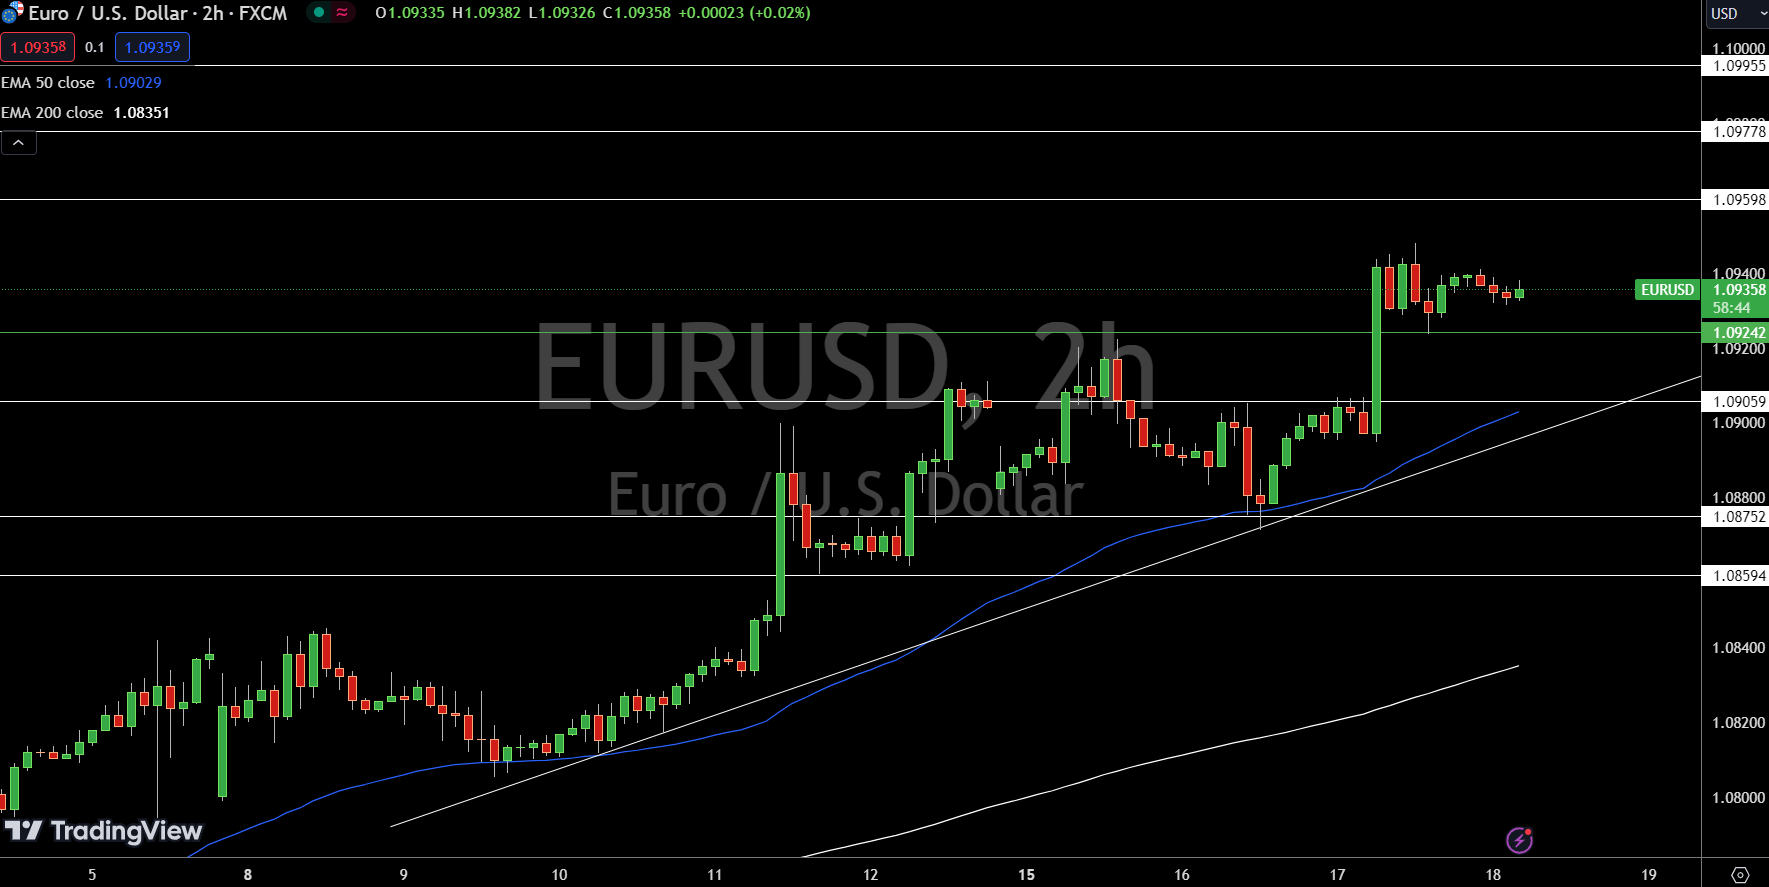
The EUR/USD currently trades at $1.09358, slightly down by 0.05%. Key levels to watch include the pivot point at $1.09242. Immediate resistance levels are identified at $1.09598, $1.09778, and $1.09955, which may cap any upside movement. On the downside, immediate support levels are $1.09059, $1.08752, and $1.08594.
Technical indicators are noteworthy, with the 50-day Exponential Moving Average (EMA) at $1.09029 and the 200-day EMA at $1.08351. These moving averages highlight the current trend dynamics.
A bullish outlook persists above the pivot point of $1.09242. However, a break below this level could trigger a sharp selling trend, leading to further declines.
According to reliable trading platforms, the GBP/USD pair fell by 0.20% during the day to 1.2940 after retail sales recorded a flat reading of 0% on a monthly basis in June, while expectations indicated a reading of -0.3%. also, Core retail sales rose by 0.4%. Clearly, this exceeded estimates by 0.1% and represents a supportive surprise for the US dollar.
Commenting on the event and the impact. “Today’s data is another reminder that you can never write off the US consumer,” said Ali Jafari, an economist at CIBC Capital Markets.
According to forex trading, the pound rose 2.50% against the dollar in July, on the cusp of levels last seen at this time a year ago, supported by rising expectations of a September rate cut. It will likely take a series of strong convincing data to reverse the course of a September cut. Furthermore, analysts say “will stronger consumption change the balance of evidence for the Fed and signal that demand in the economy could be picking up? We don’t think so. The accumulation of evidence showing inflation and a slowing labor market would be more than enough to convince the Fed to cut rates in September.”
Overall, the data shows that the exchange rate’s advance has stalled just six points short of the psychological resistance level of 1.30, which would be consistent with sell orders being placed ahead of the big mark. The July 2023 high is at 1.3142, but the pound was unable to hold these levels for very long.
In fact, what followed this high was a three-month decline that took the pair back to 1.2037. “The 1.3000 level is acting as resistance and keeping GBP/USD lower,” says Dukascopy’s technical analysis note.
The question now is: Will we see a repeat of the fall of 2023, or will the pound’s rally have the ability to hold on and build on recent gains?
For now, analysts believe that any setbacks are likely to be shallow. Dukascopy’s analysis shows that the 50-hour simple moving average could provide the support needed for the price to move above 1.3000. Added, “Above 1.3000, we could face resistance at the weekly R1 level at 1.3058 and the 1.3050 level.”
Looking ahead, the next moves in GBP/USD are likely to be driven by UK data. The risks to sterling are also asymmetric: after a strong rally, we see the GBP and other GBP-based exchange rates now in overbought territory as markets see less chance of a BoE rate cut in August this year than they did at the start of July.
Overall, if UK inflation is below expectations, the odds of a cut on 1 August will increase again, taking more heat off the GBP rally. For now, we expect weakness to be relatively contained and consistent with easing overbought conditions.
Furthermore, services inflation is forecast at 5.6% and CPI inflation is forecast at 2.0%. Any depreciation would increase the odds of a rate cut on 1 August and lead to a sharp drop in the GBP value from overbought territory. Meanwhile, analysts at Oxford Economics believe that the headline CPI inflation rate will be 1.8%, which would be lower than expected and would lead to a sell-off in the pound.
The GBP/USD exchange rate continued its strong upward march after the relatively dovish Fed statement and ahead of the upcoming UK inflation data. It has risen for three consecutive days and moved to the psychological level of 1.300, its highest swing since July 2023. The GBP/USD pair continued its strong rise after Monday’s statement by Jerome Powell, the Fed Chairman. In his statement, Powell welcomed the US inflation figures over the past three months, which showed stable prices. Powell is comfortable cutting interest rates this year if inflation continues to decline, although it is still above 2.0%. Now, the Fed seems more concerned about the labor market, which has weakened in the past few months.
The daily chart shows that the GBP/USD pair has been moving in a strong uptrend for the past few weeks. Recently, it flipped the crucial resistance point at 1.2830, which is the neckline of the inverse head and shoulders pattern. Also, it rose above the 78.6% Fibonacci retracement point at 1.2905. The pair also moved above the upper side of the XABCD pattern, which is a bullish signal. Technically, the price remains above the 50-day and 100-day moving averages. At the same time, the Relative Strength Index (RSI) has moved into overbought territory. Therefore, it is likely to the pair will review and retest the support at 1.2893 and then resume the uptrend. If this happens, it will eventually retest the resistance level at 1.3100.
Ready to trade our daily Forex analysis? We’ve made this UK forex brokers list for you to check out.
The GBP/USD price analysis shows solid bullish sentiment as the pound rallies after a higher-than-expected reading on UK inflation. Meanwhile, the dollar retreated from Tuesday’s highs as the effects of an upbeat retail sales report wore off.
–Are you interested in learning more about Forex brokers? Check our detailed guide-
Inflation in the UK remained at an annual rate of 2% in June, higher than expectations of a 1.9% increase. At the same time, services inflation came in at 5.7%, which was higher than the forecast of 5.6%. The upbeat figures might cause Bank of England policymakers to be more cautious. Moreover, the numbers lowered the likelihood of a rate cut in August, boosting the pound.Meanwhile, the US dollar fell after rallying on upbeat retail sales data in the previous session. Sales were unchanged in June, better than economist expectations for a 0.3% decline. The report showed that the economy was doing fairly well, and the risks of a recession were low.
However, inflation is also in a downtrend, meaning the Fed is getting closer to its first rate cut. Last week’s soft inflation figures pushed investors to fully price in the first rate cut by September, putting significant downward pressure on the dollar. As long as inflation continues falling, policymakers will be confident enough to cut rates even if the economy remains resilient. However, if inflation pauses or spikes while the economy is strong, the Fed will delay rate cuts.
Neither the US nor the UK will release more key reports today. Therefore, investors will keep digesting Britain’s inflation figures.
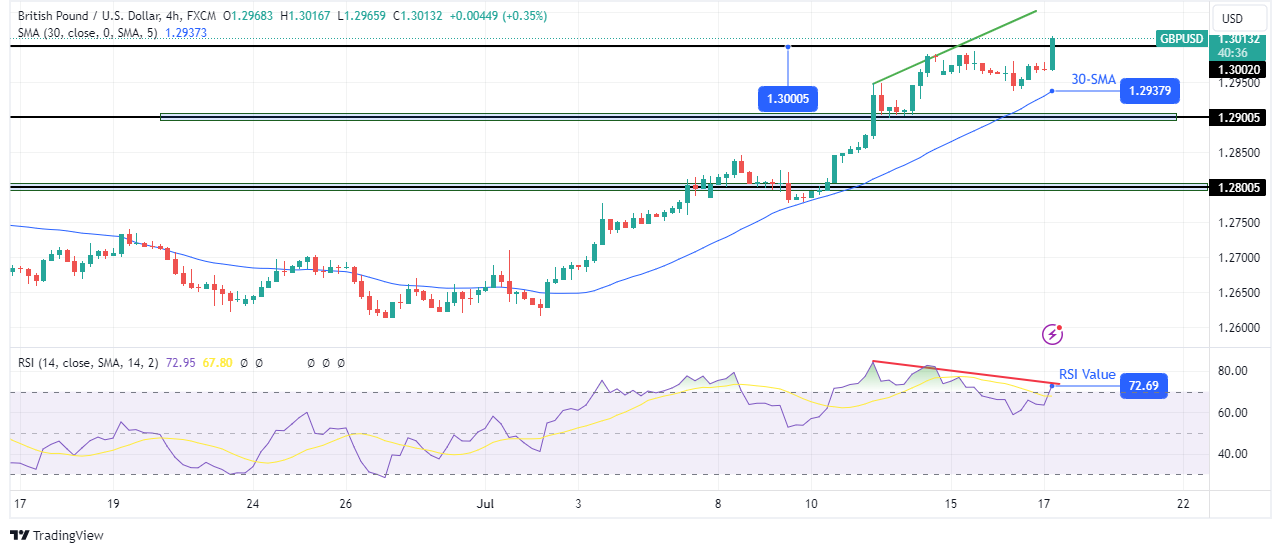
On the technical side, the GBP/USD price is breaking above the 1.3000 barrier with a solid bullish candle. However, it must close well above this level to confirm this break. Notably, the price has made consistent higher highs and lows, indicating a bullish trend. At the same time, it has respected the 30-SMA as support, trading above the line.
–Are you interested in learning more about crypto signals Telegram groups? Check our detailed guide-
However, the RSI tells a different story. The indicator has made a bearish divergence with the price, which might indicate fading bullish momentum. If the bulls are exhausted, they might fail to sustain a move above 1.3000 and pull back.
Looking to trade forex now? Invest at eToro!
68% of retail investor accounts lose money when trading CFDs with this provider. You should consider whether you can afford to take the high risk of losing your money.