The main category of Forex News.
You can use the search box below to find what you need.
[wd_asp id=1]
The main category of Forex News.
You can use the search box below to find what you need.
[wd_asp id=1]

The British pound has rallied a bit against the Japanese yen during the trading session on Tuesday, showing signs of life as we are testing the 50-Day EMA and the 200-Day EMA indicators. Ultimately, this is a situation where I think you’ve got a lot of questions to ask, but it certainly looks to me as if the British pound is trying to find its footing against the Japanese yen, or more explicitly, the Japanese yen is struggling against the British pound, and many other currencies around the world.
Pay close attention to the bond market because higher interest rates around the world will put pressure on the Japanese yen as the Bank of Japan continues to implement yield curve control. They have a hard limit of 50 basis points on the 10 year note, but at this point in time it’s not overly threatened. However, as rates rise, people will start to predict that the Japanese will have to print more currency in order to buy those bonds. This is exactly what happened last year, so there is a certain amount of recency bias to that as well.
Underneath, the ¥160 level is an area where we have seen support multiple days in a row, and have not been available to close below, despite the fact that it had attempted to do so for most of the last week. In other words, it does make quite a bit of sense that the market will continue to look at the ¥160 level as a significant barrier, and as long as we can stay above there one would have to think that there are buyers willing to get involved. Just above, we have the ¥162.50 level, an area that is of interest due to market memory coming into the picture, but it’s likely that we could then go to the ¥165 level. The ¥165 level has been a significant barrier previously, so one would have to assume that it is still very much intact. If we can break above there, obviously it would be very bullish but I don’t see that happening in the next day or so.
For a look at all of today’s economic events, check out our economic calendar.
This article was originally posted on FX Empire
The British pound initially shot higher during the trading session on Thursday, as we have seen a lot of upward pressure over the last several weeks. Ultimately, the market did give back some of the gains, showing signs of hesitation after the Bank of England raised interest rates by 50 basis points instead of the expected 25. That being said, there are some questions as to whether or not they just fired all of their shots in one go, meaning that there may not be as much to get excited about. However, at the same time we have the Bank of Japan with its loose monetary policy, and it suggests that we could see this pair eventually go higher, due to the fact that the Japanese have reiterated their desire to continue the quantitative easing.
Underneath, we have the ¥180 level, which of course is a large, round, psychologically significant figure, and an area where you would expect to see a lot of psychological importance placed on that number. If you break down below there, then it’s likely that we could go lower, perhaps reaching down to the ¥177.50 level. The market will continue to see a lot of upward momentum, but in reality, we still see plenty of traders out there that would be looking to get into this obviously bullish trade. Furthermore, even if we were to continue falling, the market would continue to see the ¥175 level offer support. Beyond that, we also have a 50-Day EMA racing toward that figure as well.
As things stand right now, I think short-term pullbacks continue to be buying opportunities, and that the market is trying to find its way to ¥185. In fact, it’s possible that we could go as high as ¥200 over the longer term, and therefore I think we’ve got a situation where longer-term traders are going to continue to hang on to this pair, but it’s obvious that the market will continue to see volatility as it typically does in this pair.
For a look at all of today’s economic events, check out our economic calendar.
This article was originally posted on FX Empire
The decline today follows a successful test of resistance around the 20-Day MA and top trendline over several days earlier this week. Given that the June 24 swing low at 2.635 failed to hold as support today, it looks like the 200-Day MA around 2.47 will be tested as support before the retracement is complete.
Notice that the 50-Day MA has almost converged with the 200-Day line thereby confirming potential support around the 200-Day line. If the 200-Day line fails to act as support, lower potential targets are identified at the 50% retracement and 61.8% Fibonacci retracement at 2.37 and 2.18, respectively.
When measuring the full upswing beginning from the April 25 swing low, the 38.2% retracement shows at 2.55. But given the rejection of the price of natural gas as the 20-Day line and subsequent bearish reaction, it is at risk of being broken. Further, this week’s swing high of 2.86 established the BC leg of a descending ABCD pattern.
The pattern completes below the 200-Day MA and near the 50% retracement at 2.34. This would seem to increase the risk of a potential decline below the 200-Day line. The 200-Day line was successfully tested as support on May 28, shortly after natural gas rallied back above the line on May 16. If it falls back below the line and then stays below it, the correction is likely to continue with a deeper retracement or consolidation.
A lower potential support zone, below the 50% retracement, is identified from around 2.235 to 2.18. This week is on track to end, completing the second week down from the June 10 high. Moreover, selling continues to dominate into Friday afternoon. Therefore, next week natural gas is at risk of continuing the bearish decline.
For a look at all of today’s economic events, check out our economic calendar.
The Pound Sterling (GBP) continued to weaken against the US Dollar (USD) for the fourth week in a row, dragging the GBP/USD pair to a six-week low just above 1.2600. All eyes turn to the much-awaited UK general elections on July 4 and the US Nonfarm Payrolls data on July 5 for a fresh directional impetus to GBP/USD.
The US Dollar extended its previous week’s strength and exacerbated GBP/USD’s pain. Greenback buyers flexed their muscles on fresh pushback by US Federal Reserve (Fed) policymakers against interest rate cuts this year, especially after the S&P Global preliminary US business activity jumped to a 26-month high on Friday. Data indicated fresh signs of US economic resilience, suggesting that the Fed could hold rates higher for longer.
Moreover, Fed Governor Michele Bowman’s hawkish commentary on Tuesday backed the US Dollar upside. Bowman said, “we are still not yet at the point where it is appropriate to lower the policy rate.” Governor Lisa Cook argued that the timing of the rate cut is unclear even though “Inflation has slowed, and the labor market tightness has eased.”
Renewed hawkish Fed expectations boosted the US Treasury bond yields, fuelling a fresh US Dollar advance at the expense of the Pound Sterling. Markets’ pricing of a 25 basis points (bps) Fed rate cut in September stayed almost unchanged at 57% during the week, according to CME FedWatch Tool.
The US Dollar also found demand from the half-year-end flows, as traders adjusted their positions heading into a likely first interest rate cut by the Fed this year. Further, the continued decline in the Japanese Yen to a 38-year low, propelled USD/JPY beyond 161.00, providing extra legs to the buck’s upsurge to two-month highs against its major currency rivals. This mainly contributed to the ongoing downtrend in the GBP/USD pair, as it touched its lowest since May 15 at 1.2613.
Meanwhile, Thursday’s mixed US final Gross Domestic Product (GDP) estimate, Durable Goods Orders and Pending Home Sales data briefly caused a retreat in the US Dollar, in part due to profit-taking ahead of Friday’s US Personal Consumption Expenditures (PCE) inflation data. The first US presidential election debate between President Joe Biden and Republican Presidential Nominee Donald Trump failed to have any meaningful market impact.
The Pound Sterling’s recovery attempts got sold into the market’s anxiety ahead of next week’s UK general elections, in the face of limited market-moving events from the UK. Data showed on Friday, the UK economy grew 0.7% QoQ in the first quarter of 2024, revised upward from the preliminary reading of 0.6%.
On the last trading day of the second quarter, the data from the US showed that the PCE Price Index remained unchanged on a monthly basis in May. The core PCE Price Index, the Fed’s preferred gauge of inflation, rose 2.6% on a yearly basis. This reading followed the 2.8% increase recorded in April and came in line with the market expectation. As the USD struggled to gather strength after this data, GBP/USD held comfortably above 1.2600 heading into the weekend.
GBP/USD traders witnessed a calm before the upcoming week’s storm, with a raft of high-impact events from both sides of the Atlantic lined up.
Monday kicks off with risk sentiment likely to be driven by Sunday’s French Parliamentary elections and China’s official Manufacturing and Services PMI data.
Later that day, the US docket will feature the ISM Manufacturing PMI report. On Tuesday, the US Job Openings survey will be published. However, the main focus will be on Fed Chair Jerome Powell’s words, as he participates in a policy panel at the annual European Central Bank’s (ECB) Forum on Central Banking in Sintra, Portugal.
GBP/USD’s reaction to Powell’s remarks could be temporary, as it is ahead of Wednesday’s Automatic Data Processing (ADP) Employment Change report, ISM Services PMI, and Minutes of the Fed’s June meeting.
The UK election will grab the eyeballs on Thursday, as Labour holds a 23-point lead over the Conservatives, according to the second and penultimate Ipsos voting intention poll of the election campaign. But, Rishi Sunak emerged as the most unpopular Prime Minister with Ipsos ever at this stage of the campaign. The outcome of the UK election is likely to have a significant impact on the Bank of England’s policy actions and the Pound Sterling’s medium-term outlook.
It’s a US market holiday on Thursday, and therefore, thin trading could exaggerate the UK election-led moves in the pair.
The US labor market report, including the Nonfarm Payrolls and Average Hourly Earnings, will be published on Friday alongside the weekly Jobless Claims data, drawing an end to an eventful week.
Traders will closely scrutinize speeches from the Fed policymakers for fresh insights on the rate-cut timing, affecting the value of the US Dollar and the performance of the major.
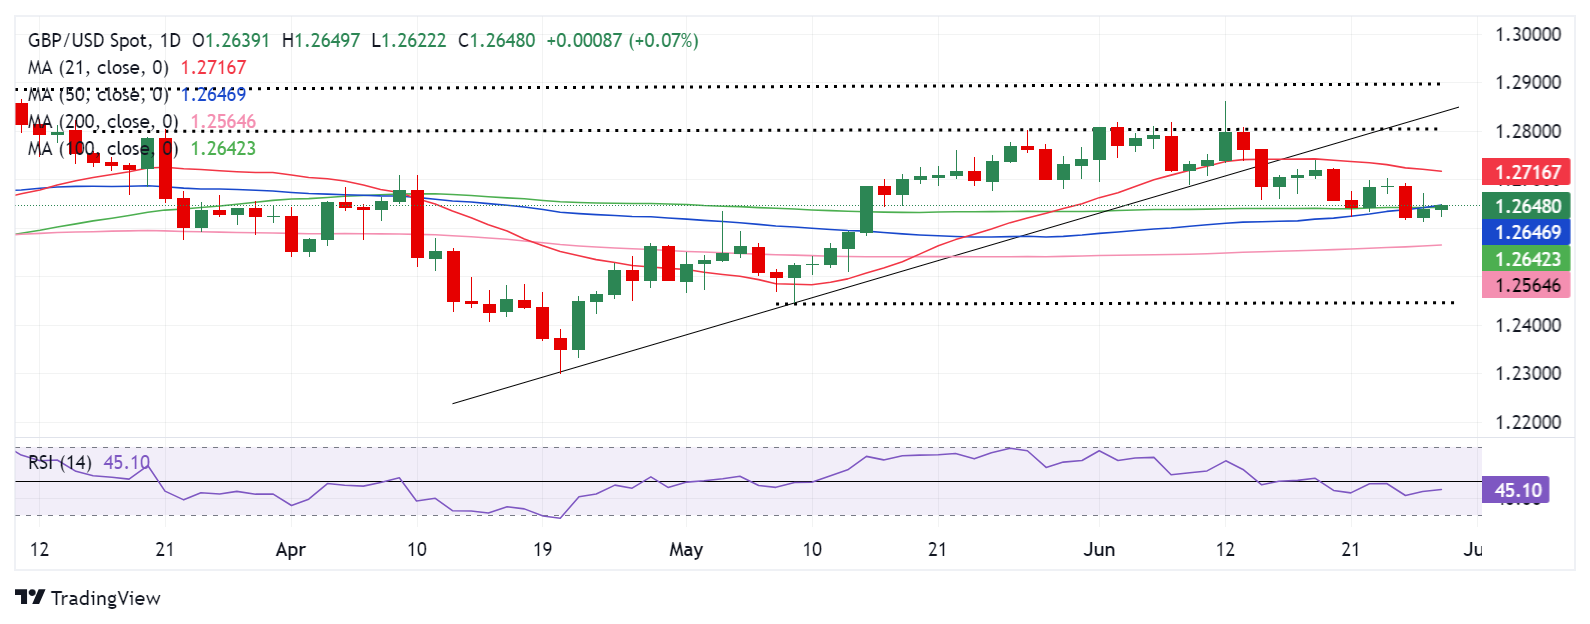
Pound Sterling extended its bearish momentum, following a downside break of the rising trendline support two weeks ago.
The 14-day Relative Strength Index (RSI) points south below 50, currently near 42, adding credence to further downside moves.
Further, the pair has also breached the key support at 1.2645, the confluence of the 50-day Simple Moving Average (SMA) and the 100-day SMA, in another bearish signal.
However, a fresh bullish crossover, represented by the 50-day SMA crossing above the 100-day SMA on Thursday, warrants caution for sellers.
GBP/USD needs a decisive break below the May 15 low of 1.2584 for the downtrend to regain traction.
The 200-day SMA at 1.2564 will be the next line of defense for Pound Sterling buyers, below which a fresh decline toward the May 9 low of 1.2446 will be on the cards.
On the flip side, buyers must yield a weekly candlestick close above the aforesaid key confluence support-turned-resistance at 1.2645. The next upside target is aligned at the 21-day SMA at 1.2715.
Acceptance above the latter would open the door for a test of the 1.2800 static resistance, followed by the March 8 high of 1.2894.
The Pound Sterling (GBP) is the oldest currency in the world (886 AD) and the official currency of the United Kingdom. It is the fourth most traded unit for foreign exchange (FX) in the world, accounting for 12% of all transactions, averaging $630 billion a day, according to 2022 data. Its key trading pairs are GBP/USD, aka ‘Cable’, which accounts for 11% of FX, GBP/JPY, or the ‘Dragon’ as it is known by traders (3%), and EUR/GBP (2%). The Pound Sterling is issued by the Bank of England (BoE).
The single most important factor influencing the value of the Pound Sterling is monetary policy decided by the Bank of England. The BoE bases its decisions on whether it has achieved its primary goal of “price stability” – a steady inflation rate of around 2%. Its primary tool for achieving this is the adjustment of interest rates. When inflation is too high, the BoE will try to rein it in by raising interest rates, making it more expensive for people and businesses to access credit. This is generally positive for GBP, as higher interest rates make the UK a more attractive place for global investors to park their money. When inflation falls too low it is a sign economic growth is slowing. In this scenario, the BoE will consider lowering interest rates to cheapen credit so businesses will borrow more to invest in growth-generating projects.
Data releases gauge the health of the economy and can impact the value of the Pound Sterling. Indicators such as GDP, Manufacturing and Services PMIs, and employment can all influence the direction of the GBP. A strong economy is good for Sterling. Not only does it attract more foreign investment but it may encourage the BoE to put up interest rates, which will directly strengthen GBP. Otherwise, if economic data is weak, the Pound Sterling is likely to fall.
Another significant data release for the Pound Sterling is the Trade Balance. This indicator measures the difference between what a country earns from its exports and what it spends on imports over a given period. If a country produces highly sought-after exports, its currency will benefit purely from the extra demand created from foreign buyers seeking to purchase these goods. Therefore, a positive net Trade Balance strengthens a currency and vice versa for a negative balance.
The US dollar initially pulled back just a bit against the Japanese yen, but then since has broken above the 160 yen level. The 160 yen level of course is a large round psychologically significant figure and an area that I think a lot of people are going to pay attention to it. Market memory comes into picture, and we could see buyers there, but even if we pull back from there, the market I think has plenty of support near the 158 yen level, possibly even the 155 yen level.
All things being equal, this is a market that I do think continues to go higher, but we are a little stretched, so don’t be surprised with a little bit of a give back. That give back should be thought of as a buying opportunity due to the fact that the interest rate differential will continue to be quite wide between the two central banks. Remember, Japan really can’t do anything with its monetary policy at the moment, while the Federal Reserve, looks very likely to hang out at this level.
So, with that being said, I think you’ve got a situation where you continue to buy dips. And I do think that given enough time, we continue to see the Japanese yen lose strength against most currencies, not just the green bank, but with interest rates high in the United States. I think this is strong. If you enjoyed the video, give me a thumbs up and make sure to subscribe.
For a look at all of today’s economic events, check out our economic calendar.
This article was originally posted on FX Empire

The British pound has gone back and forth during the trading session on Friday, as it looks like we are a little bit stretched against the Japanese yen. That being said, this is a market that does tend to be very noisy, so it should not be overly surprising if we see some type of hesitation in this area. After all, we are at the top of a major range, and it does make a certain amount of sense that we would have some work to do in order to settle all of what is going on at the moment.
Furthermore, keep in mind that the pair is very sensitive to risk appetite in general, so that of course has a major part to play. Ultimately, I think this is a situation where you have more than enough reason to believe that a pullback is probably coming, but quite frankly that doesn’t necessarily mean that you should be a seller of this pair. I think if you wait long enough, you could get an opportunity to buy a dip in what has been a very strong market. The 50-Day EMA sits near the ¥163 level, an area that of course will attract a lot of attention. All of that being said, the 50-Day EMA is just now starting to turn higher, so it will remain to be seen whether or not he can truly offer technical support. Underneath there, then we have the 200-Day EMA which sits right around the ¥162 level.
Looking at the chart, you can see that we are in an area that features a major negative candlestick from last winter that has yet to be taken out. This is why I think this area is going to be very difficult to get beyond. I’m not saying that it cannot happen, just that it may not happen very quickly. It may take a significant amount of effort to make that happen, and therefore a significant amount of caution would probably be needed at the moment, with an eye on value after dips.
For a look at all of today’s economic events, check out our economic calendar.
This article was originally posted on FX Empire
Gold (XAU/USD) came under bearish pressure and declined below $2,300 on Wednesday after starting the week in a calm manner. The pair, however, managed to recover its losses on Thursday and stabilized above $2,320. Federal Reserve (Fed) Chairman Jerome Powell’s speech at the European Central Bank’s (ECB) Forum on Central Banking in Sintra on Tuesday and key macroeconomic data releases from the US, including the June jobs report, could help Gold break out of its range next week.
In the absence of high-tier macroeconomic data releases, the cautious market mood and hawkish comments from Fed officials allowed the US Dollar (USD) to stay resilient against its rivals and made it difficult for Gold to gain traction at the start of the week. Meanwhile, the data from the US showed on Tuesday that the Conference Board (CB) Consumer Confidence Index edged lower to 100.4 in June from 101.3 in May, while the Present Situation Index improved to 141.5 from 140.8 in the same period.
Fed Governor Michelle Bowman said on Tuesday that they are not yet at the point where it is appropriate to cut interest rates, adding that she is willing to raise rates at a future meeting if inflation progress were to stall or reverse.
The benchmark 10-year US Treasury bond yield gathered bullish momentum late Tuesday following Bowman’s comments and continued to push higher on Wednesday. In turn, XAU/USD dropped below $2,300 for the first time in two weeks.
Mixed data releases from the US opened the door for a rebound in XAU/USD on Thursday. The Bureau of Economic Analysis (BEA) announced that it revised the annualized Gross Domestic Product (GDP) growth for the first quarter to 1.4% from 1.3% in the previous estimate. On a negative note, Durable Goods Orders ex Defense declined 0.2% in May after staying unchanged in April, while Pending Home Sales contracted by 2.1% on a monthly basis in May, highlighting worsening conditions in the housing market.
The BEA reported on Friday that inflation in the US, as measured by the change in the Personal Consumption Expenditures (PCE) Price Index, edged lower to 2.6% on a yearly basis in May from 2.7% in April, as expected. On a monthly basis, the PCE Price Index was unchanged in May, while the annual core PCE Price Index, which excludes volatile food and energy prices, rose 2.6% in the same period, down from the 2.8% increase recorded in April. Finally, the monthly core PCE Price Index rose 0.1%. The USD struggled to find demand following the PCE inflation data, allowing gold to cling to its daily gains in the American session on Friday.
The ISM Manufacturing Purchasing Managers Index (PMI) data for June will be featured in the US economic docket on Monday. The headline PMI is forecast to improve to 49 from 48.7 in May. A reading above 50, which would point to a return to expansion in the sector’s business activity, could support the USD and limit Gold’s upside in the American trading hours.
On Tuesday, the Bureau of Labor Statistics (BLS) will release the JOLTS Job Openings data for May. Investors are likely to ignore this report and stay focused on Fed Chairman Jerome Powell’s speech at the ECB’s Forum on Central Banking. This will be Powell’s first public appearance since he spoke at the press conference following the June policy meeting.
If Powell voices a preference for a single rate hike this year, the initial reaction could provide a boost to the USD. On the other hand, investors could remain hopeful about an interest rate cut in September if Powell reiterates the data-dependent approach and refrains from dismissing the possibility of a policy pivot before the end of the year. According to the CME FedWatch Tool, markets are currently pricing in a 36% probability of the Fed leaving the policy rate unchanged in September.
Weekly Initial Jobless Claims, ADP Employment Change and the ISM Services PMI data will be released on Wednesday. Investors might remain reluctant to take positions based on these data because stock and bond markets will remain closed in observance of the July 4 holiday on Thursday. More importantly, the BLS will publish the June jobs report on Friday, which will include Nonfarm Payrolls (NFP), Unemployment Rate and wage inflation figures.
Late Wednesday, the FOMC will release the Minutes of the June policy meeting. The publication is unlikely to offer any fresh clues regarding the Fed’s interest rate outlook.
Following the stronger-than-forecast increase of 272,000 in May, NFP is expected to rise 180,000 in June. The Unemployment Rate is seen holding steady at 4% and the wage inflation, as measured by the change in the Average Hourly Earnings, is anticipated to grow 0.3%, down slightly from 0.4% growth in May. Unless there is a significant downward revision to the May NFP print, an increase of 200,000 or more in June could help the USD outperform its rivals ahead of the weekend. On the flip side, an increase of less than 150,000 could be seen as a sign of loosening conditions in the labor market and cause the USD to lose interest. In this scenario, XAU/USD is likely to end the week on a bullish note.
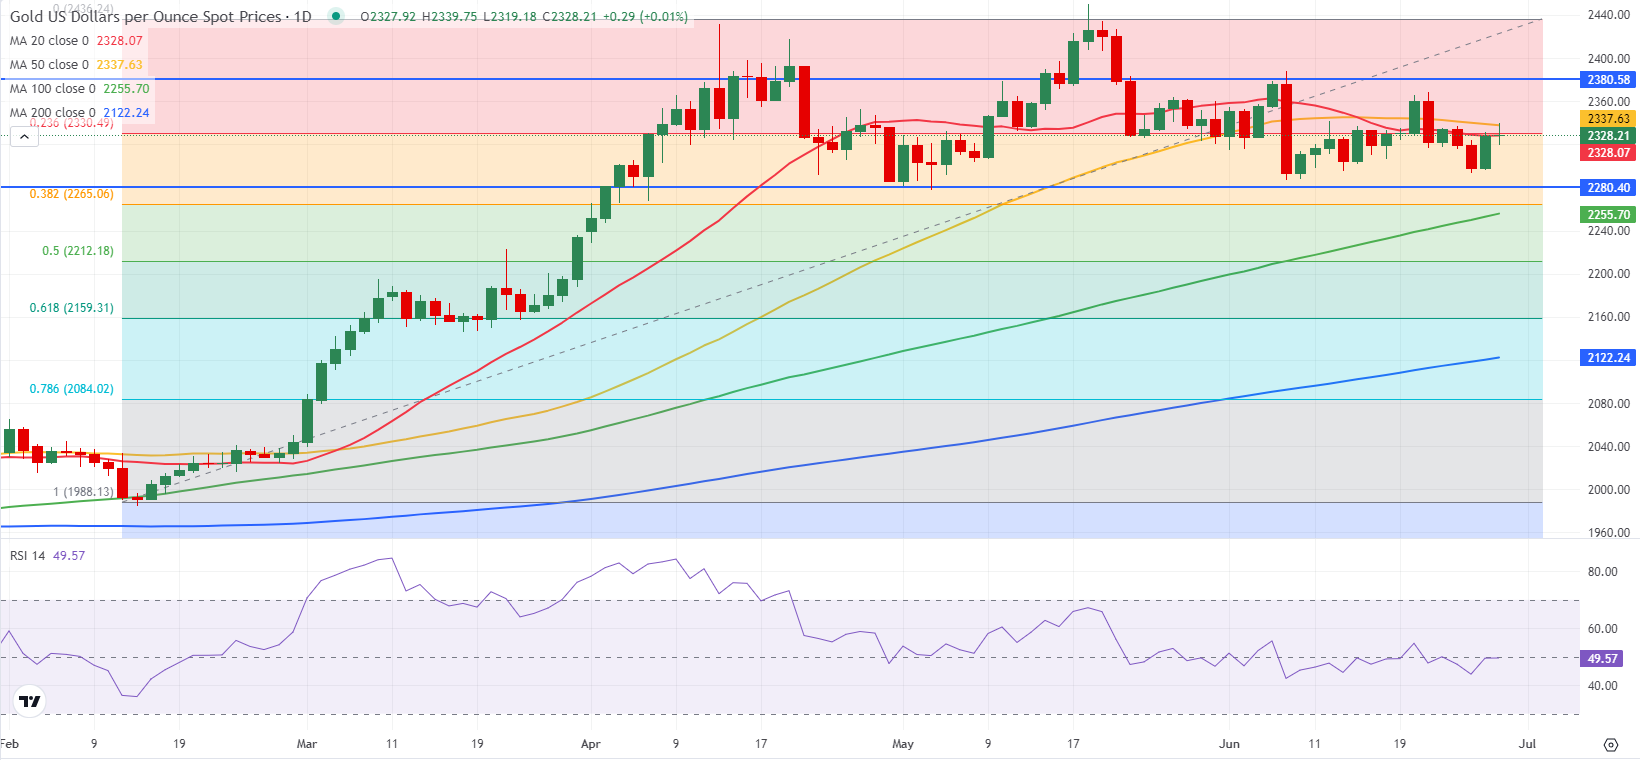
The Relative Strength Index (RSI) indicator on the daily chart moves sideways near 50, highlighting a lack of directional momentum. Although Gold held above $2,300 (psychological level), it has yet to clear the 50-day Simple Moving Average (SMA), currently located near $2,340. If XAU/USD rises above this level and confirms it as support, technical buyers could take action. In this scenario, $2,380 (static level) could be seen as the next resistance before $2,400 (psychological level, static level).
On the downside, additional losses toward $2,280 (static level) and $2,265-$2,255 (Fibonacci 38.2% retracement of the mid-February-June uptrend, 100-day SMA) could be seen if $2,300 support fails.
Monetary policy in the US is shaped by the Federal Reserve (Fed). The Fed has two mandates: to achieve price stability and foster full employment. Its primary tool to achieve these goals is by adjusting interest rates. When prices are rising too quickly and inflation is above the Fed’s 2% target, it raises interest rates, increasing borrowing costs throughout the economy. This results in a stronger US Dollar (USD) as it makes the US a more attractive place for international investors to park their money. When inflation falls below 2% or the Unemployment Rate is too high, the Fed may lower interest rates to encourage borrowing, which weighs on the Greenback.
The Federal Reserve (Fed) holds eight policy meetings a year, where the Federal Open Market Committee (FOMC) assesses economic conditions and makes monetary policy decisions. The FOMC is attended by twelve Fed officials – the seven members of the Board of Governors, the president of the Federal Reserve Bank of New York, and four of the remaining eleven regional Reserve Bank presidents, who serve one-year terms on a rotating basis.
In extreme situations, the Federal Reserve may resort to a policy named Quantitative Easing (QE). QE is the process by which the Fed substantially increases the flow of credit in a stuck financial system. It is a non-standard policy measure used during crises or when inflation is extremely low. It was the Fed’s weapon of choice during the Great Financial Crisis in 2008. It involves the Fed printing more Dollars and using them to buy high grade bonds from financial institutions. QE usually weakens the US Dollar.
Quantitative tightening (QT) is the reverse process of QE, whereby the Federal Reserve stops buying bonds from financial institutions and does not reinvest the principal from the bonds it holds maturing, to purchase new bonds. It is usually positive for the value of the US Dollar.
The USD/JPY price analysis is bullish as the dollar trades at a 38-year high against the yen ahead of US inflation data. Investors fear a possible intervention as the yen trades at its weakest level since 1986.
–Are you interested in learning more about next crypto to explode? Check our detailed guide-
The dollar has risen since the start of the year due to a decline in Fed rate cut expectations. Currently, it is heading for its second quarter of gains, with the Fed forecasting just one rate cut this year. Meanwhile, investors are expecting at least two. Nevertheless, the outlook will largely depend on incoming data.
Notably, data on Thursday showed the US economy expanded at a 1.4% rate in the first quarter, an increase from the previous 1.3% increase. At the same time, unemployment claims dropped last week from 239K to 233K, indicating labor market strength. Markets are now awaiting the PCE report, which might show inflation easing to 2.6% in May. Lower inflation would raise bets for rate cuts and weaken the dollar. This would give the yen some relief after its recent plunge.
Meanwhile, core inflation in Japan’s capital, Tokyo, increased in June as a weak yen drove import costs higher. The core CPI rose by 2.1% after last month’s 1.9% increase.
Furthermore, data revealed an increase of 2.8% in Japan’s factory output in May. This was a more significant number than the forecast of 2.0%. These reports increased the chances that the Bank of Japan will cut rates in July. Still, this was not enough to stem the yen’s decline.
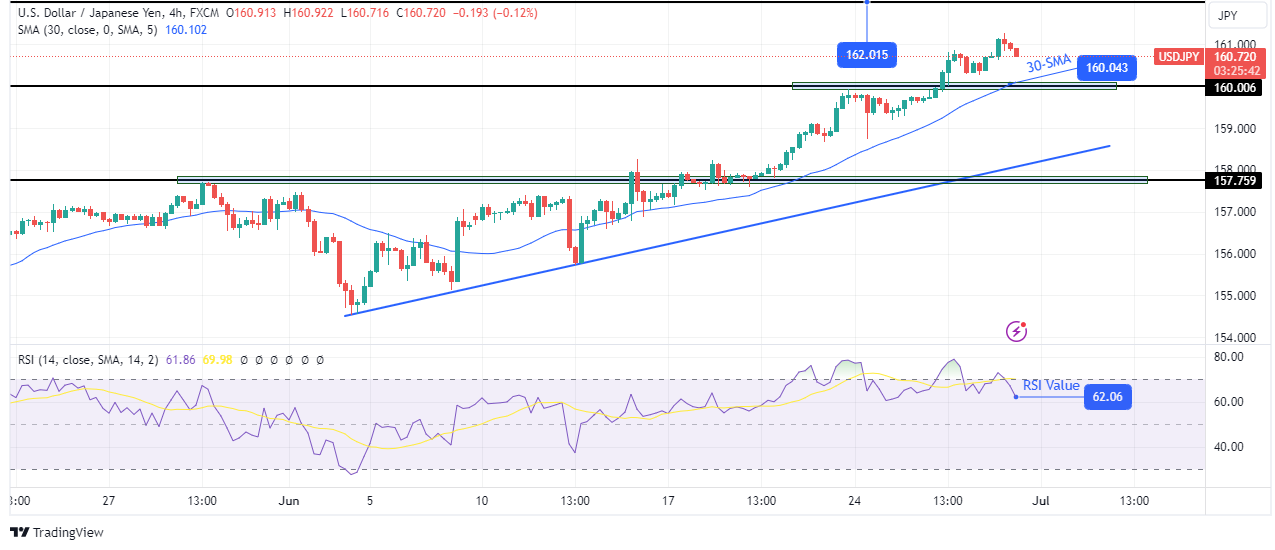
On the technical side, the USD/JPY price is on a solid bullish trend that recently broke above the 160.00 critical resistance level. Moreover, the price sits above the 30-SMA, and the RSI is going in and out of the overbought region, showing solid bullish momentum.
–Are you interested in learning more about forex tools? Check our detailed guide-
Furthermore, the uptrend is making such short pullbacks, a sign that bulls are much stronger than bears. Currently, the price has paused and is pulling back. It might retest the 30-SMA support before continuing higher. The next major resistance is at the 16.01 level.
Looking to trade forex now? Invest at eToro!
68% of retail investor accounts lose money when trading CFDs with this provider. You should consider whether you can afford to take the high risk of losing your money.
You have reached your limit of 5 free articles for this month.
Access all our articles, insights, and analysts.
Your coupon code
EUR/USD stays in a consolidation phase at around 1.0700 on Friday after posting small gains on Thursday.
The table below shows the percentage change of Euro (EUR) against listed major currencies this week. Euro was the weakest against the Australian Dollar.
| USD | EUR | GBP | JPY | CAD | AUD | NZD | CHF | |
|---|---|---|---|---|---|---|---|---|
| USD | -0.02% | 0.06% | 0.72% | 0.11% | -0.03% | 0.76% | 0.68% | |
| EUR | 0.02% | 0.10% | 0.79% | 0.18% | 0.02% | 0.85% | 0.77% | |
| GBP | -0.06% | -0.10% | 0.63% | 0.08% | -0.09% | 0.73% | 0.67% | |
| JPY | -0.72% | -0.79% | -0.63% | -0.60% | -0.71% | 0.08% | -0.05% | |
| CAD | -0.11% | -0.18% | -0.08% | 0.60% | -0.13% | 0.65% | 0.59% | |
| AUD | 0.03% | -0.02% | 0.09% | 0.71% | 0.13% | 0.82% | 0.75% | |
| NZD | -0.76% | -0.85% | -0.73% | -0.08% | -0.65% | -0.82% | -0.07% | |
| CHF | -0.68% | -0.77% | -0.67% | 0.05% | -0.59% | -0.75% | 0.07% |
The heat map shows percentage changes of major currencies against each other. The base currency is picked from the left column, while the quote currency is picked from the top row. For example, if you pick the Euro from the left column and move along the horizontal line to the US Dollar, the percentage change displayed in the box will represent EUR (base)/USD (quote).
The US Bureau of Economic Analysis will release the Personal Consumption Expenditures (PCE) Price Index data for May, the Federal Reserve’s preferred gauge of inflation, later in the day. Investors are likely to react to the monthly core PCE Price Index print, which is not distorted by base effects and excludes volatile food and energy prices.
Investors expect the monthly core PCE Price Index to rise 0.1% in May following the 0.2% increase recorded in April. A reading at or below the market expectation could make it difficult for the US Dollar (USD) to find demand in the American session. On the other hand, a print of 0.2% or higher could provide a boost to the USD and weigh on EUR/USD.
Even if the PCE inflation report hurts the USD, EUR/USD could struggle to stage a decisive rebound, with investors refraining from positioning themselves for an extended Euro strength ahead of the first round of election in France this weekend.
It’s also worth noting that this Friday is the last trading day of the second quarter. Quarter-end flows and position adjustments later in the day could ramp up market volatility and trigger irregular movements in major currency pairs.
1.0670, the Fibonacci 78.6% retracement of the latest uptrend, stays intact as strong support. In case EUR/USD drops below this level and confirms it as resistance, 1.0600 (psychological level, static level) could be set as the next bearish target.
On the upside, 1.0700 (psychological level, static level) aligns as interim resistance before 1.0730-1.0745 (Fibonacci 61.8% retracement, 100-period Simple Moving Average) and 1.0760 (Fibonacci 50% retracement).
EUR/USD stays in a consolidation phase at around 1.0700 on Friday after posting small gains on Thursday.
The table below shows the percentage change of Euro (EUR) against listed major currencies this week. Euro was the weakest against the Australian Dollar.
| USD | EUR | GBP | JPY | CAD | AUD | NZD | CHF | |
|---|---|---|---|---|---|---|---|---|
| USD | -0.02% | 0.06% | 0.72% | 0.11% | -0.03% | 0.76% | 0.68% | |
| EUR | 0.02% | 0.10% | 0.79% | 0.18% | 0.02% | 0.85% | 0.77% | |
| GBP | -0.06% | -0.10% | 0.63% | 0.08% | -0.09% | 0.73% | 0.67% | |
| JPY | -0.72% | -0.79% | -0.63% | -0.60% | -0.71% | 0.08% | -0.05% | |
| CAD | -0.11% | -0.18% | -0.08% | 0.60% | -0.13% | 0.65% | 0.59% | |
| AUD | 0.03% | -0.02% | 0.09% | 0.71% | 0.13% | 0.82% | 0.75% | |
| NZD | -0.76% | -0.85% | -0.73% | -0.08% | -0.65% | -0.82% | -0.07% | |
| CHF | -0.68% | -0.77% | -0.67% | 0.05% | -0.59% | -0.75% | 0.07% |
The heat map shows percentage changes of major currencies against each other. The base currency is picked from the left column, while the quote currency is picked from the top row. For example, if you pick the Euro from the left column and move along the horizontal line to the US Dollar, the percentage change displayed in the box will represent EUR (base)/USD (quote).
The US Bureau of Economic Analysis will release the Personal Consumption Expenditures (PCE) Price Index data for May, the Federal Reserve’s preferred gauge of inflation, later in the day. Investors are likely to react to the monthly core PCE Price Index print, which is not distorted by base effects and excludes volatile food and energy prices.
Investors expect the monthly core PCE Price Index to rise 0.1% in May following the 0.2% increase recorded in April. A reading at or below the market expectation could make it difficult for the US Dollar (USD) to find demand in the American session. On the other hand, a print of 0.2% or higher could provide a boost to the USD and weigh on EUR/USD.
Even if the PCE inflation report hurts the USD, EUR/USD could struggle to stage a decisive rebound, with investors refraining from positioning themselves for an extended Euro strength ahead of the first round of election in France this weekend.
It’s also worth noting that this Friday is the last trading day of the second quarter. Quarter-end flows and position adjustments later in the day could ramp up market volatility and trigger irregular movements in major currency pairs.
1.0670, the Fibonacci 78.6% retracement of the latest uptrend, stays intact as strong support. In case EUR/USD drops below this level and confirms it as resistance, 1.0600 (psychological level, static level) could be set as the next bearish target.
On the upside, 1.0700 (psychological level, static level) aligns as interim resistance before 1.0730-1.0745 (Fibonacci 61.8% retracement, 100-period Simple Moving Average) and 1.0760 (Fibonacci 50% retracement).