The main category of Forex News.
You can use the search box below to find what you need.
[wd_asp id=1]
The main category of Forex News.
You can use the search box below to find what you need.
[wd_asp id=1]
The U.S. Dollar initially pulled back just a bit against the Japanese Yen in the early hours of Thursday, but it continues to climb higher as we are extraordinarily bullish. Keep in mind that the interest rate differential between the United States and Japan continues to be wide enough to drive a truck through, and as long as that’s going to be the case, it makes a lot of sense that the US dollar continues to climb. The short-term pullback, when it does come, typically offers a buying opportunity that people are willing to jump on because they get paid at the end of every day and quite significantly to hold this pair.
The Federal Reserve is nowhere near cutting interest rates and now there’s even thoughts that maybe they won’t at all this year. And if that’s going to be the case, then we will just continue to see this market go higher. The Bank of Japan did intervene just above current levels, but really at this point, it looks like it’s a foregone conclusion that we will eventually reach the 160 yen level and then take that barrier out.
This is a market that over the longer term will continue to be very noisy. Um, but I think there’s so much in the way of support underneath. You just simply cannot go in the other direction. The 50 day EMA sits right around the 155.50 level with the 155 level underneath the hard floor. If you squint, you can see an ascending triangle. And I think we go much higher.
For a look at all of today’s economic events, check out our economic calendar.
This article was originally posted on FX Empire
You have reached your limit of 5 free articles for this month.
Access all our articles, insights, and analysts.
Your coupon code
The resumption of the positive trend in the US Dollar (USD) motivated the USD Index (DXY) to reverse part of the recent weakness while putting the risk-linked galaxy under noticeable pressure and sending EUR/USD back to the proximity of the 1.0700 neighbourhood on Thursday.
On another front, the pair’s decent drop came despite further easing of political concerns on the old continent, particularly in France, ahead of the first round of the snap elections scheduled for June 30.
Still in the region, the European Central Bank’s (ECB) Klaas Knot supported market expectations for one or two more interest rate cuts this year, noting that inflation appeared to be moving towards the 2% target.
On this, money markets see around 42 bps of easing by year-end, while market consensus expects the ECB to maintain its policy rate unchanged at its July 18 gathering.
Regarding the Fed, Minneapolis Fed President Neel Kashkari suggested early in the session that it could take one or two years for US inflation to reach the Fed’s target.
Additionally, the CME Group’s FedWatch Tool now indicates nearly a 66% probability of lower interest rates in September.
In the short term, the European Central Bank’s (ECB) recent rate cut, contrasting with the Fed’s decision to maintain rates, has widened the policy gap between the two central banks, potentially exposing EUR/USD to further weakness.
Looking ahead, the Eurozone’s emerging economic recovery and perceived slowdowns in the US economy are expected to mitigate this disparity, providing some support for the pair in the short term.
EUR/USD daily chart
If EUR/USD rebound gains traction, the 200-day SMA at 1.0788 looms as the next objective, ahead of the weekly peak of 1.0852 (June 12) and the June high of 1.0916 (June 4). The breakout of this level reveals the March top of 1.0981 (March 8), followed by the weekly peak of 1.0998 (January 11), and the critical 1.1000 yardstick.
If bears take control, the pair may revisit the June low of 1.0667 (June 14), seconded by the May low of 1.0649 (May 1), and finally the 2024 bottom of 1.0601 (April 16).
The 4-hour chart as far shows some signs of renewed weakness. Initial resistance comes at 1.0761 ahead of 1.0808 and 1.0852, 1. The earliest support appears at 1.0667, followed by 1.0649 and 1.0601. The Relative Strength Index (RSI) has stabilized around 37.
The resumption of the positive trend in the US Dollar (USD) motivated the USD Index (DXY) to reverse part of the recent weakness while putting the risk-linked galaxy under noticeable pressure and sending EUR/USD back to the proximity of the 1.0700 neighbourhood on Thursday.
On another front, the pair’s decent drop came despite further easing of political concerns on the old continent, particularly in France, ahead of the first round of the snap elections scheduled for June 30.
Still in the region, the European Central Bank’s (ECB) Klaas Knot supported market expectations for one or two more interest rate cuts this year, noting that inflation appeared to be moving towards the 2% target.
On this, money markets see around 42 bps of easing by year-end, while market consensus expects the ECB to maintain its policy rate unchanged at its July 18 gathering.
Regarding the Fed, Minneapolis Fed President Neel Kashkari suggested early in the session that it could take one or two years for US inflation to reach the Fed’s target.
Additionally, the CME Group’s FedWatch Tool now indicates nearly a 66% probability of lower interest rates in September.
In the short term, the European Central Bank’s (ECB) recent rate cut, contrasting with the Fed’s decision to maintain rates, has widened the policy gap between the two central banks, potentially exposing EUR/USD to further weakness.
Looking ahead, the Eurozone’s emerging economic recovery and perceived slowdowns in the US economy are expected to mitigate this disparity, providing some support for the pair in the short term.
EUR/USD daily chart
If EUR/USD rebound gains traction, the 200-day SMA at 1.0788 looms as the next objective, ahead of the weekly peak of 1.0852 (June 12) and the June high of 1.0916 (June 4). The breakout of this level reveals the March top of 1.0981 (March 8), followed by the weekly peak of 1.0998 (January 11), and the critical 1.1000 yardstick.
If bears take control, the pair may revisit the June low of 1.0667 (June 14), seconded by the May low of 1.0649 (May 1), and finally the 2024 bottom of 1.0601 (April 16).
The 4-hour chart as far shows some signs of renewed weakness. Initial resistance comes at 1.0761 ahead of 1.0808 and 1.0852, 1. The earliest support appears at 1.0667, followed by 1.0649 and 1.0601. The Relative Strength Index (RSI) has stabilized around 37.
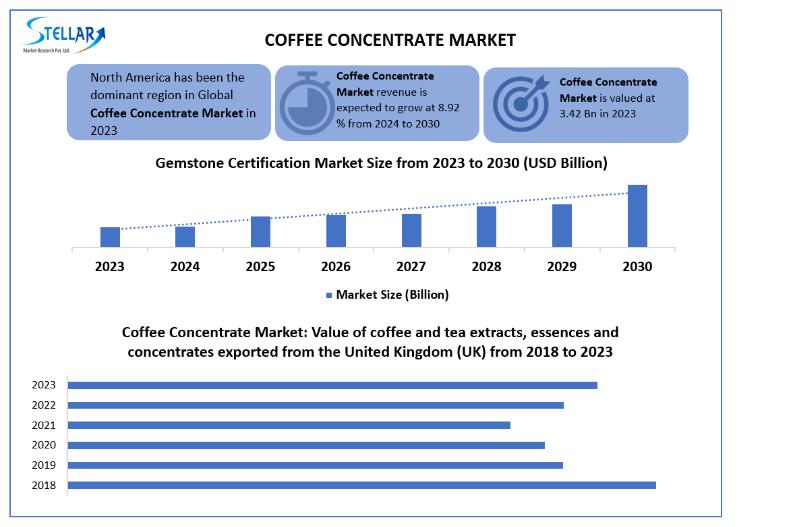
Coffee Concentrate Market was valued at USD 3.42 Billion in 2023 and is expected to grow at a CAGR of 8.92 Percent over the forecast period to reach USD 6.22 Billion by 2030.Coffee Concentrate Market is segmented into Coffee Concentrate by Product Type, End User, Product Format, and Region. For the estimation of the Coffee Concentrate Market size, the bottom-up approach was used.
To access more details regarding this research, visit the following webpage:https://www.stellarmr.com/report/Coffee-Concentrate-Market/1942
Coffee Concentrate Market Overview
The coffee concentrate is incredibly strong, highly concentrated coffee that can be used to make your favourite coffee drinks such as iced coffee, and regular coffee as well as cocktails and desserts. Coffee concentrate is made by placing coarsely ground coffee beans in cold water and leaving it to brew. The result is a highly concentrated liquid, which when diluted becomes palatable. It can then be used to make almost any coffee drink.
Coffee Concentrate Market Dynamics
The coffee concentrate market is driven by the growing demand for convenient beverage options in today’s fast-paced lifestyles, changing consumer preferences towards premium and specialty coffee products, and increasing health awareness leading to the adoption of healthier alternatives like cold brew concentrates. Continuous innovation in flavors, formulations, and packaging formats, coupled with expanding distribution channels, contributes to market growth. Additionally, the overall rise in coffee consumption globally, driven by urbanization and lifestyle changes, further propels the market forward, while the emphasis on environmental sustainability encourages the development of eco-friendly coffee products and packaging, appealing to environmentally conscious consumers and driving market competitiveness.
North America leads the market, driven by a strong coffee culture, increasing demand for convenient beverage options, and a growing preference for premium and specialty coffee products.
coffee concentrate consumption is fueled by the popularity of cold brew variants, health-conscious consumer trends, and a preference for artisanal and sustainable coffee options. The Asia Pacific region exhibits significant growth potential, supported by rapid urbanization, changing lifestyles, and the rising adoption of Western coffee consumption habits. Latin America, known for its rich coffee heritage, presents opportunities for market expansion with its abundance of high-quality coffee beans and growing interest in innovative coffee products. Africa, with its emerging coffee culture and growing middle class, holds promise for market growth, particularly in countries with increasing urbanization and disposable incomes.
For in-depth information on this study, visit the following link:https://www.stellarmr.com/report/req_sample/Coffee-Concentrate-Market/1942
Coffee Concentrate Market Segmentation
By Type
Caffeinated
Decaffeinated
Caffeinated coffee concentrates hold a prominent position in the market, drawing in consumers who crave the familiar taste and invigorating effects of traditional coffee.
This segment commands a substantial share due to the widespread preference for caffeinated beverages among both coffee enthusiasts and casual drinkers. Conversely, the decaffeinated coffee concentrate segment, though smaller, is witnessing growth as consumers increasingly prioritize wellness and seek flavorful options devoid of caffeine’s stimulating effects.
By Distribution Channel
Supermarkets and Hypermarkets
Convenience Stores
Online Retail Platforms
Others
By Packaging
Bottles
Pouches
Others
By Source
Arabica
Robusta
Others
To Learn More About This Study, Please Click Here:https://www.stellarmr.com/report/req_sample/Coffee-Concentrate-Market/1942
Coffee Concentrate Market’s Key Players include:
Starbucks Corporation (Seattle, Washington, United States)
Nestlé S.A. (Vevey, Switzerland)
JAB Holding Company (Luxembourg City, Luxembourg)
Illycaffè S.p.A. (Trieste, Italy)
The Coca-Cola Company (Atlanta, Georgia, United States)
Keurig Dr Pepper Inc. (Burlington, Massachusetts, United States)
Suntory Holdings Limited (Tokyo, Japan)
UCC Ueshima Coffee Co., Ltd. (Kobe, Japan)
Califia Farms LLC (Los Angeles, California, United States)
La Colombe Coffee Roasters (United States)
Key questions answered in the Coffee Concentrate Market are:
What is Coffee Concentrate?
What was the Coffee Concentrate Market size in 2023?
What is the expected Coffee Concentrate Market size by 2030?
What is the growth rate of the Coffee Concentrate Market?
What are the key benefits of the Coffee Concentrate Market?
Key Offerings:
Past Market Size and Competitive Landscape (2018 to 2022)
Past Pricing and price curve by region (2018 to 2022)
Market Size, Share, Size & Forecast by different segment | 2023 -2030
Market Dynamics – Growth Drivers, Restraints, Opportunities, and Key Trends by Region
Market Segmentation – A detailed analysis by Type, Distribution Channel, Packaging, Source, and Region
Competitive Landscape – Profiles of selected key players by region from a strategic perspective
Competitive landscape – Market Leaders, Market Followers, Regional player
Competitive benchmarking of key players by region
PESTLE Analysis
PORTER’s analysis
Value chain and supply chain analysis
Legal Aspects of Business by Region
Lucrative business opportunities with SWOT analysis
Recommendations
Stellar Market Research is a leading Consumer Goods & Services research firm that has also published the following reports:
Microneedling Market https://www.stellarmr.com/report/Microneedling-Market/2047
Daptomycin Market https://www.stellarmr.com/report/Daptomycin-Market/2065
Febrile Seizures Market https://www.stellarmr.com/report/Febrile-Seizures-Market/2064
Car Air Purifier Market https://www.stellarmr.com/report/Car-Air-Purifier-Market/2069
Cheilectomy Market https://www.stellarmr.com/report/Cheilectomy-Market/2055
Contact Stellar Market Research:
S.no.8, h.no. 4-8 Pl.7/4 Kothrud
Pinnac Memories Fl. No. 3
Kothrud, Pune, Maharashtra, 411029
sales@stellarmr.com
+91 9607365656
About Stellar Market Research:
Stellar Market Research is a multifaceted market research and consulting company with professionals from several industries. Some of the industries we cover include medical devices, pharmaceutical manufacturers, science and engineering, electronic components, industrial equipment, technology and communication, cars and automobiles, chemical products and substances, general merchandise, beverages, personal care, and automated systems. To mention a few, we provide market-verified industry estimations, technical trend analysis, crucial market research, strategic advice, competition analysis, production and demand analysis, and client impact studies.
This release was published on openPR.
The Pound Sterling collapsed during the North American session, below the 1.2700 figure after the Bank of England (BoE) decided to keep rates unchanged but hinted at a possible cut in the summer. The GBP/USD trades at 1.2677, down 0.30%.
From a technical perspective, the GBP/USD is neutral to upward biased, but as it approaches the confluence of the 100-day moving average (DMA) and the May 3 high turned support at around 1.2643/38, a pierce underneath that zone, would accelerate the downtrend, change the pair bias and challenge the 50-DMA at 1.2619. Further losses are seen underneath the atter at 1.2600, ahead of testing the 200-DMA at 1.2551.
On the other hand, if buyers lift the exchange rate above 1.2700, the GBP/USD might get to the current week’s high of 1.2739. Once cleared, the next stop would be the already tested 1.2800 mark.
The table below shows the percentage change of British Pound (GBP) against listed major currencies today. British Pound was the strongest against the Swiss Franc.
| USD | EUR | GBP | JPY | CAD | AUD | NZD | CHF | |
|---|---|---|---|---|---|---|---|---|
| USD | 0.13% | 0.29% | 0.35% | -0.12% | 0.00% | 0.03% | 0.74% | |
| EUR | -0.13% | 0.15% | 0.22% | -0.25% | -0.12% | -0.11% | 0.61% | |
| GBP | -0.29% | -0.15% | 0.06% | -0.39% | -0.27% | -0.26% | 0.45% | |
| JPY | -0.35% | -0.22% | -0.06% | -0.49% | -0.33% | -0.35% | 0.39% | |
| CAD | 0.12% | 0.25% | 0.39% | 0.49% | 0.11% | 0.13% | 0.85% | |
| AUD | -0.01% | 0.12% | 0.27% | 0.33% | -0.11% | 0.01% | 0.74% | |
| NZD | -0.03% | 0.11% | 0.26% | 0.35% | -0.13% | -0.01% | 0.72% | |
| CHF | -0.74% | -0.61% | -0.45% | -0.39% | -0.85% | -0.74% | -0.72% |
The heat map shows percentage changes of major currencies against each other. The base currency is picked from the left column, while the quote currency is picked from the top row. For example, if you pick the British Pound from the left column and move along the horizontal line to the US Dollar, the percentage change displayed in the box will represent GBP (base)/USD (quote).
Natural gas markets fell initially during the early hours on Thursday, but then turned around to show signs of support. With that being said, the market is likely to continue to be very noisy, but the $3 level above is a significant barrier that I think is going to be very difficult to overcome. Keep in mind, we’re in the midst of a heat wave here in America, and that does have an influence on pricing, but we also have to also keep in mind that this time of year generally isn’t that positive for natural gas after all.
You have a situation where, unless it’s hot, the demand for natural gas, i.e. electricity, is going to be somewhat limited. Most people are outside. Also, another thing to keep in mind is, if the economy is slowing down, the demand for natural gas will drop. On the positive side though, we have a shortage in Europe yet again, and at this point in time, it seems as if that could come into the picture over the next several months.
You have reached your limit of 5 free articles for this month.
Access all our articles, insights, and analysts.
Your coupon code
After failing to extend gains beyond the 1.0750 region, the EUR/USD pair eased on Thursday, falling to an intraday low of 1.0712 posted during European trading hours. Nevertheless, financial markets seem to be in a good mood, limiting US Dollar strength. Asian and European indexes trade in the green, underpinning Wall Street ahead of the opening.
Meanwhile, European Central Bank (ECB) policymaker Klaas Knot hit the wires and said that the “just under three” cuts priced in by financial markets for 2024 were “broadly in line” with the optimal policy path as priced into ECB projections. He then added that there’s a strong case for the ECB to decide quarterly based on the outlook.
Data-wise, the Eurozone did not release relevant macroeconomic data, while the United States (US) published multiple figures ahead of the session opening. Initial Jobless Claims for the week ended June 14 were up by 238K, worse than the 235K expected. At the same time, Building Permits fell by 3.8% MoM in May, while Housing Starts declined by 5.5%. Finally, the Philadelphia Fed Manufacturing Survey printed at 1.3 in June, down from the previous 4.5 and worse than the 5 anticipated. Later in the session, the European Commission will release the preliminary estimate of the June Consumer Confidence index.
From a technical point of view, EUR/USD has room to extend its slide. The daily chart shows that the pair is trading near its intraday low and below all its moving averages, with the 20 Simple Moving Average (SMA) about to extend its slide below the flat 100 and 200 SMAs. At the same time, technical indicators gain downward momentum within negative levels, reflecting increased selling interest.
In the near term, EUR/USD is neutral-to-bearish. The 100 SMA has crossed below the 200 SMA, maintaining its bearish slope, while the pair is currently developing below a flat 20 SMA. Technical indicators, in the meantime, tick marginally higher, although within negative levels. The pair would need to run past 1.0760 to confirm a bullish continuation, an unlikely scenario at this point.
Support levels: 1.0710 1.0665 1.0620
Resistance levels: 1.0760 1.0810 1.0840
After failing to extend gains beyond the 1.0750 region, the EUR/USD pair eased on Thursday, falling to an intraday low of 1.0712 posted during European trading hours. Nevertheless, financial markets seem to be in a good mood, limiting US Dollar strength. Asian and European indexes trade in the green, underpinning Wall Street ahead of the opening.
Meanwhile, European Central Bank (ECB) policymaker Klaas Knot hit the wires and said that the “just under three” cuts priced in by financial markets for 2024 were “broadly in line” with the optimal policy path as priced into ECB projections. He then added that there’s a strong case for the ECB to decide quarterly based on the outlook.
Data-wise, the Eurozone did not release relevant macroeconomic data, while the United States (US) published multiple figures ahead of the session opening. Initial Jobless Claims for the week ended June 14 were up by 238K, worse than the 235K expected. At the same time, Building Permits fell by 3.8% MoM in May, while Housing Starts declined by 5.5%. Finally, the Philadelphia Fed Manufacturing Survey printed at 1.3 in June, down from the previous 4.5 and worse than the 5 anticipated. Later in the session, the European Commission will release the preliminary estimate of the June Consumer Confidence index.
From a technical point of view, EUR/USD has room to extend its slide. The daily chart shows that the pair is trading near its intraday low and below all its moving averages, with the 20 Simple Moving Average (SMA) about to extend its slide below the flat 100 and 200 SMAs. At the same time, technical indicators gain downward momentum within negative levels, reflecting increased selling interest.
In the near term, EUR/USD is neutral-to-bearish. The 100 SMA has crossed below the 200 SMA, maintaining its bearish slope, while the pair is currently developing below a flat 20 SMA. Technical indicators, in the meantime, tick marginally higher, although within negative levels. The pair would need to run past 1.0760 to confirm a bullish continuation, an unlikely scenario at this point.
Support levels: 1.0710 1.0665 1.0620
Resistance levels: 1.0760 1.0810 1.0840
Underneath we have the 200 yen level that I think offers quite a bit of support. And if we were to break down below there, it’s likely that we could go down to the 198 yen level where I think a lot of people will be very interesting. And the 50 day EMA is starting to race towards that area as well.

Keep in mind that the British pound pays much more in the way of interest than the Japanese yen does, but with this being the case, the Bank of England meeting on Thursday will have a major influence on where we go next. With that being the situation, I would expect volatility, but any type of knee-jerk reaction will more likely than not open up the possibility of finding cheap pounds.
The Bank of Japan is nowhere near tightening monetary policy. So, I think you’ve got a situation where market participants will continue to see this on the prism of it being very noisy. And with that being the case, you need to be somewhat cautious with your position sizing. Nonetheless, the trend in this pair is dead obvious and there’s no reason to fight it. I think given enough time; traders will continue to push this pair higher as the Bank of Japan just simply has far too much debt with the Japanese government to start tightening monetary policy. I think the Japanese yen will lose much more value before it’s all said and done.
Ready to trade our daily Forex analysis? Check out the best forex trading company in UK worth using.
The price of platinum opened at $1,017.92 per ounce, as of 9 a.m. That’s up 1.24% from the previous day and up 3.05% from the beginning of the year.
The lowest trading price within the last day: $999.40 per ounce. The highest platinum spot price in the last 24 hours: $1,023.94 per ounce.
The chart below shows how the spot price of platinum is trending over the year.
Year to date, platinum is up 3.05%, as of 9 a.m. The 52-week high reached $1,083.27 on May 22, 2023, and the 52-week low dropped to $843.15 on Nov. 10, 2023.
The precious, silvery-colored metal is priced in U.S. dollars. This means that the fluctuations in the value of the U.S. dollar can impact its price.
The price of XPT/USD reflects the value of one ounce of platinum in U.S. dollars, and it is traded like traditional currency pairs. Because platinum trades occur globally, investors can also track the spot price of platinum in other currencies, such as XPT/EUR for euros and XPT/GBP for British pounds.
Factors that can influence the price of platinum include changes in demand, geopolitical events and tensions in major platinum-producing countries. Of course, investor opinion and speculation can also affect prices.
Platinum is one of four main precious metals investors can trade via physical bullion, exchange-traded products or futures contracts. Gold, silver and palladium spot prices are also updated 24/7 in various currencies.
Currently, platinum trades at $1,017.92 per ounce, as of 9 a.m., compared to gold, which trades at $2,348.35 per ounce. Year to date, platinum prices are up by 3.05% and gold prices are up by 13.65%.
“Historically, platinum has often been more expensive than gold due to its relative scarcity and unique properties. However, the price of platinum can fluctuate in response to changing market conditions,” said John Bergquist, president of Elysium Financial.
Political instability and supply disruptions in major platinum-producing regions like South Africa and Russia affect prices.
The silvery metal also tends to be a less reliable store of value than gold.
While historically, platinum has been pricier than gold, that flip-flopped briefly in August 2011. When looking at the gold-to-platinum price ratio, platinum was priced above gold from January 2013 until December 2014. Since then, gold has more than doubled its value compared to platinum prices.
Like any metal, the price of platinum can be volatile. Various factors affect it, the most significant being supply and demand dynamics. Other factors, such as economic conditions, geopolitical events, and changes in industrial and investment demand, can also impact the price of platinum.
At the start of the new millennium, the precious metal’s spot price was around $420. Fast-forward over 20 years, and the current price of platinum has more than doubled.
The spot price soared to new heights, trading in February 2008 at around $2,200 per troy ounce. In November of that year, the price returned to less than $1,000.
Platinum’s spot price has fluctuated between around $800 to $1,400 for the past decade, hovering around the $1,000 threshold on average.
Platinum prices today remain historically low. Prices dropped as low as $623.50 in March 2020 during the COVID-19 pandemic. While prices have recovered, platinum is nowhere near its all-time high of $2,213.20, set on March 3, 2008.
Futures contracts let investors speculate on the future price movements of an underlying asset like platinum.
These financial contracts represent an agreement between two parties to trade a set amount of platinum at a specified price at a future date. They can be settled by exchanging the physical commodity or cash in place of the commodity.
Futures contracts differ from spot prices in that futures contracts establish a future price whereas spot prices are for immediate delivery. These contracts can be fulfilled by trading the physical commodity or exchanging cash in place of the underlying asset. They are usually traded through an exchange.
The automotive industry creates the highest demand for platinum. Platinum is a key component in manufacturing catalytic converters, which are responsible for reducing vehicle emissions.
In addition to the automotive industry, platinum is widely used in the industrial industry to create medical products, nitric acid and glass. As the demand for these products rises, so does the price of platinum.
It is anticipated that platinum will play an essential role in the development of hydrogen technology. Platinum is used to produce carbon-free hydrogen from renewable energy.
“If hydrogen-based power meets expectations in the coming decade, then one could expect a material demand tailwind in platinum,” said Stash Graham, managing director of Graham Capital Wealth Management.
Precious metals such as platinum, gold and silver have long been used to diversify an investment portfolio.
When choosing investments, it is crucial to consider potential drawbacks. While there may be an increase in the demand for platinum, other factors may throw a wrench in the investment benefits.
When considering an investment, it is essential to consider your current holdings and individual financial goals.
Platinum is rarer than both silver and gold, which could make it attractive to investors seeking a scarce metal. This practice helps protect other holdings, such as stocks, in an economic downturn. Investing in platinum can help balance inflation and economic uncertainties.
The 50 day EMA underneath is near the 168 yen level, and I think that is a bit of a short term floor in the market. I like the idea of buying dips mainly due to the fact that I don’t like the yen at all. It’s not even that I like the euro, it’s just that I think the yen is in that much trouble.
Short-term pullbacks continue to find value hunters jumping into the market, and then of course, you have to keep in mind that you get paid to hang on to this pair, just like you do almost anything else denominated in yen. With this being the case, there’s no real need to fight this, and if the euro does in fact bounce against the dollar a little bit, and it looks like it might, that should help this pair as well.
If we can break above the 171 yen level, then I think we could make a serious run towards the 175 yen level over the longer term. I don’t know that we have the massive and pulse of up days that we used to, but I do think that we have more of a grind to the upside that will continue to attract inflows. As far as selling is concerned, I wouldn’t even consider it until we broke below the 165 yen level. And really at this point, I just don’t see that happening very easily, and therefore I am currently “long only” in this pair.
Ready to trade our daily forex forecast? Here are the best forex brokers in Japan to choose from.
A Reuters report, which quoted residents and Palestinian medics, said Israeli tanks backed by warplanes and drones advanced deeper into the western part of the Gaza Strip city of Rafah on Wednesday, killing eight people. It said that tanks moved into five neighbourhoods after midnight.
Market fears that the escalation of tensions in West Asia could impact the supply of crude oil from the region.
Market is waiting for the release of the weekly petroleum status report by the US EIA (Energy Information Administration) later in the day. This data from the EIA was delayed by a day due to a holiday in the US. This official data will present the details of the crude oil inventory levels in the US for the week ending June 14. US is a major consumer of crude oil in the global market.
The American Petroleum Institute’s (API) weekly report had shown an increase of 2.26 million barrels of crude oil inventories for the week ending June 14.
July natural gas futures were trading at ₹250.80 on MCX during the initial hour of trading on Thursday morning, against the previous close of ₹248.80, up by 0.80 per cent.
On the National Commodities and Derivatives Exchange (NCDEX), July cottonseed oilcake contracts were trading at ₹2,775 in the initial hour of trading on Thursday morning, against the previous close of ₹2,743, up by 1.17 per cent.
August turmeric (farmer polished) futures were trading at ₹18,378 on NCDEX in the initial hour of trading on Thursday morning against the previous close of ₹18,300, up by 0.43 per cent.