

Category: Forex News, News
GBP/USD Forecast: Bulls seize control on US-Iran ceasefire news
The GBP/USD pair prolongs its uptrend for the third consecutive day and rallies to over a two-week top on Wednesday, with bulls now looking to build on the momentum further beyond the 200-day Simple Moving Average (SMA). The US Dollar (USD) slumps to a nearly one-month low during the first half of the European session amid hopes for an end to the Middle East war and turns out to be a key factor acting as a tailwind for the currency pair.
US President Donald Trump announced in a post on Truth Social that he will suspend planned military strikes against Iran for two weeks. Iran also signaled a conditional willingness to de-escalate tensions, provided attacks against the country are halted. The positive development boosted investors’ sentiment, sending the safe-haven Greenback tumbling lower and assisting the GBP/USD pair in building on this week’s rise from the 1.3175 region.

Meanwhile, Iran’s Foreign Minister Seyed Abbas Araghchi wrote on X that safe passage through the Strait of Hormuz will be possible via coordination with the country’s Armed Forces and due consideration of technical limitations. Crude Oil prices crashed over 15% intraday amid optimism over the resumption of shipping traffic from the strategic waterway, easing inflation fears, and tempering expectations for more hawkish global central banks.
In fact, market bets for a rate hike by the US Federal Reserve (Fed) collapsed amid the unwinding of the inflation premium. The resultant steep decline in US Treasury bond yields further undermines the USD. Moreover, traders have sharply reduced Bank of England (BoE) rate hike bets and are now pricing in roughly 30-40 basis points (bps) of increases by the year-end. This still marks a significant divergence in comparison to the Fed and favors the GBP/USD bulls.
Market participants now look to the release of FOMC Minutes, due later during the US session. Apart from this, the US Personal Consumption Expenditures (PCE) Price Index and the US Consumer Price Index (CPI) on Thursday and Friday, respectively, will be looked upon for more cues about the Fed’s policy outlook. This, in turn, will play a key role in influencing the near-term USD price dynamics and providing some meaningful impetus to the GBP/USD pair.
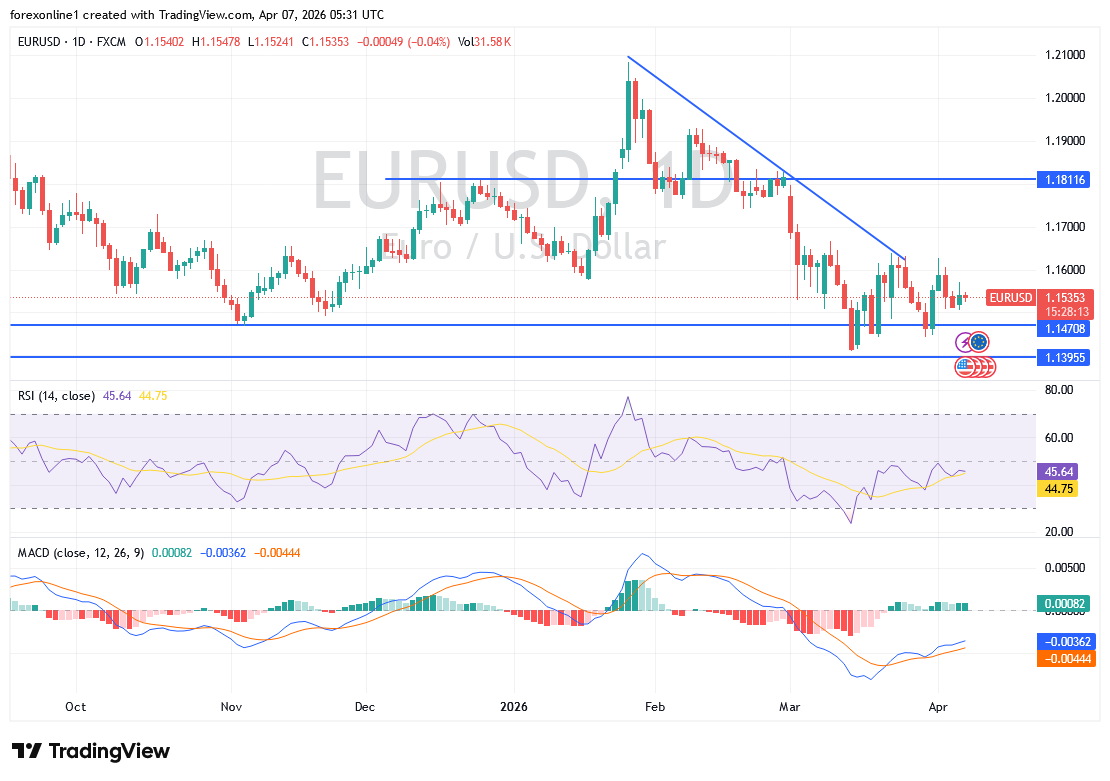
GBP/USD daily chart
Technical Analysis:
The near-term bias turns mildly bullish as the GBP/USD pair holds just above the 38.2% Fibonacci retracement level of the January-March downfall. Spot prices now test the downward-sloping 200-day Simple Moving Average (SMA) at 1.3415 from above, suggesting emerging dip-buying interest around this long-term reference. Momentum improves, with the Moving Average Convergence Divergence (MACD) line crossing above its signal and edging back toward the zero line, while the Relative Strength Index (RSI) at 55 signals modest bullish momentum rather than overbought conditions.
A further move could face immediate resistance at the 50% retracement at 1.3505. A daily close above the said barrier would strengthen the bullish tone and open the way toward the 61.8% Fibo. retracement level at 1.3588. On the downside, initial support sits at the 38.2% Fibo. retracement level at 1.3422, aligned with the 200-day SMA near 1.3415, and a break below there would expose the 23.6% Fibo. retracement level at 1.3319 as the next downside level. As long as the GBP/USD pair holds above the 1.3415–1.3422 support band, the path of least resistance favors further recovery attempts toward the mid-1.3500s area.
(The technical analysis of this story was written with the help of an AI tool.)

In the daily chart, GBP/USD trades at 1.3427.


Written by : Editorial team of BIPNs
Main team of content of bipns.com. Any type of content should be approved by us.


Share this article: