Category: Forex News, News
GBP/USD Price Analysis: Pound Holds Ground After Pullback
- The GBP/USD price analysis shows the pound steady after a recent collapse.
- The US has promised to guarantee Ukraine’s safety in case of a peace deal.
- Traders are pricing in over an 80% chance of a Fed rate cut in September.
The GBP/USD price analysis shows the pound steady after a recent collapse due to dollar strength. The dollar paused its rally as safe-haven demand dropped after the meeting between Trump and Zelensky ended well. Meanwhile, focus is shifting towards the Jackson Hole symposium for clues on Fed rate cuts.
Trump and Zelenskiy’s meeting went well, with the two leaders seeming to be on the same page. The US has promised to guarantee Ukraine’s safety in case of a peace deal with Russia. Last week, the meeting between Trump and Putin also ended well. The US president noted that Putin was more willing to work towards a peace deal instead of a ceasefire deal. Nevertheless, markets remain uncertain about the future.
Elsewhere, the Fed will meet during the Jackson Hole Symposium, and traders will watch Powell’s tone. After recent US data, traders are pricing an over 80% chance of a cut in September. Moreover, they expect policymakers to sound more dovish. However, experts have warned that Powell might not give a clear signal on rate cuts.
GBP/USD key events today
Market participants are not anticipating any high-impact economic releases from the UK or the US.
GBP/USD technical price analysis: Price action signals a new trend

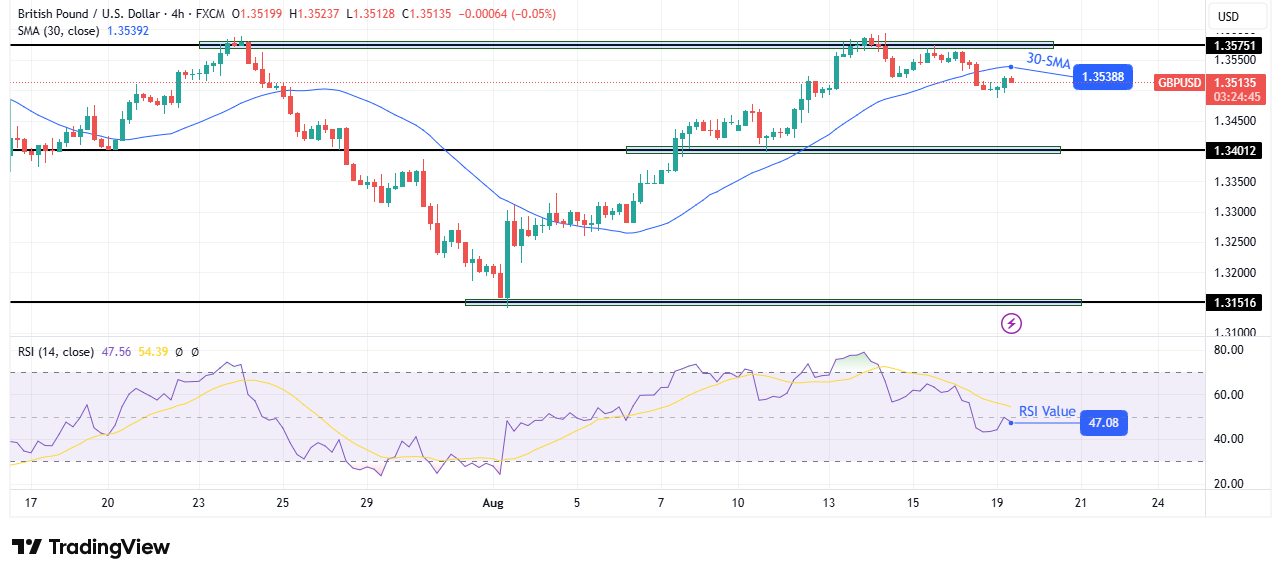
On the technical side, the GBP/USD price has broken below the 30-SMA after failing to break above the 1.3575 resistance level. The break indicates a bearish shift in sentiment. At the same time, the RSI has broken below 50, suggesting a surge in bearish momentum.
–Are you interested to learn more about forex tools? Check our detailed guide-
Initially, the price was climbing in a developed bullish trend, with the price keeping above the 30-SMA. However, the price failed to make a higher high when bulls met the 1.3575 resistance level. Instead, it made a lower high and broke below the SMA to make a lower low. This pattern shows the beginning of a downtrend.
However, bears must keep the price below the SMA and respect it as a resistance. If this happens, the price will likely drop to retest the 1.3401 support level. On the other hand, if bulls regain momentum, the price will likely retest the 1.3575 resistance.
Looking to trade forex now? Invest at eToro!
67% of retail investor accounts lose money when trading CFDs with this provider. You should consider whether you can afford to take the high risk of losing your money.
Written by : Editorial team of BIPNs
Main team of content of bipns.com. Any type of content should be approved by us.
Share this article:


