The main category of The Gold News.
You can use the search box below to find what you need.
[wd_asp id=1]
The main category of The Gold News.
You can use the search box below to find what you need.
[wd_asp id=1]
(Kitco News) – Gold and silver prices are higher and near their daily highs near midday Wednesday. Bullish near-term technical postures and positive outside-market forces (weaker USDX and firmer crude oil) are supporting buying interest in both precious metals today. April gold was last up $9.50 at $2,175.90. May silver was last up $0.361 at $24.76.
The marketplace has digested Tuesday’s U.S. consumer price index for February that came in a bit warmer than expected, at up 3.2%, year-on-year, versus market expectations for a rise of 3.1%, and compares to a rise of 3.1% seen in the January report. The core CPI number for February was up 3.8% compared to expectations of up 3.7% and up 3.9% seen in the January report. The slightly warmer CPI readings followed the slightly warmer-than-expected CPI report for January. Thursday’s February producer price index report is now in focus. PPI in February is seen coming in up 0.3%, month-on-month, following a 0.3% rise in the January report. More warm U.S. inflation readings in the coming weeks may prevent the Federal Reserve from cutting interest rates as soon as it had just recently anticipated.
Asian and European stock markets were mixed in overnight trading. U.S. stock index futures are mixed near midday but not far below their recent record highs.
The key outside markets today see the U.S. dollar index weaker. Nymex crude oil prices are higher and trading around $79.25 a barrel. The yield on the benchmark 10-year U.S. Treasury note is presently fetching around 4.2%.
Technically, April gold futures bulls have the strong overall near-term technical advantage. A steep four-week-old uptrend is in place on the daily bar chart. Bulls’ next upside price objective is to produce a close above solid resistance at the contract high of $2,203.00. Bears’ next near-term downside price objective is pushing futures prices below solid technical support at $2,100.00. First resistance is seen at Tuesday’s high of $2,190.80 and then at the contract high of $2,203.00. First support is seen at today’s low of $2,161.30 and then at this week’s low of $2,156.20. Wyckoff’s Market Rating: 8.5.
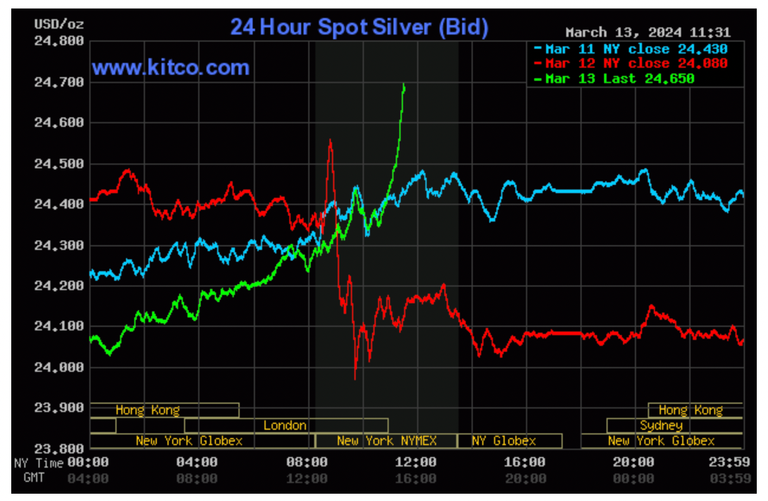
May silver futures prices were poised to close at a nine-week-high close today. The silver bulls have the overall near-term technical advantage. Silver bulls’ next upside price objective is closing prices above solid technical resistance at $26.00. The next downside price objective for the bears is closing prices below solid support at $23.00. First resistance is seen at this week’s high of $24.90 and then at $25.00. Next support is
seen at this week’s low of $24.22 and then at $24.00. Wyckoff’s Market Rating: 6.5.
May N.Y. copper closed up 1,085 points at 404.05 cents today. Prices closed near the session high and hit an 8.5-month high. The copper bulls have the solid overall near-term technical advantage and gained more power today. Prices are in a steep four-week-old uptrend on the daily bar chart. Copper bulls’ next upside price objective is pushing and closing prices above solid technical resistance at 415.00 cents. The next downside price objective for the bears is closing prices below solid technical support at this week’s low of 387.85 cents. First resistance is seen at today’s high of 404.30 cents and then at 407.50 cents. First support is seen at 400.00 cents and then at 395.00 cents. Wyckoff’s Market Rating: 8.0.
Hey!! Try out my “Markets Front Burner” weekly email report. Front Burner is my best writing and analysis, I think, because I get to look ahead at the marketplace and do some market price forecasting. Plus, I’ll throw in an educational feature to move you up the ladder of trading/investing success. And it’s free! Email me at jim@jimwyckoff.com and I’ll add your email address to the Front Burner list.
Disclaimer: The views expressed in this article are those of the author and may not reflect those of Kitco Metals Inc. The author has made every effort to ensure accuracy of information provided; however, neither Kitco Metals Inc. nor the author can guarantee such accuracy. This article is strictly for informational purposes only. It is not a solicitation to make any exchange in commodities, securities or other financial instruments. Kitco Metals Inc. and the author of this article do not accept culpability for losses and/ or damages arising from the use of this publication.
Customs officials at the Cochin International Airport have seized Indian currency worth ₹15 lakh, foreign currency worth around ₹1.25 lakh, and over two kilograms of gold in three separate instances since Tuesday.
A passenger from Tamil Nadu bound for Kuala Lumpur was offloaded from the flight based on a tip-off received by the Central Industrial Security Force that he was carrying more than the permissible limit of currency on Tuesday. On examination of his baggage, Indian currency worth ₹15 lakh and foreign currency worth ₹1.25 lakh were seized.
In another incident, 1,051 grams of gold in compound form was seized from a Kasaragod native on his arrival from Dubai. On the basis of profiling done by officers of the Customs Air Intelligence Unit, he was intercepted at the exit gate. During examination, gold paste was found hidden between two layers of his vest and underwear.
Another smuggling bid was thwarted when Customs officials intercepted a native of Malappuram at the exit gate on his arrival from Abu Dhabi. Three capsule-shaped packets containing gold in compound form weighing 954 grams were found concealed inside his body.
A former area manager of Kerala Bank was arrested by the Pattanakkad police on Tuesday for stealing pledged gold. The arrested has been identified as Meera Mathew (44) of Cherthala.
The accused, who was in charge of gold loan in the bank, allegedly stole 335.08 grams of gold from four branches – Cherthala, Nadakkavu, Pattanakkad and Arthunkal. Besides Pattanakkad, cases have also been registered against her at the Cherthala and Arthunkal police stations. The police booked her based on complaints filed by the branch managers.
In 2023, the bank suspended her from the service.
Following the arrest, a local court in Cherthala remanded her in judicial custody for 14 days. The Pattanakkad police on Wednesday said that an application had been submitted before the court seeking the custody of the accused for interrogation.
Gold prices edged higher on Wednesday after dropping more than 1% in the previous session, as investors digested hotter-than-expected US inflation data and still banked on a Federal Reserve interest rate cut in June.
Spot gold edged up 0.3% to $2,163.12 per ounce, as of 1047 GMT. Bullion posted its worst single-day drop since Feb. 13 on Tuesday. U.S. gold futures rose 0.1% to $2,168.50.
“The market driver behind the decline of gold is quite clear as the U.S. CPI numbers came in higher than expected,” said Carlo Alberto De Casa, market analyst at Kinesis Money.
“It’s just a physiological correction after a long strike of positive days and markets are realizing that the Fed will not cut rates too quickly.”
Bullion slumped 1.1% on Tuesday as data indicated that U.S. consumer prices rose sharply in February, above expectations and indicating some inflation stickiness.
Higher-than-expected inflation means that the US Fed will be under more pressure to keep interest rates higher for longer, weighing on non-yielding assets such as gold.
However, Fed policymakers are still seen starting interest-rate cuts in June, even as a government report showed consumer prices rose last month more than expected.
Traders now see about a 65% chance of a interest rate cut from the Fed in June, slight lower from the 72% seen before the data, according to the CME Group’s FedWatch Tool.
“While physical gold demand has been holding up well since 2021, a sharp price rally is likely to temper discretionary gold buying in 2024,” analysts at ANZ Research wrote in a note.
Focus now shifts to U.S. retail sales, producer price index, and weekly initial jobless claims print due on Thursday, which will provide a further update on the status of the US economy.
Spot platinum rose 1.2% to $934.85 per ounce, palladium gained 2.7% to $1,069.50 and silver was up 0.5% at $24.27.
New Found Gold Corp. (“New Found” or the “Company”) (TSX-V: NFG, NYSE-A: NFGC) is pleased to announce the results from 61 diamond drill holes that were completed as part of a program designed to infill gaps, extend high-grade to surface, and test opposing vein orientations to the main east-northeast striking orientation of the Keats-Baseline Fault Zone at Iceberg-Iceberg East, a high-grade zone located 300m northeast of Keats along the highly prospective Appleton Fault Zone (“AFZ”). New Found’s 100%-owned Queensway project comprises a 1,662 km2 area, accessible via the Trans-Canada Highway, 15km west of Gander, Newfoundland and Labrador.
This press release features multimedia. View the full release here: https://www.businesswire.com/news/home/20240313762569/en/
Figure 1: Photos of mineralization from Left: at ~112.30m in NFGC-23-1323, Right: at 79.25m in NFGC-23-1766 ^Note that these photos are not intended to be representative of gold mineralization in NFGC-23-1323 and NFGC-23-1766. (Photo: Business Wire)
Iceberg and Iceberg East Highlights:
|
Hole No. |
From (m) |
To (m) |
Interval (m) |
Au (g/t) |
Zone |
|
NFGC-23-13231 |
109.00 |
125.70 |
16.70 |
12.56 |
Iceberg |
|
Including |
112.25 |
113.50 |
1.25 |
132.84 |
|
|
Including |
120.65 |
121.60 |
0.95 |
24.30 |
|
|
NFGC-23-16132 |
25.20 |
27.45 |
2.25 |
24.89 |
Iceberg East |
|
Including |
27.15 |
27.45 |
0.30 |
168.52 |
|
|
NFGC-23-17462 |
50.80 |
58.15 |
7.35 |
42.80 |
Iceberg |
|
Including |
51.60 |
53.40 |
1.80 |
172.02 |
|
|
NFGC-23-17662 |
55.35 |
65.00 |
9.65 |
4.89 |
Iceberg |
|
Including |
59.00 |
60.90 |
1.90 |
18.47 |
|
|
NFGC-23-18051 |
62.15 |
64.70 |
2.55 |
21.06 |
Iceberg |
|
And1 |
70.70 |
82.15 |
11.45 |
3.96 |
|
|
Including |
73.45 |
74.45 |
1.00 |
12.75 |
|
|
NFGC-23-18201 |
45.30 |
62.00 |
16.70 |
36.18 |
Iceberg |
|
Including1 |
46.10 |
52.00 |
5.90 |
43.85 |
|
|
Including1 |
53.00 |
56.40 |
3.40 |
78.82 |
|
|
Including2 |
59.00 |
61.00 |
2.00 |
24.55 |
|
|
And2 |
68.30 |
81.45 |
13.15 |
15.50 |
|
|
Including |
71.40 |
72.15 |
0.75 |
21.00 |
|
|
Including |
74.00 |
75.80 |
1.80 |
88.76 |
|
|
NFGC-23-18271 |
87.50 |
102.20 |
14.70 |
33.68 |
Iceberg |
|
Including1 |
90.20 |
92.20 |
2.00 |
229.26 |
|
|
Including2 |
99.50 |
101.00 |
1.50 |
12.59 |
|
|
NFGC-23-18381 |
14.10 |
19.95 |
5.85 |
40.51 |
Iceberg |
|
Including |
14.10 |
14.80 |
0.70 |
278.00 |
|
|
Including |
18.40 |
19.95 |
1.55 |
22.56 |
|
|
NFGC-23-18431 |
27.50 |
29.65 |
2.15 |
22.10 |
Iceberg |
|
Including |
27.50 |
27.85 |
0.35 |
27.69 |
|
|
Including |
28.40 |
29.25 |
0.85 |
36.84 |
|
|
NFGC-23-18731 |
35.00 |
37.45 |
2.45 |
27.77 |
Iceberg |
|
Including |
36.45 |
37.05 |
0.60 |
110.50 |
|
|
And4 |
104.60 |
109.10 |
4.50 |
13.19 |
|
|
Including |
104.60 |
105.25 |
0.65 |
13.80 |
|
|
Including |
107.50 |
109.10 |
1.60 |
29.34 |
|
|
NFGC-23-19141 |
29.00 |
41.80 |
12.80 |
13.86 |
Iceberg |
|
Including1 |
31.60 |
32.20 |
0.60 |
27.90 |
|
|
Including1 |
33.85 |
35.40 |
1.55 |
69.10 |
|
|
Including2 |
40.50 |
41.00 |
0.50 |
61.40 |
|
|
And2 |
51.25 |
53.65 |
2.40 |
14.69 |
|
|
Including |
52.20 |
53.00 |
0.80 |
42.30 |
|
|
NFGC-23-19521 |
14.70 |
16.90 |
2.20 |
21.39 |
Iceberg East |
|
Including |
15.70 |
16.30 |
0.60 |
77.20 |
|
|
And1 |
23.00 |
25.15 |
2.15 |
11.04 |
|
|
Including |
23.00 |
23.55 |
0.55 |
25.80 |
|
|
NFGC-23-19661 |
179.00 |
181.00 |
2.00 |
16.12 |
Iceberg |
|
Including |
180.00 |
181.00 |
1.00 |
31.68 |
|
|
NFGC-23-19771 |
121.40 |
129.35 |
7.95 |
10.39 |
Iceberg |
|
Including |
121.40 |
122.65 |
1.25 |
33.98 |
|
|
Including |
125.00 |
125.45 |
0.45 |
77.68 |
|
|
And2 |
146.35 |
160.60 |
14.25 |
2.59 |
|
|
Including |
155.10 |
155.95 |
0.85 |
12.34 |
|
|
Including |
157.15 |
157.70 |
0.55 |
20.81 |
Table 1: Iceberg and Iceberg East Drilling Highlights
Note that the host structures are interpreted to be moderately to steeply dipping and true widths are generally estimated to be 170% to 95%, 240% to 70%, and 310% to 40% of reported intervals. 4True widths are unknown at this time. Infill veining in secondary structures with multiple orientations crosscutting the primary host structures are commonly observed in drill core which could result in additional uncertainty in true width. Composite intervals reported carry a minimum weighted average of 1 g/t Au diluted over a minimum core length of 2m with a maximum of 4m consecutive dilution when above 200m vertical depth and 2m consecutive dilution when below 200m vertical depth. Included high-grade intercepts are reported as any consecutive interval with grades greater than 10 g/t Au. Grades have not been capped in the averaging and intervals are reported as drill thickness.
Melissa Render, VP of Exploration of New Found, stated: “Infill and definition drilling at Iceberg and Iceberg East have provided us with a comprehensive picture of the near-surface expression of this portion of the KBFZ, including the geometries of the veins at play and the controls on high-grade gold mineralization. The KBFZ has demonstrated several times over that it is a very important structure, with the majority of meters used to date to test only the top 250m vertical. The Company has now expanded the program at Iceberg-Iceberg east utilizing the seismic data to assist in targeting additional domains of gold mineralization within the KBFZ at depth.”
Drillhole Details
|
Hole No. |
From (m) |
To (m) |
Interval (m) |
Au (g/t) |
Zone |
|
NFGC-21-194 |
No Significant Values |
Iceberg |
|||
|
NFGC-22-10654 |
20.10 |
22.40 |
2.30 |
7.39 |
Iceberg |
|
Including |
21.85 |
22.40 |
0.55 |
30.45 |
|
|
NFGC-22-10691 |
4.65 |
7.20 |
2.55 |
3.03 |
Iceberg |
|
Including |
5.80 |
6.20 |
0.40 |
13.89 |
|
|
And1 |
16.70 |
19.00 |
2.30 |
1.90 |
|
|
NFGC-23-11521 |
158.35 |
161.00 |
2.65 |
1.09 |
Iceberg |
|
NFGC-23-11774 |
25.85 |
28.05 |
2.20 |
1.38 |
Keats N |
|
And4 |
66.55 |
68.95 |
2.40 |
1.02 |
Iceberg |
|
And1 |
113.45 |
118.95 |
5.50 |
1.76 |
|
|
And4 |
129.70 |
132.20 |
2.50 |
1.18 |
|
|
NFGC-23-13231 |
109.00 |
125.70 |
16.70 |
12.56 |
Iceberg |
|
Including |
112.25 |
113.50 |
1.25 |
132.84 |
|
|
Including |
120.65 |
121.60 |
0.95 |
24.30 |
|
|
NFGC-23-13281 |
15.45 |
17.80 |
2.35 |
6.18 |
Iceberg East |
|
Including |
15.45 |
16.00 |
0.55 |
11.34 |
|
|
Including |
17.30 |
17.80 |
0.50 |
16.56 |
|
|
And1 |
37.40 |
40.75 |
3.35 |
2.16 |
|
|
NFGC-23-13401 |
132.15 |
135.75 |
3.60 |
8.39 |
Iceberg |
|
Including |
132.15 |
133.10 |
0.95 |
22.63 |
|
|
And3 |
143.80 |
156.35 |
12.55 |
1.05 |
|
|
And3 |
184.00 |
186.50 |
2.50 |
1.07 |
|
|
NFGC-23-13581 |
212.80 |
216.40 |
3.60 |
2.01 |
Iceberg |
|
NFGC-23-14041 |
109.65 |
121.15 |
11.50 |
1.94 |
Iceberg |
|
Including |
119.75 |
120.15 |
0.40 |
29.23 |
|
|
NFGC-23-14274 |
132.90 |
134.95 |
2.05 |
1.11 |
Iceberg |
|
And4 |
158.80 |
161.25 |
2.45 |
1.27 |
|
|
And4 |
165.25 |
168.35 |
3.10 |
1.75 |
|
|
And1 |
213.95 |
216.30 |
2.35 |
1.58 |
|
|
And1 |
220.00 |
222.50 |
2.50 |
1.04 |
|
|
NFGC-23-1436 |
No Significant Values |
Iceberg East |
|||
|
NFGC-23-14431 |
162.85 |
165.30 |
2.45 |
1.06 |
Iceberg |
|
NFGC-23-14452 |
61.45 |
66.40 |
4.95 |
2.53 |
Iceberg |
|
NFGC-23-14891 |
157.00 |
159.90 |
2.90 |
1.10 |
Iceberg East |
|
NFGC-23-15143 |
115.70 |
118.00 |
2.30 |
1.43 |
Iceberg East |
|
NFGC-23-15251 |
97.00 |
99.20 |
2.20 |
1.70 |
Iceberg East |
|
NFGC-23-15331 |
90.80 |
102.45 |
11.65 |
1.21 |
Iceberg East |
|
And1 |
106.35 |
108.35 |
2.00 |
1.03 |
|
|
NFGC-23-16052 |
76.90 |
79.35 |
2.45 |
1.00 |
Iceberg East |
|
And1 |
85.60 |
87.60 |
2.00 |
2.90 |
|
|
NFGC-23-16072 |
12.00 |
14.00 |
2.00 |
1.25 |
Iceberg East |
|
And2 |
17.00 |
19.00 |
2.00 |
1.17 |
|
|
NFGC-23-16132 |
25.20 |
27.45 |
2.25 |
24.89 |
Iceberg East |
|
Including |
27.15 |
27.45 |
0.30 |
168.52 |
|
|
NFGC-23-1622 |
No Significant Values |
Iceberg East |
|||
|
NFGC-23-1622A1 |
102.80 |
111.45 |
8.65 |
1.67 |
Iceberg East |
|
Including |
102.80 |
103.55 |
0.75 |
10.40 |
|
|
NFGC-23-17462 |
50.80 |
58.15 |
7.35 |
42.80 |
Iceberg |
|
Including |
51.60 |
53.40 |
1.80 |
172.02 |
|
|
And2 |
63.10 |
65.30 |
2.20 |
1.13 |
|
|
NFGC-23-17574 |
71.00 |
74.50 |
3.50 |
1.87 |
Iceberg |
|
And1 |
91.00 |
107.35 |
16.35 |
1.13 |
|
|
NFGC-23-17662 |
55.35 |
65.00 |
9.65 |
4.89 |
Iceberg |
|
Including |
59.00 |
60.90 |
1.90 |
18.47 |
|
|
And2 |
73.00 |
75.10 |
2.10 |
1.43 |
|
|
And2 |
79.45 |
86.30 |
6.85 |
1.51 |
|
|
NFGC-23-1769 |
No Significant Values |
Iceberg |
|||
|
NFGC-23-1776 |
No Significant Values |
Iceberg |
|||
|
NFGC-23-17801 |
140.50 |
144.55 |
4.05 |
1.49 |
Iceberg |
|
NFGC-23-17891 |
146.80 |
149.10 |
2.30 |
2.20 |
Iceberg |
|
And1 |
183.60 |
186.25 |
2.65 |
1.94 |
|
|
NFGC-23-18001 |
97.55 |
100.15 |
2.60 |
1.06 |
Iceberg |
|
And1 |
120.00 |
127.75 |
7.75 |
2.66 |
|
|
Including |
127.00 |
127.75 |
0.75 |
15.05 |
|
|
And1 |
152.70 |
155.80 |
3.10 |
1.05 |
|
|
NFGC-23-18051 |
57.30 |
59.85 |
2.55 |
1.87 |
Iceberg |
|
And1 |
62.15 |
64.70 |
2.55 |
21.06 |
|
|
And1 |
70.70 |
82.15 |
11.45 |
3.96 |
|
|
Including |
73.45 |
74.45 |
1.00 |
12.75 |
|
|
And1 |
91.00 |
93.00 |
2.00 |
1.02 |
|
|
And2 |
100.75 |
104.40 |
3.65 |
8.70 |
|
|
Including |
101.40 |
102.40 |
1.00 |
17.01 |
|
|
And1 |
114.30 |
117.00 |
2.70 |
1.26 |
|
|
And1 |
121.20 |
126.40 |
5.20 |
1.04 |
|
|
NFGC-23-18131 |
140.00 |
142.10 |
2.10 |
1.07 |
Iceberg |
|
NFGC-23-18201 |
45.30 |
62.00 |
16.70 |
36.18 |
Iceberg |
|
Including1 |
46.10 |
52.00 |
5.90 |
43.85 |
|
|
Including1 |
53.00 |
56.40 |
3.40 |
78.82 |
|
|
Including2 |
59.00 |
61.00 |
2.00 |
24.55 |
|
|
And2 |
68.30 |
81.45 |
13.15 |
15.50 |
|
|
Including |
71.40 |
72.15 |
0.75 |
21.00 |
|
|
Including |
74.00 |
75.80 |
1.80 |
88.76 |
|
|
And1 |
101.30 |
103.70 |
2.40 |
1.01 |
|
|
NFGC-23-18272 |
74.00 |
76.25 |
2.25 |
1.35 |
Iceberg |
|
And1 |
87.50 |
102.20 |
14.70 |
33.68 |
|
|
Including1 |
90.20 |
92.20 |
2.00 |
229.26 |
|
|
Including2 |
99.50 |
101.00 |
1.50 |
12.59 |
|
|
And1 |
106.05 |
108.95 |
2.90 |
1.01 |
|
|
NFGC-23-18321 |
9.30 |
13.65 |
4.35 |
4.00 |
Iceberg |
|
Including |
12.75 |
13.65 |
0.90 |
15.50 |
|
|
NFGC-23-18381 |
14.10 |
19.95 |
5.85 |
40.51 |
Iceberg |
|
Including |
14.10 |
14.80 |
0.70 |
278.00 |
|
|
Including |
18.40 |
19.95 |
1.55 |
22.56 |
|
|
NFGC-23-18431 |
27.50 |
29.65 |
2.15 |
22.10 |
Iceberg |
|
Including |
27.50 |
27.85 |
0.35 |
27.69 |
|
|
Including |
28.40 |
29.25 |
0.85 |
36.84 |
|
|
NFGC-23-18661 |
12.25 |
20.00 |
7.75 |
4.70 |
Iceberg |
|
Including |
14.60 |
15.20 |
0.60 |
52.90 |
|
|
And4 |
90.55 |
93.85 |
3.30 |
1.44 |
|
|
And2 |
171.05 |
173.20 |
2.15 |
1.43 |
Keats N |
|
NFGC-23-18731 |
35.00 |
37.45 |
2.45 |
27.77 |
Iceberg |
|
Including |
36.45 |
37.05 |
0.60 |
110.50 |
|
|
And4 |
104.60 |
109.10 |
4.50 |
13.19 |
|
|
Including |
104.60 |
105.25 |
0.65 |
13.80 |
|
|
Including |
107.50 |
109.10 |
1.60 |
29.34 |
|
|
NFGC-23-18791 |
80.95 |
90.50 |
9.55 |
3.10 |
Iceberg |
|
Including |
80.95 |
81.95 |
1.00 |
11.95 |
|
|
And1 |
99.10 |
105.85 |
6.75 |
5.56 |
Keats N |
|
Including |
100.10 |
101.10 |
1.00 |
25.60 |
|
|
NFGC-23-18871 |
100.00 |
102.00 |
2.00 |
1.31 |
Iceberg |
|
NFGC-23-1895 |
No Significant Values |
Iceberg |
|||
|
NFGC-23-1902 |
No Significant Values |
Iceberg |
|||
|
NFGC-23-19121 |
24.95 |
31.90 |
6.95 |
7.18 |
Iceberg |
|
Including |
26.00 |
28.30 |
2.30 |
18.51 |
|
|
And4 |
40.50 |
46.80 |
6.30 |
2.44 |
|
|
NFGC-23-19141 |
29.00 |
41.80 |
12.80 |
13.86 |
Iceberg |
|
Including1 |
31.60 |
32.20 |
0.60 |
27.90 |
|
|
Including1 |
33.85 |
35.40 |
1.55 |
69.10 |
|
|
Including2 |
40.50 |
41.00 |
0.50 |
61.40 |
|
|
And2 |
51.25 |
53.65 |
2.40 |
14.69 |
|
|
Including |
52.20 |
53.00 |
0.80 |
42.30 |
|
|
NFGC-23-1915 |
No Significant Values |
Iceberg |
|||
|
NFGC-23-19201 |
28.00 |
30.00 |
2.00 |
1.35 |
Iceberg East |
|
And1 |
38.30 |
40.85 |
2.55 |
1.05 |
|
|
NFGC-23-1922 |
No Significant Values |
Iceberg |
|||
|
NFGC-23-1924 |
No Significant Values |
Iceberg |
|||
|
NFGC-23-1925 |
No Significant Values |
Iceberg East |
|||
|
NFGC-23-1928 |
No Significant Values |
Iceberg East |
|||
|
NFGC-23-19322 |
64.95 |
67.15 |
2.20 |
3.59 |
Iceberg East |
|
NFGC-23-1938 |
No Significant Values |
Iceberg |
|||
|
NFGC-23-1950 |
No Significant Values |
Iceberg East |
|||
|
NFGC-23-19521 |
14.70 |
16.90 |
2.20 |
21.39 |
Iceberg East |
|
Including |
15.70 |
16.30 |
0.60 |
77.20 |
|
|
And1 |
23.00 |
25.15 |
2.15 |
11.04 |
|
|
Including |
23.00 |
23.55 |
0.55 |
25.80 |
|
|
NFGC-23-1956 |
No Significant Values |
Iceberg |
|||
|
NFGC-23-1957A |
No Significant Values |
Iceberg East |
|||
|
NFGC-23-19661 |
179.00 |
181.00 |
2.00 |
16.12 |
Iceberg |
|
Including |
180.00 |
181.00 |
1.00 |
31.68 |
|
|
NFGC-23-19701 |
161.00 |
163.35 |
2.35 |
1.39 |
Iceberg |
|
And2 |
184.30 |
187.15 |
2.85 |
1.07 |
|
|
NFGC-23-19771 |
121.40 |
129.35 |
7.95 |
10.39 |
Iceberg |
|
Including |
121.40 |
122.65 |
1.25 |
33.98 |
|
|
Including |
125.00 |
125.45 |
0.45 |
77.68 |
|
|
And2 |
146.35 |
160.60 |
14.25 |
2.59 |
|
|
Including |
155.10 |
155.95 |
0.85 |
12.34 |
|
|
Including |
157.15 |
157.70 |
0.55 |
20.81 |
|
|
And4 |
201.55 |
204.20 |
2.65 |
1.48 |
|
Table 2: Summary of composite results reported in this press release for Iceberg and Iceberg East
Note that the host structures are interpreted to be moderately to steeply dipping and true widths are generally estimated to be 170% to 95%, 240% to 70%, and 310% to 40% of reported intervals. 4True widths are unknown at this time. Infill veining in secondary structures with multiple orientations crosscutting the primary host structures are commonly observed in drill core which could result in additional uncertainty in true width. Composite intervals reported carry a minimum weighted average of 1 g/t Au diluted over a minimum core length of 2m with a maximum of 4m consecutive dilution when above 200m vertical depth and 2m consecutive dilution when below 200m vertical depth. Included high-grade intercepts are reported as any consecutive interval with grades greater than 10 g/t Au. Grades have not been capped in the averaging and intervals are reported as drill thickness.
|
Hole No. |
Azimuth (°) |
Dip (°) |
Length (m) |
UTM E |
UTM N |
Prospect |
|
NFGC-21-194 |
300 |
-45 |
608 |
658587 |
5427560 |
Iceberg |
|
NFGC-22-1065 |
300 |
-45 |
320 |
658422 |
5427866 |
Iceberg |
|
NFGC-22-1069 |
308 |
-49 |
251 |
658282 |
5427630 |
Iceberg |
|
NFGC-23-1152 |
83 |
-45 |
249 |
658284 |
5427850 |
Iceberg |
|
NFGC-23-1177 |
142 |
-45 |
166 |
658283 |
5427849 |
Iceberg |
|
NFGC-23-1323 |
300 |
-45 |
275 |
658515 |
5427783 |
Iceberg |
|
NFGC-23-1328 |
300 |
-45 |
225 |
658848 |
5428140 |
Iceberg East |
|
NFGC-23-1340 |
300 |
-45 |
305 |
658551 |
5427791 |
Iceberg |
|
NFGC-23-1358 |
299 |
-45.5 |
479 |
658507 |
5427672 |
Iceberg |
|
NFGC-23-1404 |
299 |
-45.5 |
161 |
658577 |
5427833 |
Iceberg |
|
NFGC-23-1427 |
300 |
-45 |
257 |
658347 |
5427592 |
Iceberg |
|
NFGC-23-1436 |
0 |
-45 |
227 |
658940 |
5428202 |
Iceberg East |
|
NFGC-23-1443 |
319 |
-53 |
269 |
658571 |
5427779 |
Iceberg |
|
NFGC-23-1445 |
318 |
-45 |
161 |
658338 |
5427660 |
Iceberg |
|
NFGC-23-1489 |
313 |
-45 |
230 |
658679 |
5427833 |
Iceberg East |
|
NFGC-23-1514 |
0 |
-90 |
141 |
658707 |
5428021 |
Iceberg East |
|
NFGC-23-1525 |
319 |
-45 |
129 |
658680 |
5427948 |
Iceberg East |
|
NFGC-23-1533 |
318 |
-57 |
150 |
658680 |
5427948 |
Iceberg East |
|
NFGC-23-1605 |
300 |
-72 |
105 |
658776 |
5428065 |
Iceberg East |
|
NFGC-23-1607 |
300 |
-60 |
161 |
658881 |
5428149 |
Iceberg East |
|
NFGC-23-1613 |
299 |
-68 |
140 |
658848 |
5428140 |
Iceberg East |
|
NFGC-23-1622 |
276 |
-45 |
64 |
658843 |
5428084 |
Iceberg East |
|
NFGC-23-1622A |
276 |
-45 |
125 |
658844 |
5428083 |
Iceberg East |
|
NFGC-23-1746 |
119 |
-45 |
107 |
658456 |
5427887 |
Iceberg |
|
NFGC-23-1757 |
118 |
-54 |
131 |
658442 |
5427896 |
Iceberg |
|
NFGC-23-1766 |
120 |
-45 |
98 |
658435 |
5427872 |
Iceberg |
|
NFGC-23-1769 |
118 |
-46 |
155 |
658317 |
5427850 |
Iceberg |
|
NFGC-23-1776 |
120 |
-45 |
188 |
658316 |
5427883 |
Iceberg |
|
NFGC-23-1780 |
118 |
-53 |
215 |
658287 |
5427900 |
Iceberg |
|
NFGC-23-1789 |
120 |
-45 |
224 |
658288 |
5427900 |
Iceberg |
|
NFGC-23-1800 |
125 |
-49 |
164 |
658360 |
5427865 |
Iceberg |
|
NFGC-23-1805 |
155 |
-45 |
143 |
658359 |
5427864 |
Iceberg |
|
NFGC-23-1813 |
114 |
-48 |
176 |
658365 |
5427878 |
Iceberg |
|
NFGC-23-1820 |
165 |
-55 |
152 |
658407 |
5427858 |
Iceberg |
|
NFGC-23-1827 |
118 |
-60 |
116 |
658407 |
5427860 |
Iceberg |
|
NFGC-23-1832 |
299 |
-45.5 |
176 |
658400 |
5427819 |
Iceberg |
|
NFGC-23-1838 |
299 |
-45.5 |
98 |
658385 |
5427800 |
Iceberg |
|
NFGC-23-1843 |
299 |
-45.5 |
119 |
658377 |
5427776 |
Iceberg |
|
NFGC-23-1866 |
299 |
-45 |
191 |
658354 |
5427759 |
Iceberg |
|
NFGC-23-1873 |
299 |
-45 |
150 |
658375 |
5427747 |
Iceberg |
|
NFGC-23-1879 |
120 |
-54 |
129 |
658426 |
5427879 |
Iceberg |
|
NFGC-23-1887 |
119 |
-46.5 |
188 |
658382 |
5427902 |
Iceberg |
|
NFGC-23-1895 |
119 |
-46 |
173 |
658398 |
5427920 |
Iceberg |
|
NFGC-23-1902 |
173 |
-65 |
107 |
658310 |
5427784 |
Iceberg |
|
NFGC-23-1912 |
355 |
-45 |
62 |
658533 |
5427896 |
Iceberg |
|
NFGC-23-1914 |
16 |
-45 |
86 |
658534 |
5427895 |
Iceberg |
|
NFGC-23-1915 |
140 |
-56 |
101 |
658292 |
5427767 |
Iceberg |
|
NFGC-23-1920 |
280 |
-51 |
83 |
658602 |
5427964 |
Iceberg East |
|
NFGC-23-1922 |
167 |
-63 |
113 |
658292 |
5427767 |
Iceberg |
|
NFGC-23-1924 |
130 |
-45 |
92 |
658279 |
5427745 |
Iceberg |
|
NFGC-23-1925 |
335 |
-60 |
65 |
658603 |
5427965 |
Iceberg East |
|
NFGC-23-1928 |
7 |
-65 |
74 |
658615 |
5427987 |
Iceberg East |
|
NFGC-23-1932 |
280 |
-45 |
89 |
658685 |
5428004 |
Iceberg East |
|
NFGC-23-1938 |
299 |
-45 |
161 |
658318 |
5427723 |
Iceberg |
|
NFGC-23-1950 |
300 |
-50 |
50 |
658681 |
5428035 |
Iceberg East |
|
NFGC-23-1952 |
300 |
-45 |
50 |
658725 |
5428067 |
Iceberg East |
|
NFGC-23-1956 |
299 |
-45 |
221 |
658339 |
5427711 |
Iceberg |
|
NFGC-23-1957A |
300 |
-45 |
47 |
658768 |
5428095 |
Iceberg East |
|
NFGC-23-1966 |
120 |
-45 |
191 |
658262 |
5427886 |
Iceberg |
|
NFGC-23-1970 |
121 |
-55 |
215 |
658262 |
5427886 |
Iceberg |
|
NFGC-23-1977 |
120 |
-45 |
212 |
658255 |
5427861 |
Iceberg |
Table 3: Details of drill holes reported in this press release
Queensway 650,000m Drill Program Update
The Company is currently undertaking a 650,000m drill program at Queensway and approximately 4,500m of core is currently pending assay results.
Sampling, Sub-sampling, and Laboratory
All drilling recovers HQ core. Drill core is split in half using a diamond saw or a hydraulic splitter for rare intersections with incompetent core.
A geologist examines the drill core and marks out the intervals to be sampled and the cutting line. Sample lengths are mostly 1.0 meter and adjusted to respect lithological and/or mineralogical contacts and isolate narrow (<1.0m) veins or other structures that may yield higher grades.
Technicians saw the core along the defined cutting line. One-half of the core is kept as a witness sample and the other half is submitted for analysis. Individual sample bags are sealed and placed into totes, which are then sealed and marked with the contents.
New Found has submitted samples for gold determination by fire assay to ALS Canada Ltd. (“ALS”) and by photon assay to MSALABS (“MSA”) since June 2022. ALS and MSA operate under a commercial contract with New Found.
Drill core samples are shipped to ALS for sample preparation in Sudbury, Ontario, Thunder Bay, Ontario, or Moncton, New Brunswick. ALS is an ISO-17025 accredited laboratory for the fire assay method.
Drill core samples are also submitted to MSA in Val-d’Or, Quebec. MSA operates numerous laboratories worldwide and maintains ISO-17025 accreditation for many metal determination methods. MSA is an ISO-17025 accredited laboratory for the photon assay method.
At ALS, the entire sample is crushed to approximately 70% passing 2mm. A 3,000-g split is pulverized. “Routine” samples do not have visible gold (VG) identified and are not within a mineralized zone. Routine samples are assayed for gold by 30-g fire assay with an inductively-couple plasma spectrometry (ICP) finish. If the initial 30-g fire assay gold result is over 1 g/t, the remainder of the 3,000-g split is screened at 106 microns for screened metallics assay. For the screened metallics assay, the entire coarse fraction (sized greater than 106 microns) is fire assayed and two splits of the fine fraction (sized less than 106 microns) are fire assayed. The three assays are combined on a weight-averaged basis. Samples that have VG identified or fall within a mineralized interval are automatically submitted for screened metallic assay for gold.
At MSA, the entire sample is crushed to approximately 70% passing 2mm. For “routine” samples that do not have VG identified and are not within a mineralized zone, the samples are riffle split to fill one 450g jar for photon assay. If the jar assays greater than 1 g/t, the remaining crushed material is weighed into multiple jars and are submitted for photon assay.
For samples that have VG identified or are within a mineralized zone, the entire crushed sample is weighed into multiple jars and are submitted for photon assay. The assays from all jars are combined on a weight-averaged basis.
All samples prepared at ALS or MSA are also analyzed for a multi-element ICP package (ALS method code ME-ICP61) at ALS Vancouver.
Drill program design, Quality Assurance/Quality Control and interpretation of results are performed by qualified persons employing a rigorous Quality Assurance/Quality Control program consistent with industry best practices. Standards and blanks account for a minimum of 10% of the samples in addition to the laboratory’s internal quality assurance programs.
Quality Control data are evaluated on receipt from the laboratories for failures. Appropriate action is taken if assay results for standards and blanks fall outside allowed tolerances. All results stated have passed New Found’s quality control protocols.
New Found’s quality control program also includes submission of the second half of the core for approximately 2% of the drilled intervals. In addition, approximately 1% of sample pulps for mineralized samples are submitted for re-analysis to a second ISO-accredited laboratory for check assays.
The Company does not recognize any factors of drilling, sampling or recovery that could materially affect the accuracy or reliability of the assay data disclosed.
The assay data disclosed in this press release have been verified by the Company’s Qualified Person against the original assay certificates.
The Company notes that it has not completed any economic evaluations of its Queensway Project and that the Queensway Project does not have any resources or reserves.
Qualified Person
The scientific and technical information disclosed in this press release was reviewed and approved by Greg Matheson, P. Geo., Chief Operating Officer and a Qualified Person as defined under National Instrument 43-101. Mr. Matheson consents to the publication of this press release dated March 13, 2024, by New Found. Mr. Matheson certifies that this press release fairly and accurately represents the scientific and technical information that forms the basis for this press release.
About New Found Gold Corp.
New Found holds a 100% interest in the Queensway Project, located 15km west of Gander, Newfoundland and Labrador, and just 18km from Gander International Airport. The project is intersected by the Trans-Canada Highway and has logging roads crosscutting the project, high voltage electric power lines running through the project area, and easy access to a highly skilled workforce. The Company is currently undertaking a 650,000m drill program at Queensway and is well funded for this program with cash and marketable securities of approximately $49 million as of March 2024.
Please see the Company’s website at www.newfoundgold.ca and the Company’s SEDAR+ profile at www.sedarplus.ca.
Acknowledgements
New Found acknowledges the financial support of the Junior Exploration Assistance Program, Department of Natural Resources, Government of Newfoundland and Labrador.
Contact
To contact the Company, please visit the Company’s website, www.newfoundgold.ca and make your request through our investor inquiry form. Our management has a pledge to be in touch with any investor inquiries within 24 hours.
Neither the TSX Venture Exchange nor its Regulation Services Provider (as that term is defined in the policies of the TSX Venture Exchange) accepts responsibility for the adequacy or accuracy of this release.
Forward-Looking Statement Cautions
This press release contains certain “forward-looking statements” within the meaning of Canadian securities legislation, relating to exploration, drilling and mineralization on the Company’s Queensway gold project in Newfoundland and Labrador; assay results; the interpretation of drilling and assay results, the results of the drilling program, mineralization and the discovery of zones of high-grade gold mineralization; plans for future exploration and drilling and the timing of same; the merits of the Queensway project; future press releases by the Company; and funding of the drilling program. Although the Company believes that such statements are reasonable, it can give no assurance that such expectations will prove to be correct. Forward-looking statements are statements that are not historical facts; they are generally, but not always, identified by the words “expects”, “plans”, “anticipates”, “believes”, “interpreted”, “intends”, “estimates”, “projects”, “aims”, “suggests”, “demonstrates”, “encouraging”, “indicate”, “often”, “target”, “future”, “likely”, “pending”, “potential”, “goal”, “objective”, “prospective”, “possibly”, “preliminary”, and similar expressions, or that events or conditions “will”, “would”, “may”, “can”, “could” or “should” occur, or are those statements, which, by their nature, refer to future events. The Company cautions that forward-looking statements are based on the beliefs, estimates and opinions of the Company’s management on the date the statements are made, and they involve a number of risks and uncertainties. Consequently, there can be no assurances that such statements will prove to be accurate and actual results and future events could differ materially from those anticipated in such statements. Except to the extent required by applicable securities laws and the policies of the TSX Venture Exchange, the Company undertakes no obligation to update these forward-looking statements if management’s beliefs, estimates or opinions, or other factors, should change. Factors that could cause future results to differ materially from those anticipated in these forward-looking statements include risks associated with possible accidents and other risks associated with mineral exploration operations, the risk that the Company will encounter unanticipated geological factors, risks associated with the interpretation of assay results and the drilling program, the possibility that the Company may not be able to secure permitting and other governmental clearances necessary to carry out the Company’s exploration plans, the risk that the Company will not be able to raise sufficient funds to carry out its business plans, and the risk of political uncertainties and regulatory or legal changes that might interfere with the Company’s business and prospects. The reader is urged to refer to the Company’s Annual Information Form and Management’s discussion and Analysis, publicly available through the Canadian Securities Administrators’ System for Electronic Document Analysis and Retrieval (SEDAR+) at www.sedarplus.ca for a more complete discussion of such risk factors and their potential effects.

View source version on businesswire.com: https://www.businesswire.com/news/home/20240313762569/en/
The price of gold today, as of 9:09am, was £1,687.29 per ounce. That’s up 0.08% on yesterday’s closing price of £1,685.98.
Compared to last week, the price of gold is up 2.53%, and it’s up 5.24% from one month ago.
The 52-week gold price high is £1,698.02, while the 52-week gold price low is £1,581.70.
Many investors consider gold to be the ultimate safe-haven asset, relying on the theory that when the prices of shares, bonds and property drop sharply, gold may hold its value – and its price can even increase as nervous investors rush in to buy.
Investing in gold is also a way to add diversification to your investment portfolio. When you hold a diversified mix of different assets, including gold, varying returns can protect the value of your investments.
There are several ways to invest in gold. Each has pros and cons…
One option is to buy gold in physical form:
Alternatively, investors can invest in gold indirectly:
You should consider investing in gold if you’re looking to hedge against risk or diversify your portfolio. Gold would probably not be your first choice to earn long-term capital growth.
Over the past five years, the price of gold has appreciated approximately 36% while the total return of the S&P 500 has been 60%.
Gold prices can be extremely volatile, and that means that gold isn’t an entirely stable investment. In fact, you can easily craft a well-diversified investment portfolio entirely without gold.
It should also be noted that gold in its physical form, unlike other investments, does not produce an income or yield.
If you buy physical gold, you also need to consider where you are going to keep it, and whether there will be costs associated with secure storage.
Studies have found that gold may be an effective way to defend your wealth against inflation, but only over extremely long periods of time, measured in decades or even centuries.
Over shorter time periods, the inflation-adjusted price of gold fluctuates dramatically, typically making it a poor near-term hedge for inflation.
Inflation reduces the ‘real’ value of a currency over time. Or, put another way, £50 today buys you less than it did 10 years ago. However, gold can provide a way of protecting the ‘real’ value of your wealth against inflation.
During a period of high inflation, as is currently the case in the UK and US, investors may revert to buying gold as a real physical asset that holds its value.
Periods of high inflation often correspond with a rise in interest rates and general economic uncertainty. As a result, gold is seen to some as a safe haven and, in theory, increased demand results in a rise in price.
Over the last 20 years, annual inflation has averaged 3% in the UK, according to the Office for National Statistics. Over the same period, the price of gold has increased by an average of 9% per year (according to the World Gold Council). Whereas the average base rate (a proxy for the interest rate on savings) was 3% over this period, according to the Bank of England.
Adjusting for the inflation rate of 3%, the ‘real’ value of gold has therefore increased by an average of 6% per year. In comparison, savers would have experienced no ‘real’ increase in the value of cash held in savings accounts due to the impact of inflation.
Gold may offer investors a safe haven in times of economic and geopolitical volatility. It may also provide a way of preserving wealth in a high inflation environment. As with shares, the price of gold is volatile. However it has delivered an increase in value over the last 30 years.
Investors should also consider the effect of foreign currency movements when deciding whether to buy gold. Gold is typically denominated in US dollars and, as a result, tends to have an inverse relationship with the US dollar. This means that, if the US dollar strengthens against other currencies, the price of gold can fall.
Looking over the last year, the price of gold in US dollars has decreased by 3% as the US dollar has strengthened against other currencies. However, the price of gold in sterling has increased by 10% due to the weakening of the pound against the dollar.
Overall, it is difficult to assess whether it’s a good time to buy gold as its price is dependent on a number of factors. Although a continuation in the current level of economic and political uncertainty may provide a tailwind for gold prices, investors should also be aware of the volatility of this asset.
Gold is a limited commodity with a relatively static supply, meaning that the price of gold is highly sensitive to changes in demand. A fall in demand will therefore result in a drop in the value of gold.
By way of example, the price of gold fell by over 25% from 2011 to 2013. It also fell from over $2,000 per Troy ounce in mid-2020 to less than $1,700 in early 2021, a fall of 17%.
The price of gold is determined by the level of supply and demand. The daily price is set by the London Bullion Market Association (LBMA) and there are two different types of gold prices:
Digital gold (or digigold) is a form of digital currency that allows you to buy fractions of physical gold stored by the seller. Buyers of digital gold will own, and have legal title to, the gold, with the seller acting as custodian.
Digital gold enables buyers to invest by value – say, £25 – rather than by weight (as with a 1 kilogram bar of bullion). Buyers can also invest a lower minimum amount than with the physical asset.
Digital gold also offers a saving in terms of storage and insurance. For example, the Royal Mint charges an annual management fee of 0.5% for its DigiGold products, compared to 1-2% for physical gold.
As buyers own the underlying physical gold, their profit (or loss) will be dependent on the price of gold, as covered in the questions above.
You can buy physical gold in the form of bullion, coins or jewellery, or invest in digital gold:
Investors may also want to consider investing in an indirect form of gold, including:
*The gold price data above is provided by Zyla Labs, which sources asset price data from a wide range of sources. This gold price represents an average of spot gold prices on several leading metals exchanges. Prices are updated every business day.
Gold Silver Price Today 13 March 2024: Gold and Silver prices both went down the Multi Commodity Index on Wednesday.
The average price of 10 gram of 22K Gold stood at ₹60,350 while the 24K gold prices stood at ₹65,840.
The rate of 10 grams of 24K gold in Chennai stood at ₹66,650, which was followed by Delhi and Jaipur where the gold costs ₹65,990.
The average price of 1 kg of silver stood at ₹75,200.
However, in Chennai, Hyderabad, and Kerala the metal was sold at ₹78,500 followed by Delhi and Mumbai where the metal was sold at ₹75,600
24 Carat Gold Price Today 13 March (per 10gm) – Indian Top Cities
Delhi – ₹65,990
Chennai – ₹66,650
Mumbai – ₹65,840
Kolkata – ₹65,840
Bengaluru – ₹65,840
1 KG Silver Price Today 13 March – Indian Top Cities
Delhi – ₹75,200
Chennai – ₹78,500
Mumbai – ₹75,200
Kolkata – ₹75,200
Bengaluru – ₹75,100
Gold and Silver prices experience fluctuations influenced by multiple factors, including insights from jewellers. These factors encompass global demand for gold, fluctuations in currency values across nations, prevailing interest rates, and governmental regulations governing the gold trade.
Additionally, global events such as the state of the world economy and the strength of the US dollar relative to other currencies significantly impact gold prices within the Indian market.
During 2023-24, gold exhibited remarkable returns, surpassing expectations and emerging as a robust asset for investors in the face of economic uncertainties and market fluctuations. The yellow metal achieved a new pinnacle, reaching Rs 66,100 on Monday.
Factors such as inflation concerns and geopolitical tensions contributed to the increased demand for gold, making it a standout performer in investment portfolios.
The notable 12-3% return in gold thus far in 2023-24 emphasizes its resilience as an investment, appealing to investors in search of stability and a hedge against economic uncertainties.
The record-breaking surge in gold prices is not merely a result of market
Simultaneously, within domestic markets, the confluence of festive and wedding seasons has driven a healthy demand for gold, further contributing to the remarkable price hike.
In 2024, potential opportunities in the bullion market may stem from ongoing economic uncertainties, concerns about inflation, or geopolitical tensions. It is advisable for traders and investors to diligently observe global events, central bank policies, and market trends in order to pinpoint strategic entry points within the precious metals market. Gold and silver
“Gold is trading at record high prices around $2200 (~Rs 66000) on strong demand from China, as Chinese investors are hedging against potential economic instability amid the commercial real estate crisis in their country. Moreover, lower growth concerns in other economies around the world is also supporting the prices,” said Sachin Kothari, Director of Augmont Gold for All.
Kothari also added that, some investors are trying to hedge against the possibility of higher-than-expected inflation, realign their portfolios after the stock market
“The price of gold experienced a historic upswing, reaching a record high of $2,195 per ounce. Several geopolitical factors, including speculations in the policy by the US Federal Reserve and a weakening US Dollar, have contributed to the rise in gold prices. This, in turn, led to an increased procurement of gold by central banks,” said Amit Goel, Co-Founder and Chief Global Strategist at Pace 360
Goel also added, Despite high-interest rates and robust equity markets, gold has sustained its strong performance. Positioned at the cusp of a multi-year bull run, we anticipate a multi-fold return in the coming years. All global macro-fundamental factors align to highlight the stunning potential of this asset class.
The price of 24-carat gold slipped Rs 10 in early trade on Wednesday, March 13, with ten grams of the yellow metal trading at Rs 66,250. The price of silver, on the other hand, increased by Rs 100, with one kilogram of the precious metal selling at Rs 76,200.
The price of 22-carat gold also dropped Rs 10 with the precious metal selling at Rs 60,730.
Gold rate today in India: Retail gold price on March 13
The price of ten grams of 24-carat gold in Mumbai is in line with prices in Kolkata and Hyderabad, at Rs 66,250.
In Delhi, Bengaluru, and Chennai, the price of ten grams of 24-carat gold stood at Rs 66,400, Rs 66,250, and Rs 67,080, respectively.
In Mumbai, the price of ten grams of 22-carat gold is at par with that in Kolkata and Hyderabad, at Rs 60,730.
The price of one kilogram of silver in Delhi, Mumbai, and Kolkata stood at Rs 76,200.
Check gold rates today in different cities on March 13, 2024; (In Rs/10 grams)
| City | 22 Carat Gold Price | 24-Carat Gold Price |
| Chennai | 61,500 | 67,100 |
| Kolkata | 60,750 | 66,270 |
| Gurugram | 60,900 | 66,420 |
| Lucknow | 60,900 | 66,420 |
| Bengaluru | 60,750 | 66,270 |
| Jaipur | 60,900 | 66,420 |
| Patna | 60,800 | 66,320 |
| Bhubaneshwar | 60,750 | 66,270 |
| Hyderabad | 60,750 | 66,270 |
Retail Cost of Gold
The retail price of gold in India, often referred to as the gold rate, is the final cost per unit weight that customers pay when purchasing gold. This price is influenced by several factors beyond the inherent value of the metal itself.
2024 Outlook
As per the recent statement from the All India Gem and Jewellery Domestic Council (GJC), they anticipate that ongoing global economic uncertainties and geopolitical tensions will drive gold prices to reach a historic peak of Rs 70,000 per 10 grams in the coming year. This projection highlights gold’s role as a reliable investment and a valuable safeguard against inflation.
The price of gold in India today is 6,073 per gram for 22 karat gold and 6,625 per gram for 24 karat gold
Advertising
Advertising
The price of gold in Mumbai is 6073 per gram for 22 karat gold and 6625 per gram for 24 karat gold.
The gold price today in Kolkata is 6073 per gram for 22 karat gold and 6625 per gram for 24 karat gold.
The Gold price today in Chennai is 6148 per gram for 22 karat gold and 6708 per gram for 24 karat gold.
The gold price today in Delhi is 6088 per gram for 22 karat gold and 6640 per gram for 24 karat gold.
The gold price today in Thane is 6073 per gram for 22 karat gold and 6625 per gram for 24 karat gold.
The gold price today in Surat is 6078 per gram for 22 karat gold and 6630 per gram for 24 karat gold.
The gold price today in Pune is 6073 per gram for 22 karat gold and 6625 per gram for 24 karat gold.
The gold price today in Nagpur is 6073 per gram for 22 karat gold and 6625 per gram for 24 karat gold.
Published Date:March 13, 2024 8:16 AM IST
Updated Date:March 13, 2024 8:16 AM IST


; Check Gold Rate In Delhi, Mumbai, Kolkata, Chennai, Thane, Surat, Pune, Nagpur")