

Category: Forex News, News
Natural Gas Price Forecast: Faces Downward Pressure After Rejection at 200-Day MA
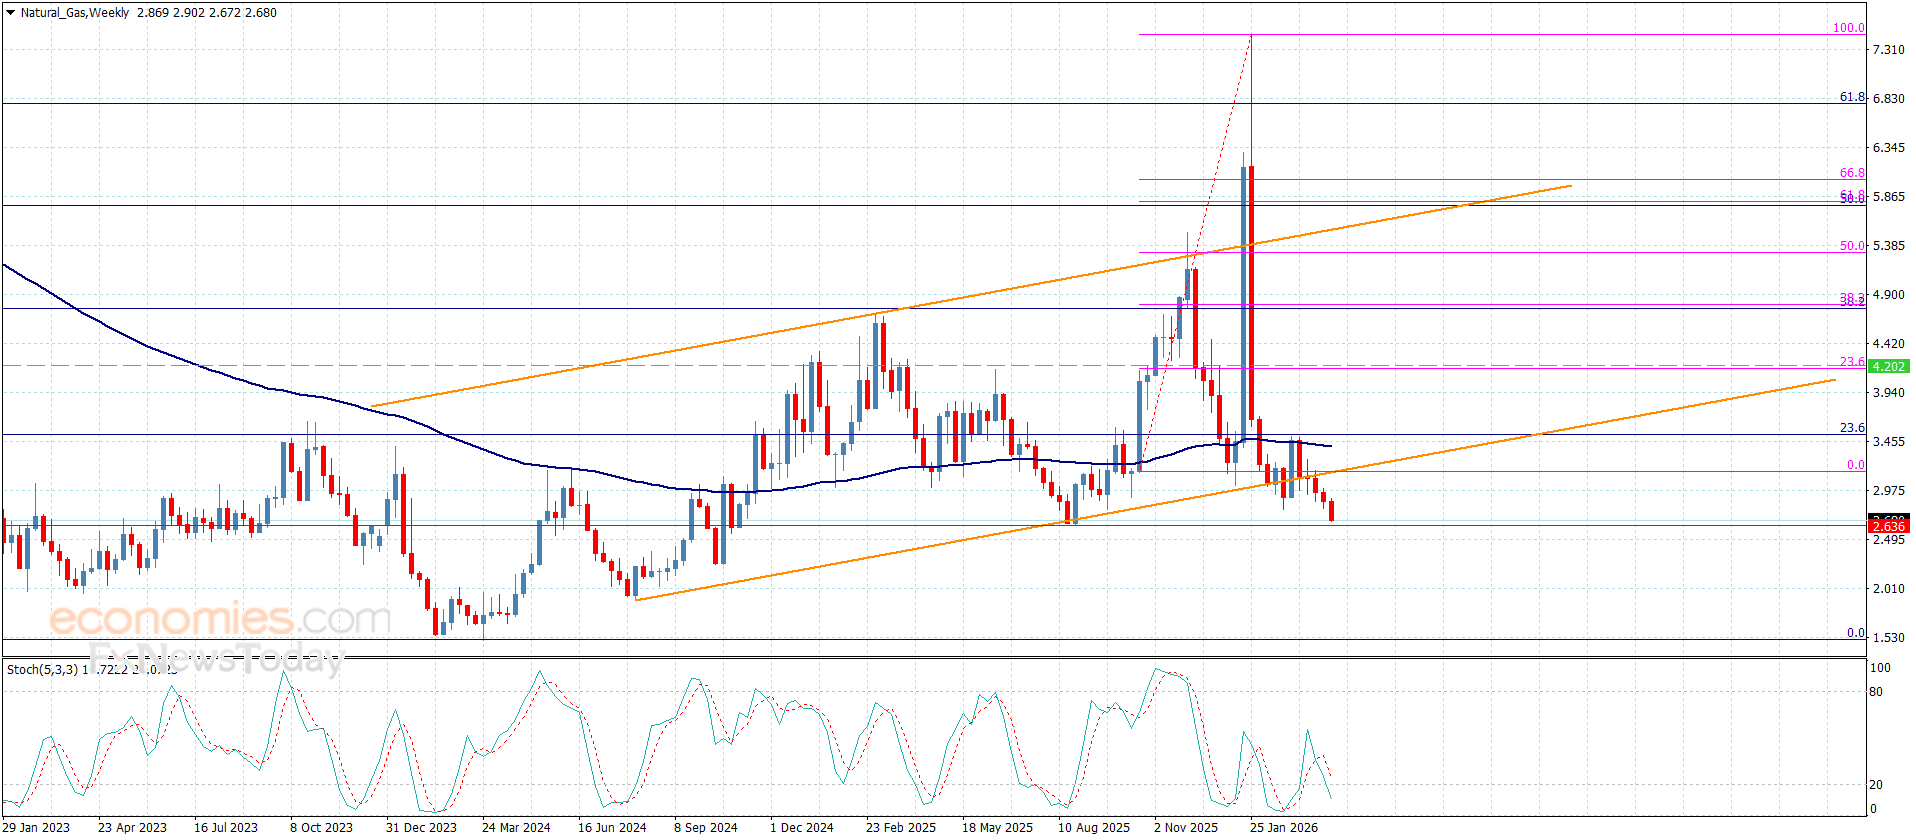
Maximum Downside Around $2.78
The above analysis includes the lower price zone that may show the maximum potential decline for the current bearish correction. What it illustrates is that a 31.5% drop in the price of natural gas is not unusual during a correction, as it was exceeded twice this year. However, be aware that the full downswing from the March trend high was greater than a 31.5% decline. Whether the potential target zone is reached or not, what it shows is that there is further downside potential for the current correction. This makes lower targets that are above the 78.6% Fibonacci level more likely to be reached before a new bottom is established.
Rejection at 200-Day Resistance
On Friday, natural gas rallied to a three-day high of $3.42 before encountering resistance around the 200-Day MA, now at $3.43. Subsequently, sellers took charge and drove the price down to a low for the day at $3.92. At the time of this writing, downward pressure remains as trading continues in the lower half of the day’s trading range. A rejection of price at the 200-Day MA resistance puts natural gas in a position to continue to fall towards the next lower target zone for the downtrend, at $2.97 to $2.95.

Strength Above $3.47
Nonetheless, a decisive rally above the week’s high of $3.47 could turn sentiment from bearish to bullish. It would signal a potential one-week bullish reversal. Following a daily close above that high to confirm the breakout, natural gas would be heading up into potential resistance at $3.53, followed by $3.57.
For a look at all of today’s economic events, check out our economic calendar.
Source link


Written by : Editorial team of BIPNs
Main team of content of bipns.com. Any type of content should be approved by us.


Share this article: