
Category: Forex News, News
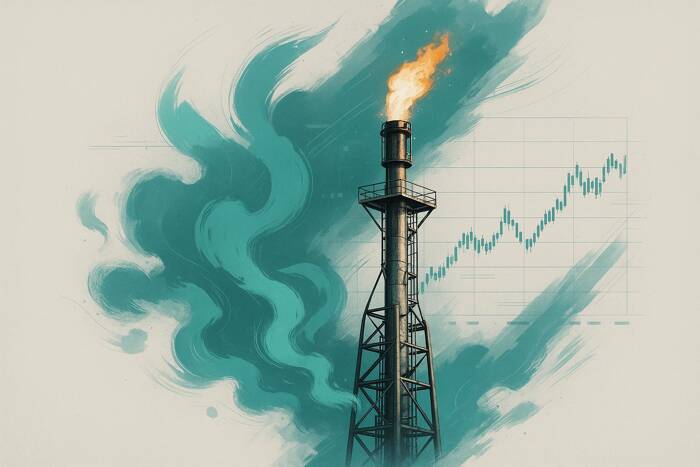
Natural Gas Price Forecast: Holds Strength, Tests 50-Day Resistance Near $3.14
Indicators Point to Ongoing Strength
Momentum has been building since last week’s bullish breakout from a falling wedge pattern. That advance was reinforced by a reclaim of several key resistance levels, including the 20-Day moving average. If today’s low of $3.02 is broken, natural gas could revisit support near the long-term anchored VWAP, now at $2.96, with further downside risk toward the 20-Day moving average at $2.89. For now, though, the market continues to trade well above those levels, suggesting that buyers remain in control.
Watching the 50-Day Average
The 50-Day moving average is a critical pivot. A sustained advance and daily close above this average would open the door for a rally through the July swing high of $3.19 and potentially toward the 200-Day average, now near $3.50. Conversely, another rejection here would not be surprising given the nearly 20% rally off the recent $2.62 low. A brief consolidation or pullback would provide a healthier setup for continuation, rather than a straight-line advance.
Weekly Confirmation in Play
On the larger timeframe, natural gas continues to show signs of strength. Last week produced a wide-ranging bullish engulfing pattern on the weekly chart, supported by a bullish reversal confirmation this week. A weekly close above last week’s high of $3.02 would cement the breakout and bolster the case for a push through current resistance. That confirmation, coupled with strong price behavior above the AVWAP and 20-Day average, underscores improving demand.
For a look at all of today’s economic events, check out our economic calendar.
Source link


Written by : Editorial team of BIPNs
Main team of content of bipns.com. Any type of content should be approved by us.


Share this article: