

Category: Forex News, News
Natural Gas Price Forecast: Reverses Sharply After Failing Key Support Levels
Monthly Bearish Signal
The higher timeframe monthly chart has also turned bearish. Last week a bearish shooting star candlestick pattern triggered on the monthly chart. Given today’s bearish price action, it needs to be considered as the longer-term patterns influence the shorter. However, it is not just the one-month breakdown that is of concern. A bullish breakout of an inside month triggered the month before in June. Therefore, this month’s breakdown is also a failure of the bullish signal the month before. Failed breakouts can result in sharp moves in the opposite direction. Nonetheless, it indicates downside pressure on the price of natural gas.
Prior Corrections Point Lower
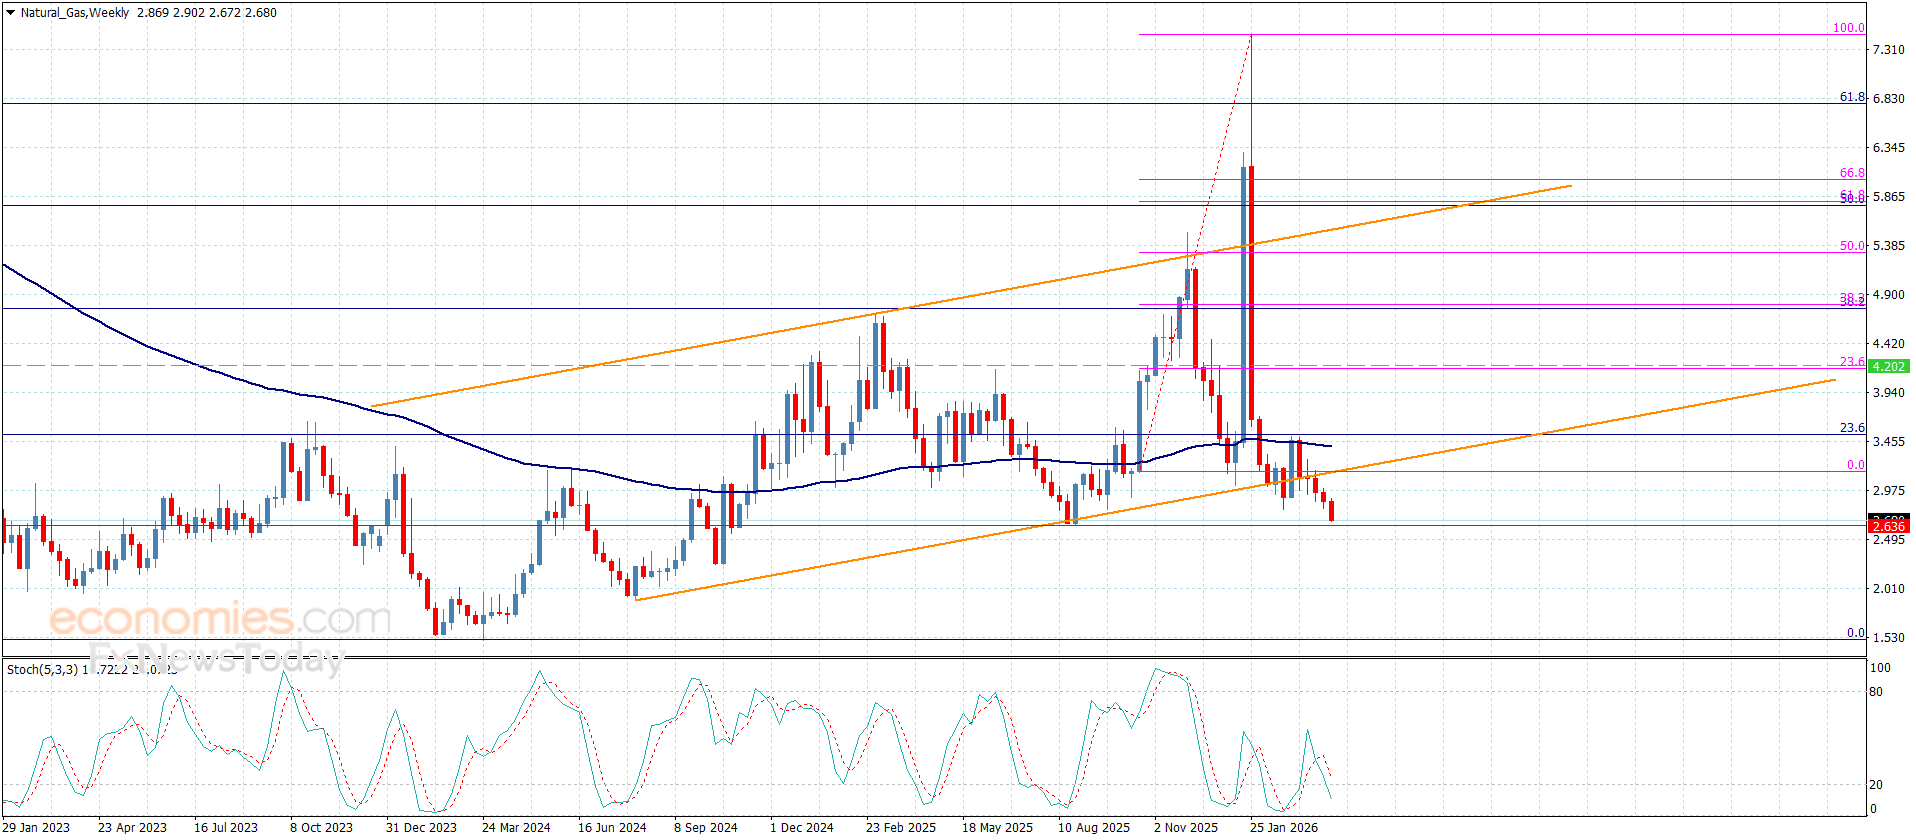
For perspective, a bearish measured move (light blue) was added to the current downswing on the chart. It matches part of the prior bearish correction that began following the March trend high on a percentage basis. Moreover, the bearish correction prior to March completed after a 31.6% decline in the price of natural gas. Interestingly, the target from that measured move matches a 78.6% Fibonacci retracement level at $2.80. But for that level to be reached higher and potentially significant support would need to be broken.

Lower Uptrend Line is a Target
If the interim May swing low at $3.10 is broken, the next lower target zone becomes more likely to be reached. That low is also a monthly low from May. There are two dynamic support lines of significance. A long-term rising trendline is in purple, and it connects to the August 2024 swing low. It represents the lower boundary area of a long-term rising trend channel.
Earlier this year resistance was seen on several occasions around the top channel line. Once there is a reversal from one side of a pattern, there is a possibility that price eventually reaches the other side. Given the second break below an internal uptrend line today, that lower line comes into focus. In addition, there is AVWAP line that is close to converging with the uptrend line.
For a look at all of today’s economic events, check out our economic calendar.
Source link


Written by : Editorial team of BIPNs
Main team of content of bipns.com. Any type of content should be approved by us.


Share this article: