
Category: Forex News, News
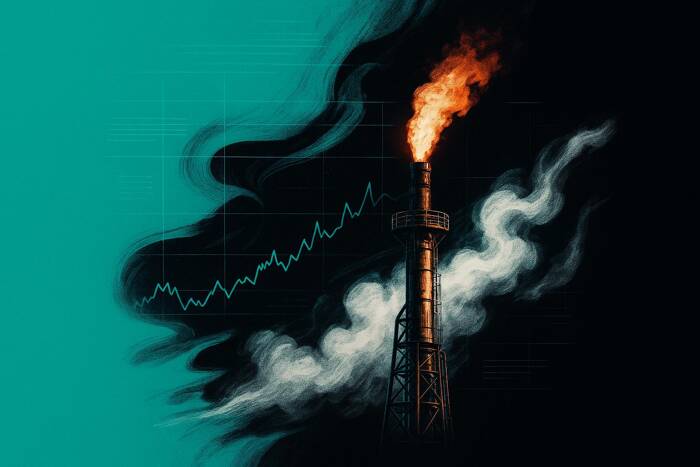
Natural Gas Price Forecast: Tags 50-Day Confluence – Bounce or Breakdown?
Seller Control Persists
Despite arriving at this key confluence, sellers remain in clear control at writing with price pinned near session lows. This keeps today’s $4.07 low vulnerable heading into next week unless a meaningful intraday rally emerges before the close—currently showing no signs of materializing, though the significance of the 50-day line leaves room for a potential hold.
First 50-Day Test Since Reclaim
The 50-day average was decisively reclaimed in October and has not been revisited as support since. Friday marks the first touch in that span, making a defensive buyer response entirely normal and expected behavior. The low also reached the lower Bollinger Band (not shown), adding another classic oversold marker that often precedes at least short-term relief.

Deeper Downside Contingency
A decisive decline through today’s low would confirm continued weakness and target the 61.8% Fibonacci retracement near $3.89—though that level lacks strong confluence and is therefore suspect as a final floor. A clean break there quickly exposes the 200-day average at $3.58 as the next major downside objective.
Monthly Reversal Risk Rising
Since July’s $2.62 swing low, natural gas has posted three straight months of higher highs and lows, defining a clear monthly uptrend. December delivered a new higher high at $5.50 before the current sharp retracement. Friday’s brief breach of last month’s $4.09 low—now being actively tested—raises the odds of a one-month bearish reversal, with a weekly or monthly close below confirming the pattern and its bearish implications.
Outlook
Natural gas has arrived at the highest-probability bounce zone with the 50-day average, channel line, and last month’s low all converging near $4.07–$4.09. A strong defense here fits historical behavior and could spark a tradeable relief rally; failure and close below $4.09 triggers a monthly reversal and opens a fast move toward $3.89 and ultimately the 200-day at $3.58.
For a look at all of today’s economic events, check out our economic calendar.
Source link


Written by : Editorial team of BIPNs
Main team of content of bipns.com. Any type of content should be approved by us.


Share this article: