The main category of All News Articles.
You can use the search box below to find what you need.
[wd_asp id=1]
The main category of All News Articles.
You can use the search box below to find what you need.
[wd_asp id=1]
The Euro to Pound Sterling (EUR/GBP) exchange rate held steady at 0.8637, with the pair consolidating as markets digest central bank signals from both the European Central Bank and Bank of England.
MUFG notes that, barring a sharp fall in energy prices, both the ECB and BoE are set to raise interest rates in the coming months, with tightening expectations now largely priced into markets.
“Without a dramatic reversal in energy prices… both the BoE and the ECB will be hiking rates.”
The bank highlights that UK rate expectations have shifted significantly, with markets now pricing between two and three hikes this year, while ECB guidance has been more explicit regarding a near-term move.
MUFG expects limited divergence between the two central banks, suggesting that EUR/GBP is likely to remain rangebound in the near term.
However, the bank sees a modest upside risk for the pair, reflecting slightly stronger signalling from the ECB.
“There was little yesterday to suggest much in the way of policy divergence… and hence, EUR/GBP range trading looks set to continue.”
MUFG expects the Euro to Pound Sterling exchange rate (EUR/GBP) to trade in a narrow range near current levels in the near term, with a modest upside bias towards higher levels, supported by clearer ECB rate hike signals.

EUR/GBP — Key Rate Highlights:
Current Rate: 0.863736 (04 May 2026, 08:00 UTC)
Daily Move: +0.04% (+0.000355)
Latest Close: 0.863737 (01 May)
May Range: 0.861981 – 0.863890
May Performance: +0.17%
12-Month Range: 0.840670 – 0.886524
Recent Trend: EUR/GBP edging higher in early May, following a broader downtrend seen through April
Disclaimer: For information only, not investment advice. This EUR to GBP forecast summarises and interprets third-party research; views expressed are those of the original source and may not fully reflect the source’s complete analysis. Neither the source nor we accept liability for reliance on this interpretation.
I wrote on 26th April that the best trades for the week would be:
Long of the USD/JPY currency pair following a daily (New York) close above ¥160. This set up on Thursday, but thanks to the Bank of Japan’s intervention in the market on Friday, it produced a loss of 2.13%.
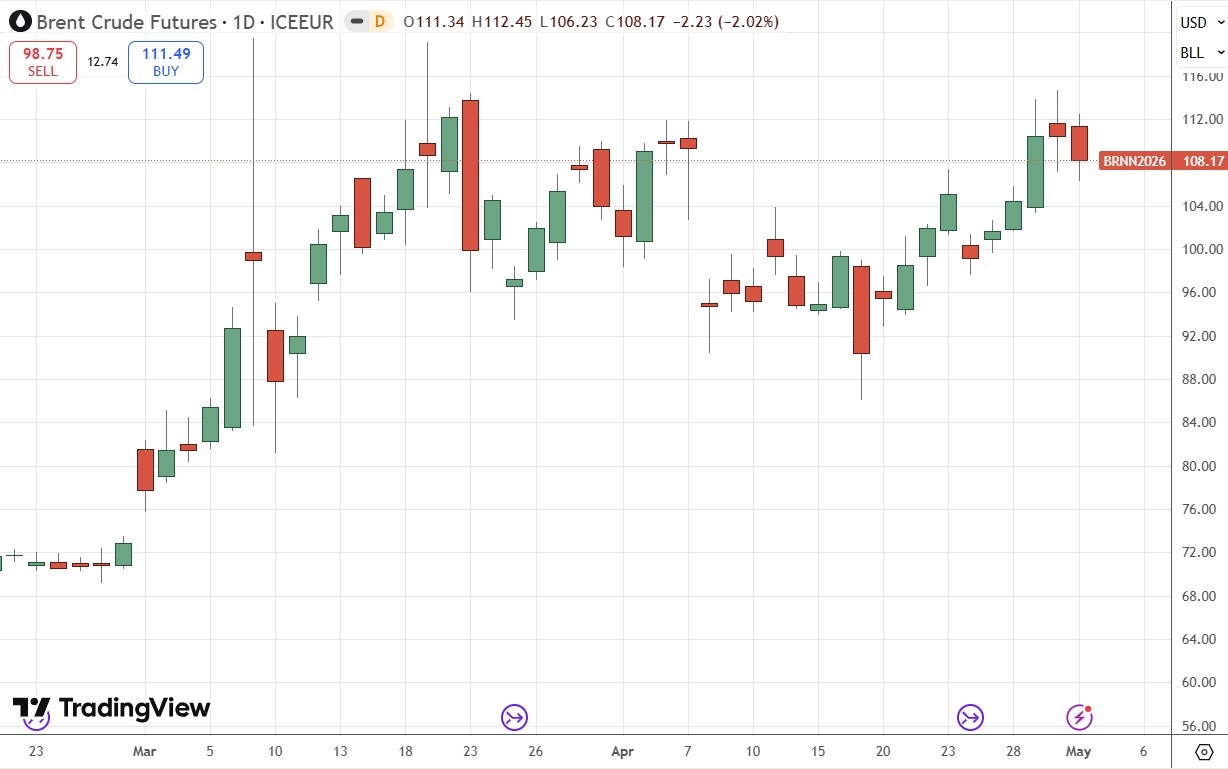
Long of Brent Crude Futures if we get a daily close above $112.50. This did not set up.
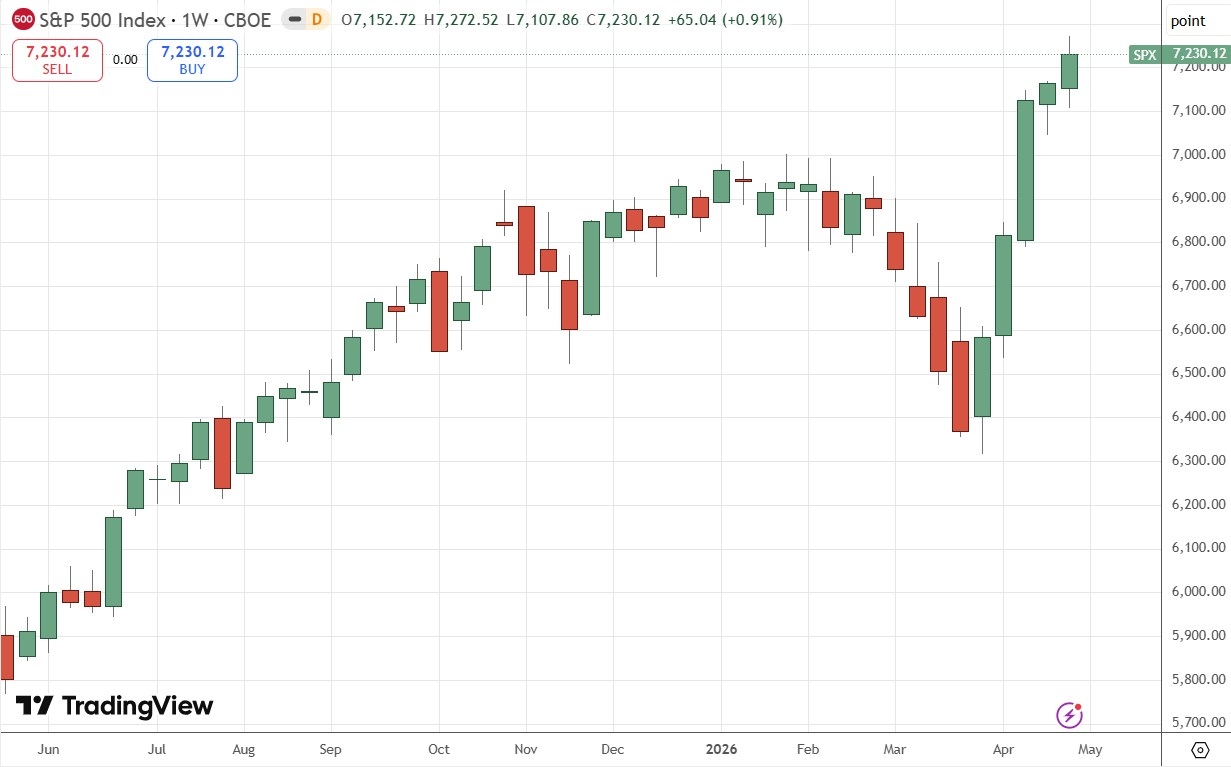
Long of the S&P 500 Index following a daily close above 7,165. This set up on Monday and produced a gain of 0.78%.
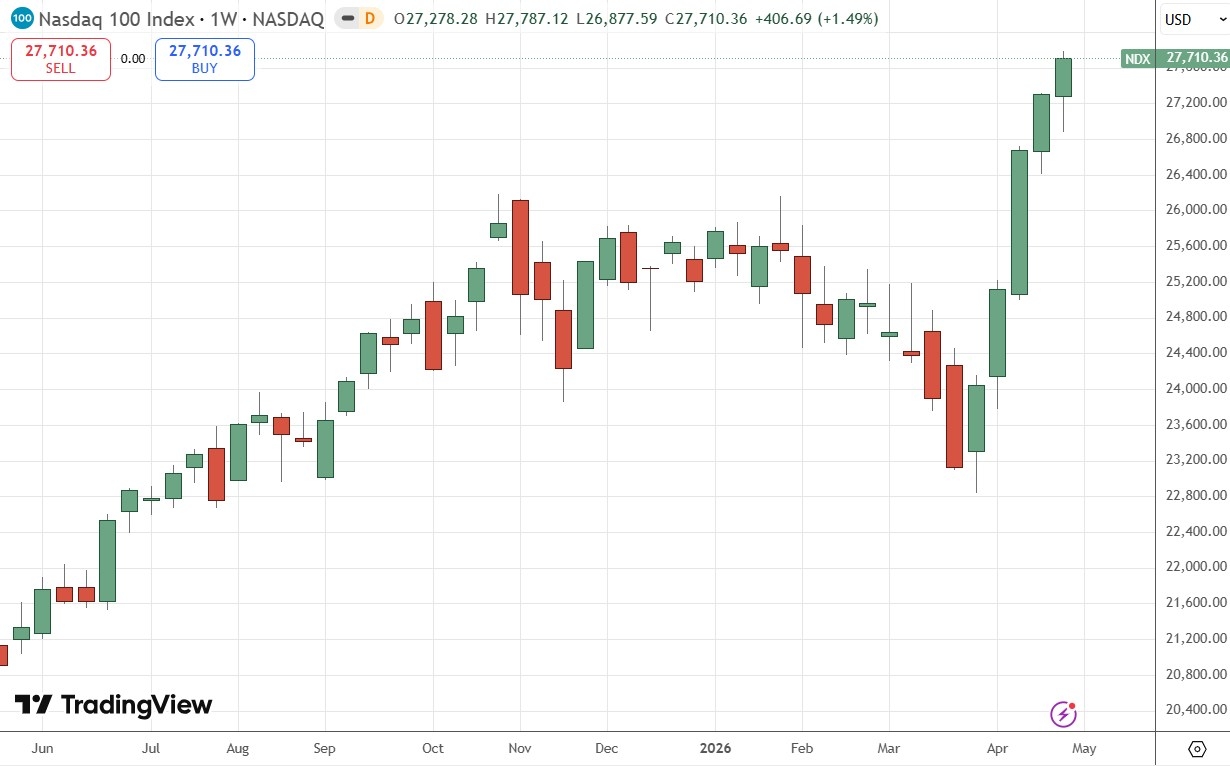
Long of the NASDAQ 100 Index following a daily close above 27,303. This set up on Monday and produced a gain of 1.48%.
The overall gain of 0.13% last week averaged as a per asset gain of 0.03%.

A summary of last week’s most important data in the market:
US Federal Funds Rate and FOMC Statement – rates held as expected, but the large number of hawkish dissenting votes surprised and produced a minor hawkish tilt.
US Core PCE Price Index – exactly as expected.
US Advance GDP – slightly lower than expected, with annualized growth seen at 2.0% not the 2.2% which was expected, giving a small dovish tilt.
US Employment Cost Index – a fraction higher than expected, which will be a tiny hawkish tilt on Fed pressures.
Bank of Japan Policy Rate, Monetary Policy Report, and Outlook Report. This was like the Fed – the Bank voted to keep rates on hold, but with a surprisingly large dissent of 3 votes for an immediate hike. This is a minor hawkish tilt.
European Central Bank Main Refinancing Rate and Monetary Policy Statement – left rates on hold as expected, but slightly more hawkish on the prospect of stagflation.
Bank of England Official Bank Rate & Votes, Monetary Policy Summary & Report
Bank of Canada Overnight Rate, Policy Report, and Rate Statement – left rates on hold as expected, but slightly more hawkish on the prospect of inflation.
Australia CPI (inflation) – came in lower than expected, with an annualized rate of 4.6% while 4.8% was expected.
Canadian GDP – this was as expected.
For yet another week, last week’s economic data releases were much less influential upon the markets than the ongoing US/Iran negotiations/standoff. Perception is moving in the direction of a stalemate, with Iran making proposal that are miles off the USA’s demands, and President Trump complaining aloud that Iran’s leadership is so divided it can’t come to a unified position, and then occasionally saying he doesn’t care about a deal and might resume bombing anyway.
The result of this is that energies are continuing to edge higher, and prediction markets are now not seeing a peace agreement as likely by the end of June, or Iran handing over enriched uranium to the USA by the end of 2026.
President Trump has a non-kinetic weapon which he may be trusting in – the US naval blockade of Iran, which is estimated to be costing Iran about $400 – $500 million per day. It may still be that the USA will launch fresh attacks – US military tankers have been observed building up at Israeli airports, just as was so before the initial hostilities erupted at the end of February. However, such attacks are most likely to happen at the weekend, so once markets reopen for the week it is probably off the table until at least the next weekend.
Although there were several major central bank policy meetings last week, they all said essentially the same thing, and nothing was truly unexpected, so there was a relatively low level of directional volatility in the markets last week. The major central bank event last week was the Bank of Japan’s public intervention last Friday to shore up the Japanese Yen after the benchmark USD/JPY currency pair traded well above ¥160. The large-scale Yen purchase sent the Yen from 2% to 3% higher against most other currencies and was the Yen’s largest daily advance in over three years. The Yen gave up some of its gains by the end of the day.
The outcome of negotiations and the ceasefire concerning the Middle East war is likely to remain very influential on the market over the coming week, with only a few scheduled high-impact items, including an Australian central bank policy meeting, which could have a big impact.
The coming week’s most important data points, in order of likely importance, are:
Reserve Bank of Australia Policy Meeting: Cash Rate, Rate and Monetary Policy Statements
US JOLTS Job Openings
US ISM Services PMI
New Zealand Unemployment Rate
Monday is a public holiday in China, Japan, and the UK.
Tuesday is a public holiday in Japan and China.
Friday is a public holiday in Japan.
Currency Price Changes and Interest Rates
For the month of April, I forecasted that the USD/JPY currency pair would rise in value. The final performance of the forecast was not profitable:

For the month of May, as there is no clear trend in the US Dollar, I make no monthly forecast.
Last week, I made no weekly forecasts as there were no unusual movements in the Forex market last week.
Volatility increased last week, with only 19% of currency pairs moving by more than 1% in value. Next week’s volatility is likely to be the same or even lower, as there are few high-impact events scheduled, although a sudden and surprising development in the USA / Iran war could move the market dramatically at any time. Having said that, a drawn-out blockade process still looks more likely than a return to kinetic war.
You can trade these forecasts in a real or demo Forex brokerage account.
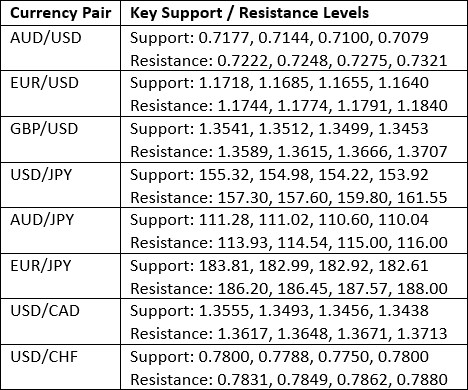
Key Support and Resistance Levels
The US Dollar printed an indecisive near-doji candlestick last week. We have a mixed long-term trend, with the 3-month trend bullish and the 6-month trend bearish.
The greenback is clearly within a long-term consolidation phase, so we cannot really expect much of a trend in the US Dollar here. I don’t see any clear direction for the greenback based on this chart.
I think the greenback will be more driven by the progression of the USA / Iran standoff– if war breaks out again, it will likely boost the Dollar, not so much as a haven but more as an effect of the inflationary shock of the rising energy prices. If we start to see progress on a real long-term deal, conversely, it will probably be bearish for the US Dollar.
Markets have become less optimistic about a deal, but so far, this is not boosting the USD. I think it will be wide to disregard the USD in trading this week – just look at the other side of the trade.
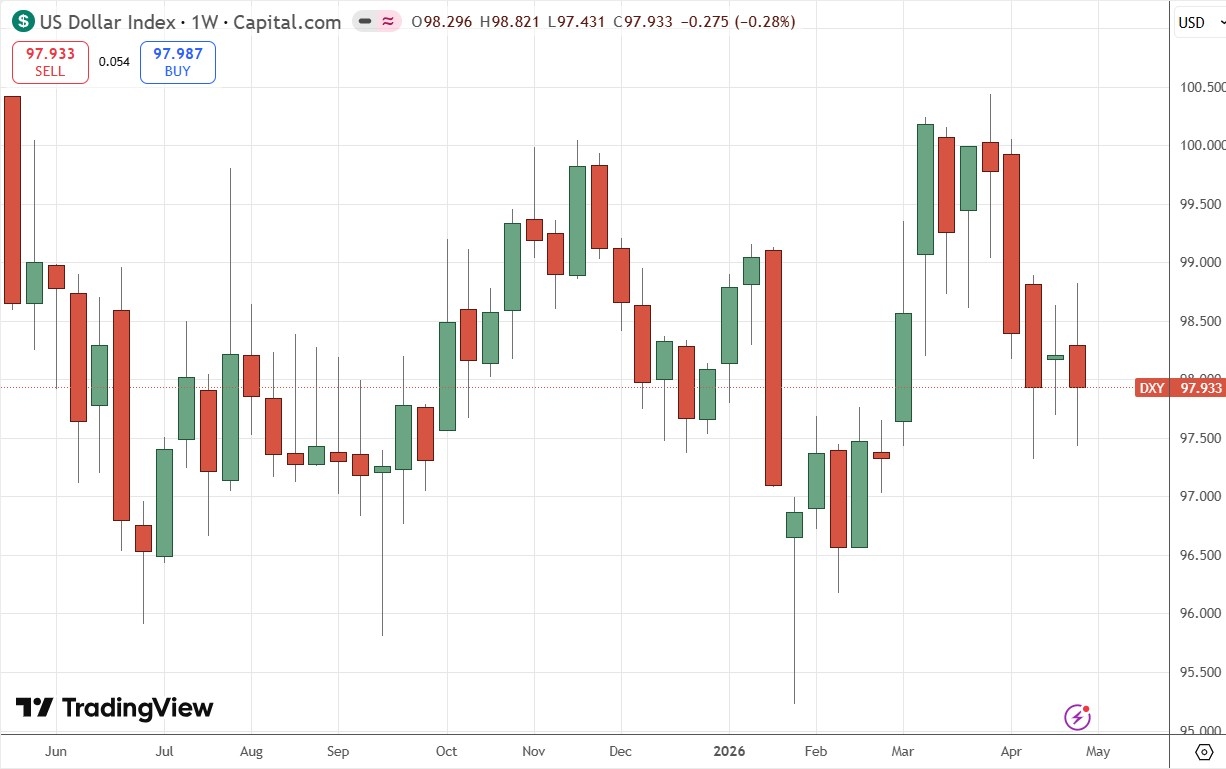
US Dollar Index Weekly Price Chart
The USD/JPY currency pair was breaking higher to reach a new long-term high price well above ¥160 when the Bank of Japan intervened on Friday. The BoJ does not want to see the Yen get any weaker, but any central bank trying to prop up their currency against the trend faces a difficult task if the market is strongly set in the opposite direction.
The Bank’s intervention ended and the rest of the day saw the Yen give up some of its gains against other currencies, but notably, not so much against the USD here.
Note how the ascending trend line drawn within the price chart below held the post-intervention low price, practically to the pip.
Despite the minor rebound and the holding trend line, I do not see the price bouncing back quicky. I think a consolidation period in this currency pair will be quite likely over the next few weeks.
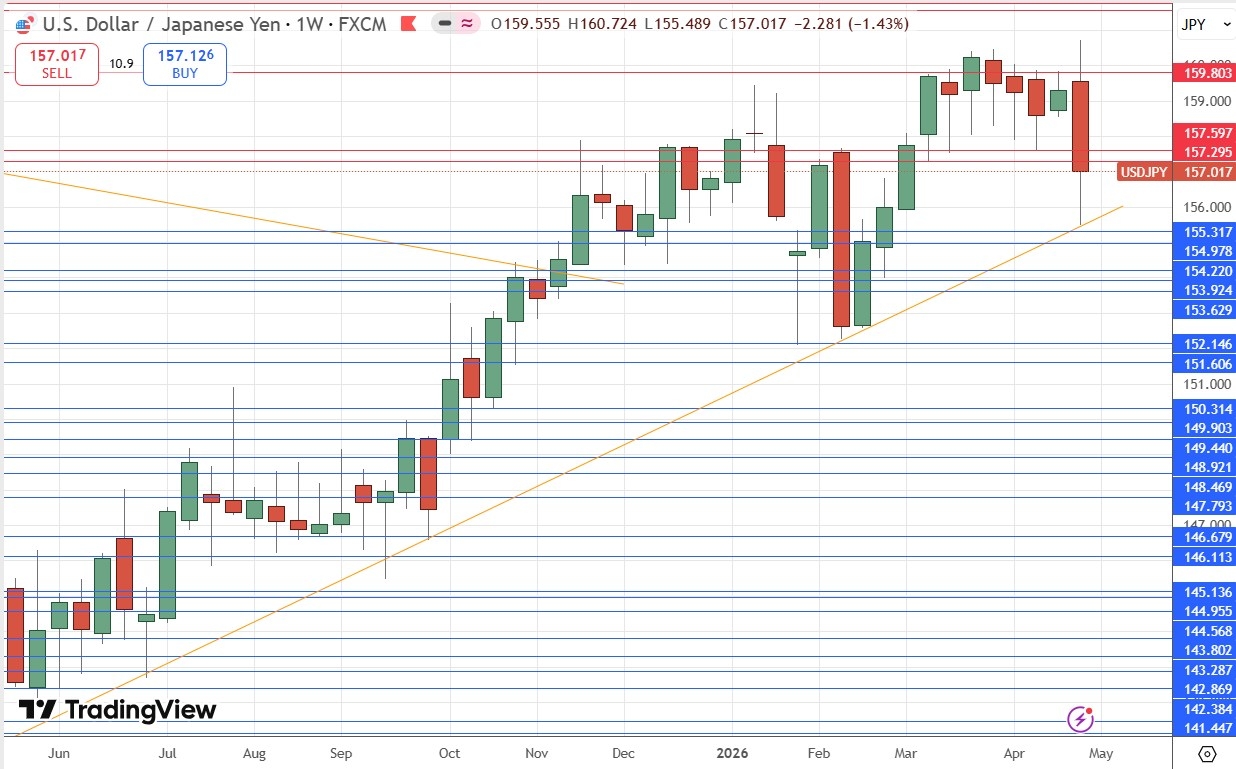
USD/JPY Weekly Price Chart
The S&P 500 Index rose again last week, as its extraordinary turnaround from its lows in late March continues. The price rose last week to trade at a new all-time high price, although it gave up some of its gains on Friday as markets turned more pessimistic about the prospect of a peace deal between the USA and Iran.
The price is rising in blue sky, so there is little reason not to be bullish, especially after a calendar month of a double-digit gain, although April wasn’t even in the top 20 months of historic gains here. It’s a great idea to be long of the US stock market when it is making new highs, but traders might want to wait for a higher daily close to show the market has moved on from Friday’s losses.
I think it will be wise to wait on the sidelines and see what the market does on Monday. If we get a daily close at the end of Monday that is higher than Friday’s closing price, a new long trade entry will look extremely tempting.
S&P 500 Index Weekly Price Chart
Everything I wrote above about the S&P 500 Index applies equally to the NASDAQ 100 Index, but the bullishness here is even stronger, with tech stocks leading the US stock market higher. As the NASDAQ 100 averages a higher return than the S&P 500 Index so if you want to be long there, you should seriously consider being long here too. It might be wise to wait for a higher daily close before entering a new long trade though.
NASDAQ 100 Index Weekly Price Chart
Brent Crude Oil rose slightly last week, with the continued closure of the Strait of Hormuz by Iran and blockade of Iran by the USA driving the price higher.
This continuation of the closure situation should continue to push prices higher, and we might see a break into new highs. The price is not far from recent highs now. I am not sure that the price will fall a great deal further even if there is a peace deal, it may take a while to do that, but it should continue to trade lower in that scenario.
If the USA began bombing Iran again, following the failure of talks, we will likely see a push into new highs.
I think as the Iran situation continues to look length and messy, with a clean resolution increasingly unlikely, long trades in energy start to look more attractive, although the Trump administration will do what it can to lower prices when they reach new highs.
I will go long here if we get a daily (New York) close above $112.50 per barrel.
If you do go long, Brent will likely be the better vehicle than WTI, as it is more exposed to events in the Strait of Hormuz.
Brent Crude Oil Futures Daily Price Chart
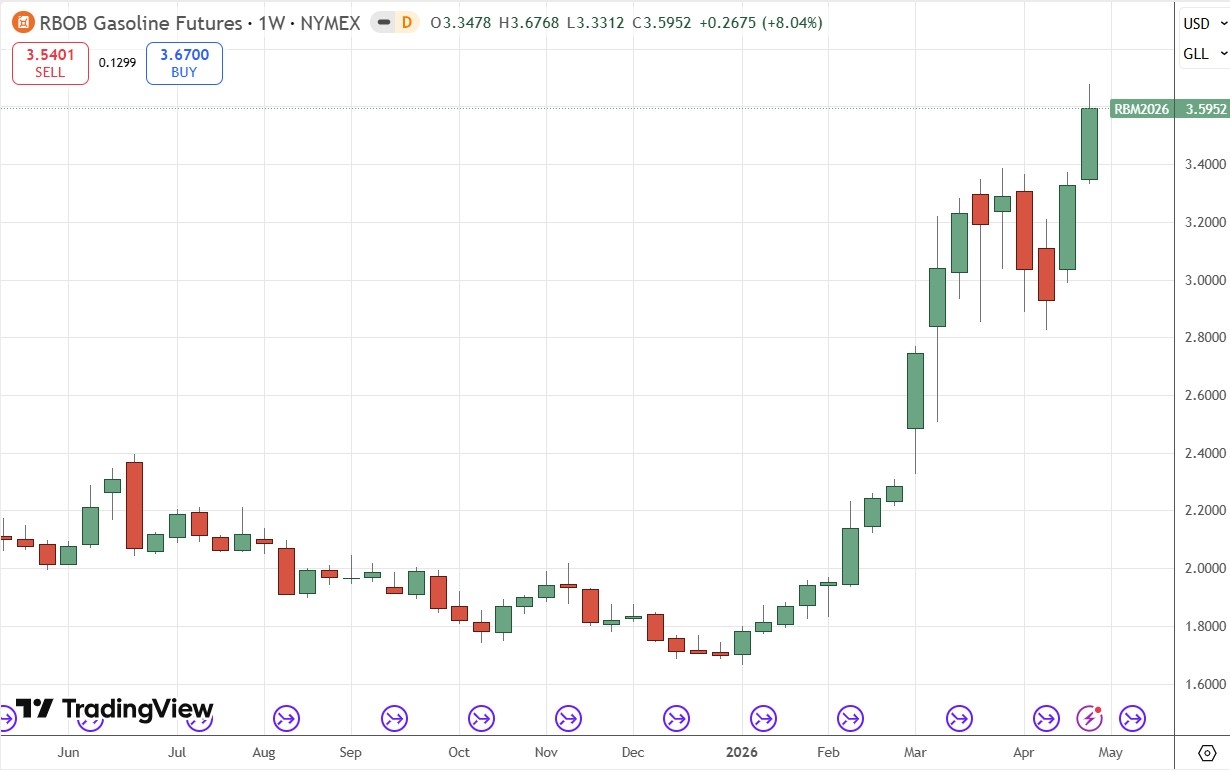
RBOB Gasoline Futures rose quite strongly last week, with the continued closure of the Strait of Hormuz by Iran driving the price higher.
Gasoline tends to lead the price of crude oil higher in this kind of crisis, and this is where we are now.
For the reasons I outlined above in my Brent Crude Oil analysis, Gasoline looks like an interesting trade on the long side. A quick resolution of the Iran / USA crisis looks decreasingly likely, so the crisis will probably run for a while longer and continue to pressure the price of Gasoline to the upside.
Gasoline futures are too large for most retail traders, so using a CFD or an ETF like UGA could be a more accessible way to get exposure.
Gasoline Futures Weekly Price Chart
I see the best trades this week as:
Long of Brent Crude Futures (or a suitable ETF) if we get a daily close above $112.50. This is extremely unlikely to set up unless there is a surprise resumption of the war.
Long of Gasoline Futures (or UGA ETF).
Long of the S&P 500 Index following a daily close above 7,230.12.
Long of the NASDAQ 500 Index following a daily close above 27,685.40.
Ready to trade our weekly Forex forecast? Check out our list of the best Forex brokers.
Exchange Rates UK Research’s latest April-May 2026 poll of major investment banks shows the pound-to-dollar exchange rate is expected to average around 1.33–1.34 in Q2 this year, below the current spot near 1.3576, with forecasts ranging widely from 1.27 on the downside to 1.40–1.45 on the upside over the longer term.
The data highlights a market where the central view points to limited near-term upside, but with a growing divergence in expectations beyond that.
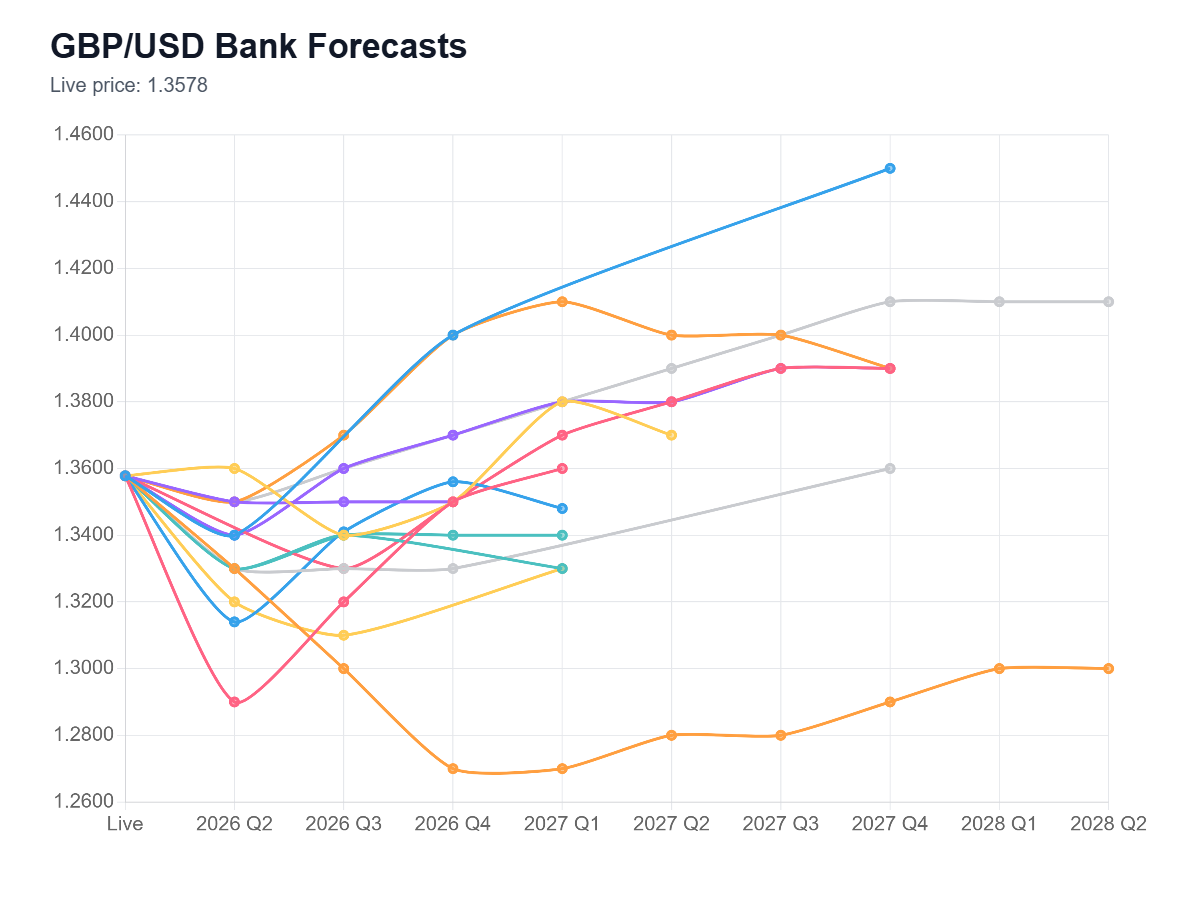
The clustering of pound sterling forecasts in the low-to-mid 1.30s suggests most banks believe GBP/USD is already trading near the upper end of its near-term range.
This follows a strong April performance, with the pair rising over 2% and briefly testing the mid-1.36s before losing momentum into early May.
Many institutions, including Goldman Sachs, ING and SEB, anchor their projections around these levels, reinforcing the idea of a broadly rangebound market.
Near-term expectations therefore point to sideways movement or a modest drift lower, rather than a sustained breakout higher.
Forecast split reflects rising macro uncertainty
While the average forecast is relatively stable, the range of projections is notably wide.
On the upside, banks such as RBC, Westpac and ABN AMRO see GBP/USD climbing back towards 1.40 and beyond over time.
On the downside, Citi and CIBC expect a move towards the high-1.20s, reflecting concerns about the UK outlook.
This divergence reflects an increasingly uncertain macro backdrop.
Geopolitical tensions, particularly the Iran conflict, have been a key driver, with shifts in oil prices and risk sentiment influencing demand for the US dollar as a safe haven.
At the same time, the Bank of England is balancing persistent inflation pressures against slowing growth, leaving policy finely poised and adding to currency volatility.
UK-specific risks are also building, with rising energy costs and weaker growth expectations weighing on sentiment towards sterling.
The latest Exchange Rates UK Research poll suggests GBP/USD is likely to remain anchored around the mid-1.30s in the near term.
However, the widening spread of forecasts indicates that this stability may not last.
With central bank policy, inflation dynamics and geopolitical risks all in flux, future moves are increasingly likely to be driven by external shocks.
For now, the consensus points to a steady range.
But the breadth of forecasts suggests the next decisive move, higher or lower, could be more significant than the average implies.
The BOJ must now determine whether it should defend the growth or the price stability. The pressure has been increasing as Japanese government bond yields are highest in decades.
The currency intervention in Japan also demonstrates the severity of the situation. The authority reportedly intervened and purchased the yen when USDJPY hit 160. According to BOJ data, it was possible that the authorities used as much as 5.48 trillion yen, or approximately $35 billion in the process. However, intervention may not be sufficient. The effect can be short-lived without raising the rates or concerted policy intervention.
The weakness of the yen is due to the fact that U.S. rates are significantly higher than Japanese rates. After the intervention, the pair returned to the area around 155. This is an indication that the policy differences between the Fed and the BOJ are wide in the market.
The threat of a second intervention is extremely high in case USDJPY returns to 160. Japan has intervened in holidays in the past, such as Golden Week in 2024. Traders are wary of history. But the intervention can only cause short term pullbacks unless the BOJ proceeds with a rate hike.
The primary trend is now based on two forces. A hike in BOJ would favor the yen and drive USDJPY down. However, a hawkish Fed may limit this move. If U.S. inflation remains strong and the oil prices are high, the USDJPY can continue to move rather than initiate a downward trend.
The daily chart for USDJPY shows constructive bullish price action during the past two years. However, the pair rejected the strong resistance at the 160 level due to intervention.
Despite this failure at 160, the pair only dropped to 155.50, which keeps the bullish trend active. As long as the pair remains above the 150 level, the overall price structure will still remain positive.
The pair can drop further during the next week, but the immediate support remains at the 154 level at the 200-day SMA. However, a recovery above 162 will indicate a strong rally in the pair, with further weakness in the Japanese yen.
Domestic coffee prices today
The domestic coffee market this morning, May 3rd, recorded a slight positive upturn after a series of days of deep downward pressure.
According to the latest updated data, the average purchase price for the entire Central Highlands region is currently anchored at the threshold of 86,500 VND/kg, a slight increase of 100 VND compared to the previous trading session.
In Dak Lak and Gia Lai provinces, the current price reached 86,500 VND/kg, while Dak Nong (old) maintained its highest position in the region at 86,600 VND/kg. Lam Dong region recorded slightly lower prices, fluctuating around the threshold of 86,000 VND/kg.
Although this increase cannot completely compensate for the decline of the past week, this is a signal that the market is making efforts to find a new balance point as the holidays gradually close.
World coffee prices
On the international front, green color returned in the closing session at the end of the week thanks to the relief effect from the decline of the USD. The Dollar Index ($DXY) falling to its lowest level in 2 weeks has triggered hedge funds to carry out a short covering wave on both futures exchanges.
Specifically, July Arabica futures price in New York has recovered by 0.85 cents (+0.30%), reaching 286.40 cents/lb.
At the same time, Robusta prices in London also slightly increased by 3 USD (+0.09%) to close the session at 3,364 USD/ton. This increase is important as it helps prices escape the lowest level in 1.5 weeks, which has been heavily burdened by pessimistic forecasts about global oversupply.
Coffee price assessment
Looking deeper into macroeconomic factors, the market is currently witnessing a fierce tug-of-war between the pressure of abundant supply in the future and the actual shortage of goods.
On the one hand, major organizations continuously release “huge” figures about Brazil’s 2026/27 crop season, with forecasts ranging from 71.4 million to nearly 76 million sacks, creating concerns about a global surplus of up to 10 million sacks.
On the other hand, Arabica inventories on the ICE exchange fell to a 2-month low (494,508 bags) and Robusta inventories also remained at a 16-month low (3,755 lots). This real tightening, combined with concerns that the Hormuz Strait continues to be closed, causing logistics and fertilizer costs to increase, is playing the role of a “protective net” preventing coffee prices from falling freely.
Besides coffee, pepper prices today still maintain heat at the threshold of 143,000 VND/kg, while the USD/VND exchange rate is stable at 26,108. Forecast for next week, when the market enters the official trading sessions of May, coffee prices are likely to continue to fluctuate strongly as investors balance the prospect of a bumper crop in Brazil and the complicated geopolitical situation that increases sea transport costs.
The Australian dollar has broken to a fresh new high against the Japanese yen during the early part of Monday, and this is one of my favorite yen-denominated pairs, as the Australian dollar has been so healthy, and the carry is pretty strong with this one. You get paid fairly well at the end of every day. I think short-term pullbacks offer buying opportunities. I don’t see why this thing doesn’t go to the 116 Yen level unless we get some type of massive shock to the system, which could happen in the Middle East. It doesn’t seem to be going that great, but as things stand right now, I like buying and holding this. I think the Aussie has some distance to cover against the Japanese yen soon.
At 8:45 a.m. Eastern Time today, oil was priced at $116.10 per barrel with Brent serving as the benchmark (we’ll explain different benchmarks later in this article). That’s a rise of $1.44 compared with yesterday morning and around $53.46 higher than the price one year ago.
It’s impossible to forecast oil prices with detailed precision. Many different elements affect the market, but ultimately it boils down to supply and demand. When worries about economic recession, war, and other large-scale disruptions increase, oil’s path can shift fast.
Gas prices at the pump don’t only track crude oil. They also include what it takes to refine and move that fuel, the taxes layered on top, and the extra markup your local station adds to stay in business.
Since crude oil generally makes up a majority of the per-gallon cost, changes in its price have an outsized impact. When oil surges, gas prices typically rise in tandem. But when oil retreats, gas prices often lag on the way down, a trend sometimes described as “rockets and feathers.”
In case of emergency, the U.S. has a store of crude oil known as the Strategic Petroleum Reserve. Its primary purpose is energy security in case of disaster (think sanctions, severe storm damage, even war). But it can also go a long way toward softening crippling price hikes during supply shocks.
It’s not a long-term answer and is more meant to provide temporary relief, assisting consumers and keeping critical parts of the economy running, like key industries, emergency services, public transportation, etc.
Both oil and natural gas are key sources of the energy we use every day. Because of this, a big change in oil prices can affect natural gas. For example, if oil prices increase, some industries may swap natural gas for some segments of their operations where possible, which increases demand for natural gas.
To gauge oil’s performance, we often turn to two benchmarks:
Between these two, Brent better represents global oil performance because it prices much of the world’s traded crude. And, it’s often the best way to track historical oil performance. In fact, even the U.S. Energy Information Administration now uses Brent as its primary reference in its Annual Energy Outlook.
Looking at the Brent benchmark across several decades, oil has been anything but steady. It’s seen spikes due to factors such as wars and supply cuts, and it’s also seen crashes from global recessions and an oversupply (called a “glut”). For example:
All to say, oil’s historical performance has been anything but smooth. Again, it’s hugely affected by wars, recessions, OPEC whims, evolving energy initiatives and policies, and much more.
Looking to stay up-to-date regarding the latest energy developments? Check out our recent coverage:
The current price of oil per barrel depends largely on supply and demand, including news about potential future supply and demand (geopolitics, decisions made by OPEC+, etc.). In the U.S., prices also move based on how friendly an administration is to drilling, as it can affect future supply. For example, 2025 saw the Trump administration move to reopen more than 1.5 million acres in the Coastal Plain of the Arctic National Wildlife Refuge for oil and gas leasing, reversing the Biden administration’s policy of limiting oil drilling in the Arctic.
The price of oil updates constantly when the “futures” markets are open. A futures market is effectively an auction where people agree to buy or sell oil in the future. As long as people and companies are trading contracts, the oil price is changing.
In short, shale is rock that contains oil and natural gas. Think of shale as energy yet to be tapped. The more shale the U.S. accesses, the more energy we’ll have—and the more easily oil prices can keep from spiking as much thanks to a greater supply.
When oil is expensive, it tends to make everyday items cost more. This can be related to energy (your heating, gas utilities, etc.), but it’s also due to the logistics involved with making those items accessible to you. Shipping, for example, can affect the price of things at the grocery store, as it’s more expensive to get those products from warehouses and farms onto the shelf.
BitcoinWorld
EUR/GBP Price Forecast Steadies Above 0.8650 as ECB and BoE Decisions Loom – Expert Analysis
The EUR/GBP price forecast remains steady above the 0.8650 mark as traders turn their attention to upcoming policy decisions from the European Central Bank (ECB) and the Bank of England (BoE). This pair, which measures the euro against the British pound, has held a narrow range for several sessions. Market participants now await clear directional signals from two of the world’s most influential central banks.
The EUR/GBP price forecast shows the pair consolidating above the key psychological level of 0.8650. This zone has acted as strong support since early March. Technical analysts point to the 50-day moving average as a critical near-term barrier near 0.8680. A break above this level could open the door toward the 0.8720 resistance area. Conversely, a drop below 0.8630 would signal a bearish shift. The Relative Strength Index (RSI) sits near 50, indicating neutral momentum. Traders watch these levels closely for breakout opportunities.
The European Central Bank’s upcoming meeting heavily influences the EUR/GBP price forecast. Market expectations lean toward a hold on interest rates. However, any hawkish commentary on inflation or growth could lift the euro. ECB President Christine Lagarde’s tone will be crucial. If she signals a potential rate cut later in the year, the euro may weaken. This would push EUR/GBP below the 0.8650 support. On the other hand, a steady stance supports the current range. Investors also monitor eurozone economic data, including GDP and PMI figures, for further clues.
The Bank of England’s policy decision adds another layer of complexity to the EUR/GBP price forecast. The BoE faces a delicate balancing act between controlling inflation and supporting a slowing economy. Analysts widely expect the BoE to hold rates at 5.25%. Any surprise move could trigger significant volatility. A dovish BoE, hinting at rate cuts, would likely weaken the pound. This scenario would push EUR/GBP higher. Conversely, a hawkish hold would strengthen the pound, pulling the pair lower. The market prices in a 60% chance of a hold, with the rest leaning toward a cut.
Beyond central bank decisions, broader macroeconomic factors shape the EUR/GBP price forecast. The UK economy faces persistent inflation, though it has eased from double-digit highs. Meanwhile, the eurozone struggles with stagnant growth. These contrasting conditions create a tug-of-war for the pair. Recent UK retail sales data showed a slight improvement, supporting the pound. However, eurozone industrial production remains weak. Traders also watch geopolitical developments, including trade tensions and energy prices. Any escalation could boost safe-haven demand for the pound, pressuring EUR/GBP lower.
From a technical perspective, the EUR/GBP price forecast hinges on several key levels. The 0.8650 support zone is reinforced by the 100-day moving average. Above it, the 0.8680–0.8700 resistance band is a major hurdle. A daily close above 0.8700 would signal a bullish breakout. Below 0.8650, the next support lies at 0.8600, followed by the 200-day moving average at 0.8570. Volume analysis shows declining activity, suggesting a potential breakout soon. The Bollinger Bands have narrowed, indicating low volatility. This often precedes a sharp move.
Market analysts offer varied views on the EUR/GBP price forecast. Jane Foley, senior FX strategist at Rabobank, notes that the pair is likely to remain range-bound until the ECB and BoE meetings. She emphasizes that any deviation from expected policy could trigger a 1–2% move. Meanwhile, ING analysts highlight the importance of wage data in the UK. Rising wages could keep inflation sticky, forcing the BoE to maintain a hawkish stance. This would favor the pound. Conversely, weaker eurozone data could push the ECB toward a more accommodative stance, weighing on the euro.
Historical data provides additional context for the EUR/GBP price forecast. The pair has shown a tendency to weaken in April, with an average decline of 0.5% over the past decade. However, this pattern is not deterministic. In 2023, EUR/GBP rose 1.2% in April. Traders should consider this alongside current fundamentals. The pair also reacts strongly to UK budget announcements and eurozone inflation releases. The upcoming UK Spring Statement could add volatility. Any fiscal surprises may shift the BoE’s policy path.
Global risk sentiment plays a role in the EUR/GBP price forecast. The pound often behaves as a risk-on currency, while the euro is more neutral. During periods of market stress, investors may sell both currencies for the US dollar. However, relative strength between the two can shift. Recent tensions in the Middle East have increased risk aversion, slightly supporting the pound. A resolution could boost the euro. Traders should monitor equity markets and bond yields for clues. A rally in global stocks typically benefits the pound more than the euro.
Interest rate differentials between the eurozone and the UK directly affect the EUR/GBP price forecast. Currently, the UK base rate stands at 5.25%, compared to the ECB’s 4.50%. This 75-basis-point gap favors the pound. However, expectations of future cuts narrow this advantage. The carry trade, where investors borrow in low-yield currencies to invest in high-yield ones, could shift. If the ECB cuts rates faster than the BoE, the euro weakens. If the BoE cuts first, the pound weakens. Forward markets price in a 50-basis-point cut from both central banks by year-end.
| Central Bank | Current Rate | Expected Year-End Rate |
|---|---|---|
| ECB | 4.50% | 4.00% |
| BoE | 5.25% | 4.75% |
The EUR/GBP price forecast remains steady above 0.8650, with the ECB and BoE decisions as the primary catalysts. Technical levels suggest a range-bound market, but any policy surprise could trigger a breakout. Traders should watch the 0.8680 resistance and 0.8630 support for directional cues. The broader macroeconomic backdrop, including inflation, growth, and risk sentiment, will also shape the pair’s trajectory. As always, staying informed and using proper risk management is essential in these uncertain times.
Q1: What is the current EUR/GBP price forecast?
The EUR/GBP price forecast shows the pair steady above 0.8650, with key support at this level and resistance near 0.8680. The market awaits ECB and BoE decisions for direction.
Q2: How does the ECB decision affect EUR/GBP?
The ECB’s policy stance directly impacts the euro. A hawkish hold supports the euro, while a dovish signal weakens it, influencing the EUR/GBP price forecast.
Q3: What are the key technical levels for EUR/GBP?
Key support levels are 0.8650, 0.8630, and 0.8600. Key resistance levels are 0.8680, 0.8700, and 0.8720. These levels guide the EUR/GBP price forecast.
Q4: Will the BoE cut rates in 2025?
Market expectations suggest a 50-basis-point cut by year-end. However, the exact timing depends on inflation and wage data. This uncertainty affects the EUR/GBP price forecast.
Q5: What is the best strategy for trading EUR/GBP now?
A range-trading strategy near 0.8650–0.8680 may work until a breakout occurs. Use stop-losses below support or above resistance. Monitor central bank news for volatility.
This post EUR/GBP Price Forecast Steadies Above 0.8650 as ECB and BoE Decisions Loom – Expert Analysis first appeared on BitcoinWorld.