The main category of All News Articles.
You can use the search box below to find what you need.
[wd_asp id=1]
The main category of All News Articles.
You can use the search box below to find what you need.
[wd_asp id=1]
Silver (XAG/USD) attracts some buyers during the Asian session on Wednesday and moves away from a one-week low, around the $75.50 region, which it touched the previous day. The white metal currently trades near mid-$77.00s, up just over 1% for the day, though the mixed technical setup warrants caution before placing aggressive directional bets.
The XAG/USD holds just above the 200-period Simple Moving Average (SMA) on the 4-hour chart but is capped by the 23.6% Fibonacci retracement of the recent goodish recovery from the $61.00 mark, or the March swing low. This leaves the near-term tone neutral to slightly bearish. The modest cushion provided by the 200-SMA suggests underlying demand on dips.
Meanwhile, the Moving Average Convergence Divergence (MACD) indicator remains below zero with a negative reading, and the Relative Strength Index (RSI) hovers near 44. Both the momentum indicators hint that recovery attempts may struggle while the XAG/USD trades under the nearby Fibonacci barrier.
A sustained strength beyond the 23.6% retracement at $77.76 should pave the way for additional gains. Further upside hurdles, however, only emerge toward the cycle high reference at $82.90. On the downside, initial support is seen at the 200-period SMA at $76.58, followed by a more substantial Fibonacci cluster at the 38.2% retracement near $74.59.
A convincing break below the latter would expose deeper supports at $72.02 and $69.46, corresponding to the 50.0% and 61.8% retracements of the broader upswing.
(The technical analysis of this story was written with the help of an AI tool.)
Silver is a precious metal highly traded among investors. It has been historically used as a store of value and a medium of exchange. Although less popular than Gold, traders may turn to Silver to diversify their investment portfolio, for its intrinsic value or as a potential hedge during high-inflation periods. Investors can buy physical Silver, in coins or in bars, or trade it through vehicles such as Exchange Traded Funds, which track its price on international markets.
Silver prices can move due to a wide range of factors. Geopolitical instability or fears of a deep recession can make Silver price escalate due to its safe-haven status, although to a lesser extent than Gold’s. As a yieldless asset, Silver tends to rise with lower interest rates. Its moves also depend on how the US Dollar (USD) behaves as the asset is priced in dollars (XAG/USD). A strong Dollar tends to keep the price of Silver at bay, whereas a weaker Dollar is likely to propel prices up. Other factors such as investment demand, mining supply – Silver is much more abundant than Gold – and recycling rates can also affect prices.
Silver is widely used in industry, particularly in sectors such as electronics or solar energy, as it has one of the highest electric conductivity of all metals – more than Copper and Gold. A surge in demand can increase prices, while a decline tends to lower them. Dynamics in the US, Chinese and Indian economies can also contribute to price swings: for the US and particularly China, their big industrial sectors use Silver in various processes; in India, consumers’ demand for the precious metal for jewellery also plays a key role in setting prices.
Silver prices tend to follow Gold’s moves. When Gold prices rise, Silver typically follows suit, as their status as safe-haven assets is similar. The Gold/Silver ratio, which shows the number of ounces of Silver needed to equal the value of one ounce of Gold, may help to determine the relative valuation between both metals. Some investors may consider a high ratio as an indicator that Silver is undervalued, or Gold is overvalued. On the contrary, a low ratio might suggest that Gold is undervalued relative to Silver.
The Dollar to Yen (USD/JPY) exchange rate held just below the 160 level, with the pair trading near multi-year highs as yen weakness persists.
Rabobank notes that the Japanese Yen is the weakest-performing G10 currency both month-to-date and year-to-date, with USD/JPY supported by yield differentials and cautious Bank of Japan policy expectations.
The bank highlights that gains beyond 160 have so far been limited by the risk of intervention from Japan’s Ministry of Finance, while uncertainty over near-term BoJ policy is also capping moves.
Rabobank expects upcoming policy decisions from both the BoJ and Federal Reserve to be key drivers, warning that the absence of a BoJ rate hike could push the pair higher.
“The absence of a rate hike from the BoJ… could propel the currency pair above 160.”
At the same time, the bank notes that expectations for tightening have become less certain, despite earlier hawkish signals from Governor Ueda, with markets now less confident about the timing of the next move.
Rabobank forecasts the Dollar to Yen exchange rate (USD/JPY) will fall to 158 within 3 months and to 152 over a 6-month horizon, assuming a more hawkish stance from the BoJ alongside an easing bias from the Federal Reserve.
The risk of intervention is expected to remain a key factor if USD/JPY moves higher, particularly near the 160 level.
“The chances of a re-test of the USD/JPY160 level will increase.”

Domestic coffee prices
The domestic coffee market this morning, April 21, recorded a booming price increase in all key growing areas of the Central Highlands.
According to actual surveys, the average purchase price throughout the region has increased by an additional 2,000 VND/kg, bringing the crude price level to the threshold of 87,400 VND/kg. Specifically, in Dak Nong province (old), coffee prices recorded the strongest increase with 2,100 VND, pushing the purchase price to the threshold of 87,600 VND/kg.
In Dak Lak and Gia Lai provinces, prices also simultaneously increased by 2,000 VND, currently trading stably at 87,300 VND/kg. Lam Dong area listed a price of 86,800 VND/kg after recovering by 2,000 VND compared to yesterday’s session. This shock increase helped the market quickly regain what it had lost after a series of gloomy days.
World coffee prices
Developments on international exchanges last night were also brilliantly green due to unexpected geopolitical fluctuations in the Middle East region. Robusta coffee prices on the London exchange for May 2026 delivery jumped up to 94 USD (equivalent to 2.77%), closing the session at 3,482 USD/ton.
At the same time, the New York exchange witnessed Arabica prices increase by an additional 2.90 cents (equivalent to 1.0%), closing at 292.20 cents/lb. The main driving force pushing prices up was information that Iran announced the closure of the Strait of Hormuz on Saturday after the US refused to lift the maritime blockade on its ships. The paralysis of the vital sea transport route immediately pushed up freight, insurance and fuel costs, forcing international roasters to step up purchases to ensure inventory.
Coffee price assessment
Regarding basic factors, the Robusta coffee line is receiving double support as inventories monitored by the ICE exchange continue to fall deeply to the lowest level in the past 16 months, leaving only 3,788 lots as of Monday. In addition, the weather situation in Brazil is also supporting the buying side when the country’s largest coffee growing region, Minas Gerais, only received rainfall equal to 20% of the historical average in the past week. However, the market’s breakthrough momentum is still somewhat restrained by the forecast of a global surplus of up to 10 million bags by StoneX in 2026 and the expectation of a record harvest of 75.9 million bags in Brazil from Marex Group. In Vietnam, the rate of coffee exports in the first quarter increased by 14% to 585,000 tons, which is also a barrier preventing Robusta prices from increasing too sharply.
It is predicted that in the coming sessions, coffee prices will continue to be strongly fluctuating around the 86,500 – 88,500 VND/kg range as the market strives to react to conflicting news about supply. If the logistics tension has not shown signs of cooling down, domestic prices have a complete opportunity to re-establish the 90,00 VND mark in the near future.
The actual prices in localities may differ depending on the quality of the seeds and actual transaction agreements.
Overall Trend: Bullish, but vulnerable to a technical correction.
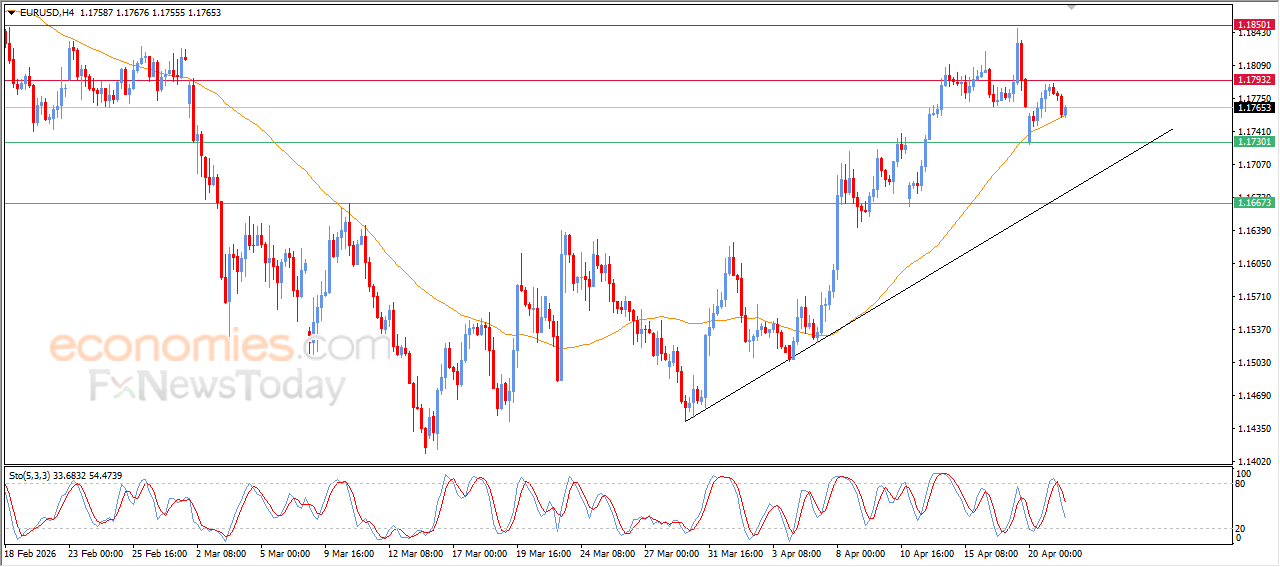
Support Levels for EUR/USD Today: 1.1755 – 1.1700 – 1.1660
Resistance Levels for EUR/USD Today: : 1.1800 – 1.1870 – 1.1910

With renewed investor risk aversion amid a clear stalemate in ending the Iran conflict—which could lead to the closure of the Strait of Hormuz, rising global crude oil prices, and increased inflationary pressures—the Euro has faced negative headwinds. The EUR/USD pair has returned to selling pressure, stabilizing around the 1.1774 support at the time of writing. This is a slight improvement from the losses seen at the start of the trading week when it plummeted to the 1.1727 support level.
According to data from top trading firms, the Euro exchange rate against the Dollar may head toward testing the 1.16 support level again. However, curbing the appetite for buying remains difficult. The Dollar is rising as the new week begins, which could push the Euro back to levels seen on March 3rd near the 1.16 support.
Generally, US Dollar gains are fueled by fears that the imminent ceasefire between the US and Iran may not be renewed this Tuesday, especially following the events of the last 24 hours involving the US seizure of an Iranian vessel.
Consequently, it is too early to confirm a total collapse of the situation. We believe the Euro’s decline against the Dollar will be limited by trader confidence that both the US and Iran are seeking a deal and will eventually reach one. President Trump has a history of announcing agreements at the final moment before a deadline, and there is no reason to believe this won’t happen today.
From a technical perspective, the worst-case scenario for the next 24 hours is the failure to renew the ceasefire and a resumption of hostilities. This would increase demand for the dollar as a safe haven and raise concerns about the outlook for the Eurozone economy.
If this occurs, the EUR/USD exchange rate could fall to the 1.16 support level, which is the 200-day moving average. However, this level remains significantly higher than the crisis lows seen in early March, suggesting that the foreign exchange market anticipates an eventual new ceasefire agreement, followed by the eventual reopening of the Strait of Hormuz.
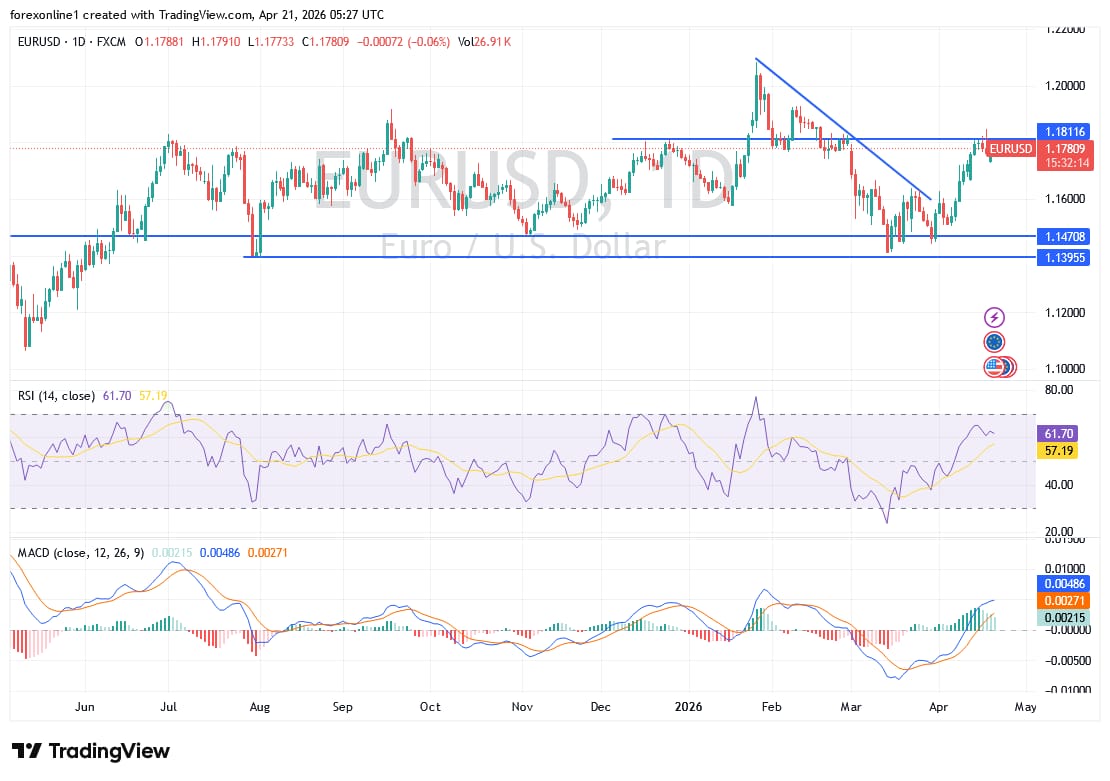
On the daily chart, the 14-day Relative Strength Index (RSI) is holding steady around 61, indicating continued positive momentum, albeit at a weaker pace. While the MACD remains in positive territory, current signs of slowing suggest a potential continuation of the downward correction before the upward trend resumes. Moving averages continue to indicate greater buying pressure.
A stronger bullish scenario requires a move towards the resistance levels of 1.1850, followed by the psychological resistance level of 1.2000.
Based on fundamental analysis, the EUR/USD pair will react today to the release of the German ZEW Consumer Sentiment Index at 11:00 AM Egypt time, followed by the release of US retail sales figures at 2:30 PM Egypt time. Then, important statements from US President Trump and the Federal Reserve member nominated to succeed Jerome Powell.
Conclusion: The medium-term trend for EUR/USD remains tilted toward the positive. However, short-term bullish momentum is losing steam as prices fail to stabilize above the 1.1800 resistance level.
Dear TradersUp trader, we still prefer selling the Euro against the US Dollar on every strong upward rebound. Avoid excessive risk, monitor the factors influencing the currency pair, and ensure Take-Profit and Stop-Loss orders are active to manage expected price volatility.
Ready to trade our daily Forex analysis? We’ve made this forex brokers list for you to check out.

Oil and gas prices moved lower as traders reacted to expected US-Iran talks and the possibility of more oil supply entering the market. Warmer weather forecasts in Europe also reduced gas demand, which pushed prices down. However, supply risks remain due to shipping limits in the Strait of Hormuz, Russian export disruptions, and falling inventories. Because of these mixed signals, prices may either fall further if supply improves or rise again if disruptions continue.
Oil prices dropped mainly because markets believe talks between the United States and Iran could restart and lead to more oil supply. Gas prices also fell because warmer temperatures reduced heating demand across Europe. Strong wind power generation also lowered gas consumption. These factors reduced short-term demand and improved supply expectations, which pressured prices.
Prices could move in either direction. If talks succeed and supply increases, Brent, WTI, and European gas prices may remain lower. If shipping disruptions continue or new supply problems emerge, prices could rise quickly. Investors are watching inventory data, export trends, and geopolitical developments to understand the next price direction.
Oil prices dropped on Tuesday after rising strongly the day before. Brent crude futures fell by 69 cents to $94.79 per barrel. US West Texas Intermediate for May fell by $1.12 to $88.49. The June WTI contract fell to $90.27.
Prices had surged earlier after Iran shut the Strait of Hormuz and the United States seized an Iranian cargo ship as part of a ports blockade. The Strait of Hormuz carries about one fifth of global oil supply. This made markets fear supply shortages.
Now traders expect peace talks between the United States and Iran. Markets believe talks could extend the ceasefire or reach an agreement. According to analyst Tamas Varga, markets expect progress before the ceasefire expires. However, uncertainty remains. Iranian Foreign Minister Abbas Araqchi said violations of the ceasefire make negotiations difficult. Iran has not confirmed participation in talks.
Shipping through the Strait of Hormuz remains limited. This route carries a large share of global oil exports. Even a short disruption can affect prices. EU Energy Commissioner Dan Jorgensen warned Europe could face a difficult summer due to fuel shortages. Analysts at Citi said that if disruptions continue for another month, global oil losses could reach 1.3 billion barrels. In that case, prices could reach $110 in the second quarter.
Another factor affecting oil prices is the ongoing fire at Russia’s Tuapse Black Sea port after a Ukrainian drone attack. The port is an oil export hub and home to a refinery owned by Rosneft. Russia is also expected to stop oil exports from Kazakhstan to Germany through the Druzhba pipeline starting May 1. This adds more uncertainty about future supply.
Markets are also waiting for the US Energy Information Administration weekly oil report. The previous report showed crude stocks, gasoline, and distillate inventories fell as imports declined and exports increased. Analysts say rising US exports could support prices again because supply remains tight in Europe and Asia.
Dutch and British gas prices dropped on Tuesday morning. Traders reacted to warmer temperature forecasts and expected lower heating demand. The Dutch front-month contract at the TTF hub fell by 0.86 euros to 839.44 euros per megawatt hour. The British contract fell by 2.45 pence to 98.86 pence per therm.
Analysts at Engie EnergyScan said warmer weather and strong wind power generation reduced demand. Forecasts show temperatures will stay higher across Western Europe for the next two weeks.
Heating demand is expected to fall significantly. Local distribution zone demand could drop by 36 gigawatt hours per day. Weekend demand could fall by 48 gigawatt hours per day. Demand for working days next week could drop by 176 gigawatt hours per day.
European gas storage sites are 30.4% full. Last year at the same time, storage levels were about 36.7%. Lower storage means Europe remains vulnerable if supply disruptions continue. The European carbon market also fell slightly, with benchmark carbon contracts down to 75.66 euros per metric ton.
Oil prices could rise again if disruptions continue. Markets are balancing two forces. One force is the expectation of peace talks and new supply. The other is the risk of supply disruptions and rising exports. If talks fail or shipping remains disrupted, prices could rise quickly. If talks succeed and supply increases, prices could fall further.
Analysts say the market is driven by uncertainty. Investors are watching diplomacy, supply flows, and demand forecasts.
Key drivers include:
These factors will shape price direction in the coming weeks.
Investors face a volatile market. Short-term price swings may continue. Traders are waiting for clarity on negotiations and supply. Many analysts suggest monitoring geopolitical developments and inventory reports closely. Energy markets remain sensitive to new headlines and policy changes.
Q1. Why are oil and gas prices down today?
Prices fell because markets expect US-Iran talks to increase supply. Warm weather reduced European gas demand. Investors are waiting for inventory data and geopolitical developments before taking new positions.
Q2. Will Brent, WTI crude, and European gas prices rise again soon?
Prices could rise if supply disruptions continue or talks fail. If negotiations succeed and supply increases, prices may remain lower. Markets remain sensitive to geopolitical news and demand changes.
Join me for my weekly trading plan with this week’s forex analysis covering:
DXY, EUR/USD, GBP/USD, USD/JPY, USD/CAD, USD/CHF, AUD/USD, NZD/USD.
AUD/JPY, CHF/JPY, AUD/CAD, GBP/CAD, EUR/NZD, EUR/AUD.
Bitcoin analysis – BTC/USD.
Ethereum analysis – ETH/USD.
Gold analysis – XAU/USD.
Silver analysis – XAG/USD.
Crude Oil analysis – WTI.
The GBPAUD remains affected by the negative factors that are represented by the continuation of forming main resistance at 1.9545 level, besides the unionism of providing negative momentum by the main indicators, to notice resuming the negative movement to settle near 1.8860.
Forming extra barrier at 1.9090 level and providing negative momentum will reinforce the chances of resuming the bearish trend, to reach 1.8745 level, to repeat the pressure at 1.8675.
The expected trading range for today is between 1.8745 and 1.8900
Trend forecast: Bearish
– Written by
Frank Davies
STORY LINK Pound Sterling to Dollar Forecast: Iran Uncertainty, Data Risks Dominate Outlook
The Pound to Dollar exchange rate (GBP/USD) has slipped back below 1.3500, after failing to hold gains near 1.36, as renewed Iran tensions triggered a fresh spike in oil prices and hit risk appetite.
With markets swinging between optimism and fear, GBP/USD is set for a highly volatile week, with geopolitical developments, UK data releases, and central bank signals all in focus.
Hope and Fear have continued to trade blows in global markets. There was a strong boost to risk appetite on Friday following a statement from Iran that the Strait of Hormuz was open to all traffic.
In response, the Pound to Dollar (GBP/USD) exchange rate jumped to 2-month highs just below the 1.36 level as oil prices declined sharply.
GBP/USD, however, dipped to lows below 1.3500 on Monday as the Iran situation deteriorated again. In response, there was a fresh jump in crude oil prices and equity markets dipped again.
According to UoB; “The increase in downward momentum is not enough to indicate a continued decline. However, there is a chance for GBP to test 1.3450.”
Get better rates and lower fees on your next international money transfer.
Compare TorFX with top UK banks in seconds and see how much you could save.
Iran developments and UK data releases will be crucial elements this week with UK political developments also watched closely with Prime Minister Starmer under renewed pressure due to the Mandelson affair.
According to Danske Bank; “The market is likely to stay volatile this week as US and Iran will try to negotiate a deal.”
ING added; “In terms of the immediate focus, the question is whether investors will receive further positive news on renewed peace talks in Pakistan, or whether both sides will talk tough and potentially act tougher ahead of tomorrow’s deadline on the two-week ceasefire.”
Danske Bank noted the importance of energy flows; “If oil does not start flowing through the strait soon, oil prices are likely to rise further and above USD100/bbl again, putting upward pressure on yields and downward pressure on EUR/USD.” This would be likely to hurt GBP/USD.
The evidence on US, global and UK economic trends will also be important this week.
There will be a greater focus on potential US interest rate trends with Fed Chair nominee Warsh due to testify in Congress.
ING commented; “He is expected to be dovish on rates, but hawkish on the size of the Fed’s balance sheet.” Calls for lower rates would tend to hamper the dollar.

As far as UK data is concerned, the latest labour-market data will be released on Tuesday with the inflation data on Wednesday. The headline rate is forecast to increase to 3.3% from 3.0% with the core rate holding at 3.2%.
The latest PMI business confidence data is due on Thursday with expectations that there will be a small decline from March figures. A dip into contraction territory would be likely to hurt the Pound.
International Money Transfer? Ask our resident FX expert a money transfer question or try John’s new, free, no-obligation personal service! ,where he helps every step of the way,
ensuring you get the best exchange rates on your currency requirements.
TAGS: Pound Dollar Forecasts
Copper price remains affected by the temporary negative pressures that comes from stochastic exit from the overbought level, which forced it to provide extra pressure on the initial support at $5.9700 as appears in the above image.
The continuation of the negative pressures might force it to activate the bearish corrective track, to expect targeting $5.8200 level, to begin forming new bullish waves, while surpassing $5.8200 level and holding below it might motivate more of the bearish attempts, which might extend towards $5.7100.
The expected trading range for today is between $5.8200 and $6.050
Trend forecast: Fluctuated within the bullish trend


![Weekly forex forecast: EUR/USD, XAU/USD, DXY, GBP/USD, Bitcoin and more [Video]](https://editorial.fxsstatic.com/images/i/bitcoin-explodes-01_Medium.jpg "Weekly forex forecast: EUR/USD, XAU/USD, DXY, GBP/USD, Bitcoin and more [Video]")