The main category of All News Articles.
You can use the search box below to find what you need.
[wd_asp id=1]
The main category of All News Articles.
You can use the search box below to find what you need.
[wd_asp id=1]
Domestic coffee prices
The domestic coffee market this morning (March 27) recorded a downward adjustment, pushing prices away from the support level of 93,000 VND/kg. Agents in the Central Highlands region simultaneously reduced purchase prices from 500 – 700 VND/kg, causing the average price level of the whole region to fall back to 92,600 VND/kg.
Detailed changes in key localities:
Dak Nong (old): Reduced by 500 VND, currently purchased at 92,700 VND/kg.
Dak Lak and Gia Lai: Both adjusted down sharply by 700 VND, currently fluctuating around the threshold of 92,500 VND/kg.
Lam Dong: Recorded price of 91,700 VND/kg after a decrease of 500 VND compared to the previous session.
Although it has decreased significantly compared to the high of 96,900 VND recorded at the end of February, the current price base is still trying to accumulate in the face of negative fluctuations from the international futures exchange.
World coffee prices
Thursday’s trading session witnessed a simultaneous decline on both exchanges due to the prospect of abundant supply from South America.
New York Stock Exchange (Arabica): May 2026 futures fell sharply by 8.45 cents (-2.67%), closing at 307.65 cents/lb. Selling pressure exploded after Marex Group Plc forecast Brazil’s 2026/27 crop output to reach a record 75.9 million sacks (up 15.5% y/y), exceeding all previous forecasts from Sucafina and StoneX. Arabica’s ICE inventory hitting a 6-month peak (585.621 sacks) also stalled the increase.
London Stock Exchange (Robusta): May 2026 futures fell 33 USD (-0.91%), closing the session at 3,596 USD/ton. Robusta’s decline was somewhat curbed thanks to ICE floor inventories continuing to fall to a 2.5-month low (only 4,173 lots). However, Vietnam’s export data for the first 2 months of the year increased by 14% (reaching 366,000 tons) is still a major barrier.
Market outlook
The coffee market is entering a sensitive phase as forecasts for record crops in Brazil are continuously released. The closure of the Strait of Hormuz, which disrupted sea transport, is still a cost-supporting factor, but not enough to cope with long-term oversupply pressure. Although Brazilian farmers are limiting sales to wait for higher prices, the prospect of a bumper crop of 75.9 million bags is causing speculators to worry.
It is forecasted that in the last sessions of the week, coffee prices will continue to fluctuate strongly around the area of 91,500 – 93,000 VND/kg. Developments in Brazil when low rainfall in Minas Gerais (only reaching 45% of the historical average) may be the only factor helping prices have technical recovery.
The actual price may differ depending on the quality and purchasing area.
LONDON, March 2025 – The EUR/GBP currency pair faces significant upside pressure as the Bank of England unexpectedly reprices its monetary policy stance toward dovish territory, according to fresh analysis from ING’s global financial research team. This development marks a pivotal shift in cross-channel currency dynamics, potentially reshaping trading strategies and economic forecasts for the remainder of 2025. Market participants now closely monitor this evolving situation, particularly as European Central Bank policy diverges from its British counterpart.
ING’s currency strategists identify multiple converging factors driving potential EUR/GBP appreciation. Firstly, the Bank of England’s recent communications indicate reduced hawkishness compared to previous quarters. Consequently, interest rate differential expectations between the Eurozone and United Kingdom are narrowing. Meanwhile, economic data from both regions shows diverging trajectories, with European recovery gaining momentum as British growth faces headwinds.
Technical analysis reveals the currency pair testing key resistance levels. Specifically, the 0.8600 level represents a critical psychological barrier. Additionally, moving average convergence suggests bullish momentum may be building. Historical volatility patterns indicate potential breakout conditions, especially when combined with fundamental policy shifts. Market positioning data further supports this view, showing reduced speculative short positions on the euro against sterling.
The Bank of England’s dovish pivot stems from several economic developments. Inflation metrics have shown consistent improvement throughout early 2025, falling closer to the central bank’s 2% target. Simultaneously, labor market indicators reveal softening conditions, with unemployment edging higher and wage growth moderating. These factors collectively reduce pressure for additional monetary tightening.
Monetary Policy Committee communications reflect this changing outlook. Recent meeting minutes emphasize increased data dependency and reduced forward guidance certainty. Market participants now price in fewer rate hikes than previously anticipated. Furthermore, terminal rate expectations have declined by approximately 25 basis points since December 2024. This repricing directly impacts currency valuation models, particularly for sterling crosses.
The European Central Bank maintains a comparatively more hawkish stance. Recent ECB communications emphasize persistent inflation concerns in services sectors. Additionally, Eurozone economic resilience continues to surprise analysts, supporting tighter policy maintenance. This policy divergence creates favorable conditions for euro appreciation against currencies experiencing dovish shifts.
Historical analysis reveals similar patterns during previous policy divergence episodes. Typically, currency pairs respond strongly to relative central bank positioning changes. The current EUR/GBP situation mirrors 2017 dynamics when BoE dovishness preceded significant pair appreciation. However, each episode contains unique characteristics requiring careful analysis.
Eurozone economic indicators show surprising resilience. Manufacturing PMI data has stabilized above contraction levels since January 2025. Meanwhile, services sector activity continues expanding, supported by strong consumer spending. Energy price normalization provides additional support, reducing imported inflation pressures and improving trade balances.
Structural factors also favor euro stability. The European Union’s NextGenerationEU implementation progresses steadily, supporting investment across member states. Furthermore, banking sector strength has improved significantly since 2023 stress tests. These developments contrast with British economic challenges, creating fundamental support for EUR/GBP appreciation.
British economic data reveals mounting difficulties. Consumer confidence indicators remain depressed despite fiscal support measures. Additionally, business investment shows hesitation amid political uncertainty and trade relationship questions. Housing market activity has slowed considerably, impacting related economic sectors and consumer wealth effects.
Productivity growth continues disappointing analysts, limiting potential output expansion. Brexit-related trade frictions persist, though adaptation continues. These factors collectively pressure the Bank of England toward accommodative policy, particularly as inflation moderates. The resulting monetary policy environment creates sterling vulnerability against major counterparts.
Currency market participants must adjust positioning accordingly. ING analysts recommend monitoring several key indicators. Firstly, Bank of England voting patterns provide crucial policy direction signals. Secondly, inflation expectation metrics influence medium-term policy trajectories. Thirdly, economic growth differentials between regions determine fundamental support levels.
Risk management considerations become particularly important during policy transition periods. Volatility typically increases as markets digest new information and adjust expectations. Position sizing should account for this elevated uncertainty. Additionally, correlation patterns may shift, requiring portfolio rebalancing across currency exposures.
Key technical levels to watch include:
Previous Bank of England policy shifts provide valuable context. The 2016 post-Brexit dovish pivot saw EUR/GBP appreciate approximately 15% over six months. Similarly, the 2020 pandemic response created significant currency pair volatility. However, current conditions differ meaningfully from these episodes, requiring nuanced interpretation.
Central bank communication analysis reveals evolving patterns. Modern monetary authorities increasingly emphasize forward guidance and data dependency. This approach potentially reduces extreme market reactions but extends adjustment periods. Understanding these communication frameworks helps anticipate policy trajectory changes and currency impacts.
Financial institution research shows growing consensus around EUR/GBP upside potential. Multiple major banks have revised forecasts upward since February 2025. However, disagreement persists regarding magnitude and timing. Some analysts emphasize technical resistance levels, while others focus on fundamental divergences.
ING’s analysis incorporates proprietary models and historical pattern recognition. Their team emphasizes risk-adjusted positioning rather than directional certainty. This approach acknowledges multiple possible outcomes while identifying highest-probability scenarios. Such balanced analysis proves particularly valuable during policy transition periods.
The EUR/GBP currency pair faces meaningful upside risks as Bank of England policy reprices dovishly. ING’s analysis identifies converging technical and fundamental factors supporting appreciation potential. Market participants should monitor evolving economic data and central bank communications closely. Additionally, risk management remains crucial during this policy transition period. The EUR/GBP forecast consequently reflects increased bullish potential, though volatility may accompany directional moves.
Q1: What does “dovish repricing” mean for the Bank of England?
The Bank of England’s dovish repricing indicates reduced expectations for interest rate increases. Markets now anticipate fewer hikes and potentially earlier rate cuts than previously expected.
Q2: How does Bank of England policy affect EUR/GBP exchange rates?
Dovish Bank of England policy typically weakens sterling against the euro. Lower interest rate expectations reduce foreign investment attractiveness, decreasing demand for British currency.
Q3: What economic indicators most influence EUR/GBP movements?
Inflation data, growth differentials, and central bank communications most significantly impact the currency pair. Employment figures and trade balances also contribute to fundamental valuation.
Q4: How reliable are currency forecasts during policy transitions?
Forecast reliability decreases during policy transitions due to elevated uncertainty. Analysts emphasize probability ranges rather than precise predictions during such periods.
Q5: What time horizon does ING’s EUR/GBP analysis cover?
ING’s analysis typically covers three to twelve-month horizons. Short-term technical factors and long-term fundamentals receive balanced consideration in their comprehensive approach.
Disclaimer: The information provided is not trading advice, Bitcoinworld.co.in holds no liability for any investments made based on the information provided on this page. We strongly recommend independent research and/or consultation with a qualified professional before making any investment decisions.
The article covers the following subjects:
Consider long positions from corrections above 83.45 with a target of 126.00–150.00.
Breakout and consolidation below 83.45 will allow the asset to continue declining to the levels of 65.00–55.00.
A descending correction appears to have formed as the second wave of larger degree (2) on the weekly chart, with wave C of (2) completed as its part. On the daily time frame, the ascending third wave (3) has started unfolding, with the first wave of smaller degree 1 of (3) developing as its part. On the H4 chart, a bearish correction has likely finished developing as wave iv of 1 and wave v of 1 is currently forming. Within it, wave (iii) of v has started unfolding. If the presumption is correct, WTI will continue to rise to the levels of 126.00–150.00. The level of 83.45 is critical in this scenario as a breakout below it will enable the asset to continue declining to the levels of 65.00–55.00.
This forecast is based on the Elliott Wave Theory. When developing trading strategies, it is essential to consider fundamental factors, as the market situation can change at any time.
The content of this article reflects the author’s opinion and does not necessarily reflect the official position of LiteFinance broker. The material published on this page is provided for informational purposes only and should not be considered as the provision of investment advice for the purposes of Directive 2014/65/EU.
According to copyright law, this article is considered intellectual property, which includes a prohibition on copying and distributing it without consent.
The article covers the following subjects:
Consider long positions from corrections above the level of 1.3207 with a target of 1.3870–1.4300.
Breakout and consolidation below 1.3207 will allow the pair to continue declining to the levels of 1.3000–1.2700.
On the weekly time frame, an ascending wave of larger degree (A) of B is developing. Within it, wave 1 of (A) has formed, and a downward correction has been completed as wave 2 of (A). The third wave 3 of (A) appears to continue forming on the daily chart, with wave iii of 3 developing as its part. The third wave of smaller degree (iii) of iii has likely started developing on the H4 chart, with wave i of (iii) formed as its part. If the presumption is correct, GBP/USD will continue to rise to the levels of 1.3870–1.4300. The level of 1.3207 is critical in this scenario as a breakout below it will enable the pair to continue declining to the levels of 1.3000–1.2700.
This forecast is based on the Elliott Wave Theory. When developing trading strategies, it is essential to consider fundamental factors, as the market situation can change at any time.
The content of this article reflects the author’s opinion and does not necessarily reflect the official position of LiteFinance broker. The material published on this page is provided for informational purposes only and should not be considered as the provision of investment advice for the purposes of Directive 2014/65/EU.
According to copyright law, this article is considered intellectual property, which includes a prohibition on copying and distributing it without consent.
The GBPJPY pair didn’t move anything since yesterday, due to the continuation of forming a strong obstacle at 213.30 level against resuming the bullish scenario, holding is sideways range near 212.90 level.
Confirming that breaching the obstacle and holding above it is important, to reinforce the chances of reaching extra positive stations that are located near 214.05 and 215.20, while the failure of the breach might push it to form corrective trading, which forces it to suffer some losses by reaching 212.35 followed by the main bullish channel’s support at 211.80.
The expected trading range for today is between 212.35 and 214.05
Trend forecast: Sideways until achieving the breach
The USD/JPY pair turns positive for the fourth straight day following an intraday dip to the 159.45 area and touches a fresh high since July 2024 during the early European session on Friday. Given that Japan depends mostly on oil imports from the Middle East, the ongoing Iran war has been fueling worries that Japan’s economy will come under substantial strain in the foreseeable future. This, in turn, continues to undermine the Japanese Yen (JPY), which, along with the emergence of some US Dollar (USD) buying, acts as a tailwind for the currency pair. However, intervention fears might hold back the JPY bears from placing fresh bets and cap any further upside for spot prices.
The JPY hovers around the key 160 psychological mark against the USD, a key threshold level at which authorities stepped into the currency market multiple times in 2024. Moreover, Japan’s Finance Minister Satsuki Katayama has signaled that authorities are ready to take “bold” and “decisive” steps against excessive volatility in the currency market. The market implication, however, has been limited amid contrasting headlines over peace talks to end the war in the Middle East. Furthermore, supply disruptions caused by the effective closure of the Strait of Hormuz remain supportive of elevated energy prices, which could worsen Japan’s trade balance and weaken its economic outlook.
Despite US President Donald Trump’s ceasefire rhetoric, comments from Iranian officials dampen hopes for an immediate de-escalation of tensions. Meanwhile, Trump announced that he will delay strikes on Iran’s energy infrastructure and extended the deadline to reopen the Strait of Hormuz until April 6. Investors, however, remain worried about a further escalation of the conflict amid the deployment of additional US troops in the region. This keeps geopolitical risks in play, which, along with bets for an interest rate hike by the US Federal Reserve (Fed), lifts the USD closer to the weekly high. The fundamental backdrop, in turn, backs the case for a further USD/JPY appreciation.
Against the backdrop of the recent rebounds from the critical 200-day Exponential Moving Average (EMA), a sustained move and acceptance above the 160.00 mark will be seen as a fresh trigger for bullish traders. The Relative Strength Index hovers around 61, staying in bullish territory without overbought conditions, which signals ongoing buying pressure but reduced urgency to extend the rally aggressively.
However, the Moving Average Convergence Divergence (MACD) line has flattened just above the zero line with only a slight positive edge over its signal line, suggesting waning but still positive momentum. Hence, it will be prudent to wait for some follow-through buying before positioning for further gains towards the next relevant hurdle near the 160.50 region en route to the 161.00 round-figure mark.
On the downside, initial support emerges at 158.50, followed by firmer demand near 157.70, the prior breakout area. A daily close below 157.70 would weaken the bullish structure and expose the 156.20 consolidation zone, well above the 200-day EMA. As long as the USD/JPY pair remains above 158.50, dips are more consistent with consolidation inside an ongoing uptrend rather than a completed top.
(The technical analysis of this story was written with the help of an AI tool.)
The GBPAUD confirmed the continuation of the bullish corrective scenario by moving way from the main support at 1.8675, achieving several gains by its rally towards 1.9270, taking advantage of the continuation of providing positive momentum by stochastic in the previous period.
Forming extra support at 1.9060 level will increase the efficiency of the bullish corrective track, to keep waiting for attacking 1.9310 level, and surpassing it will open the way for recording extra gains that might begin at 1.9400 reaching 1.9515.
The expected trading range for today is between 1.9155 and 1.9310
Trend forecast: Bullish
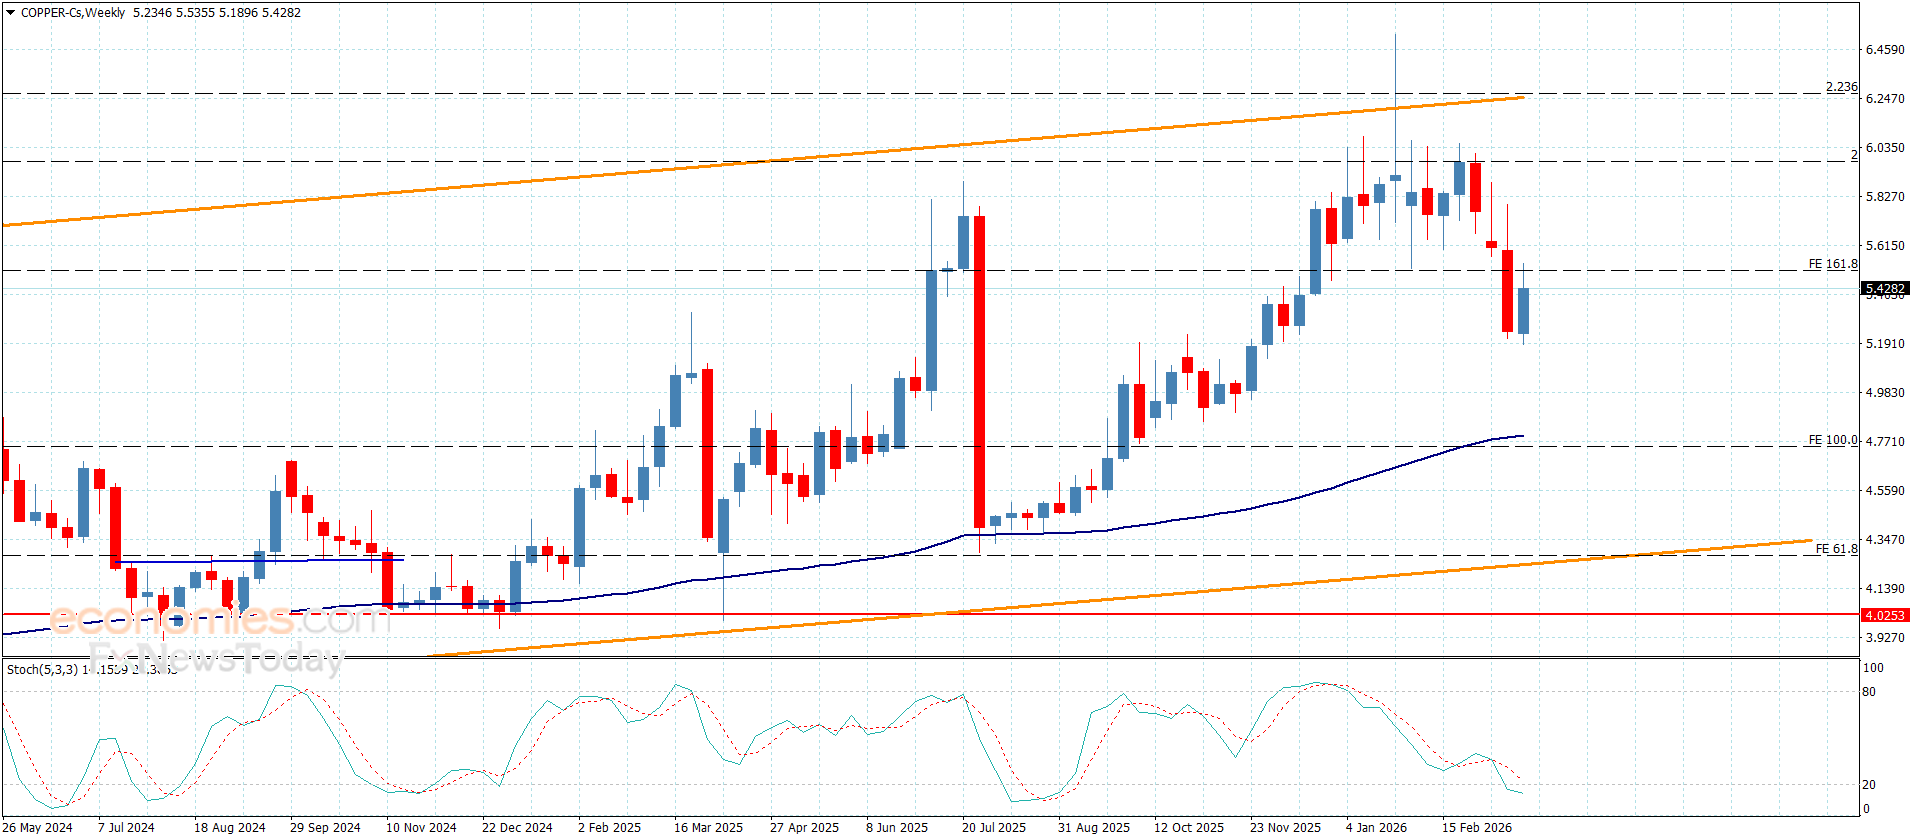
Copper price stayed below $5.5100, maintaining its negative stance and increasing the likelihood of forming short-term corrective downward waves. Since yesterday, the price has been fluctuating near $5.4200, affected by the ongoing divergence in key indicators, particularly the moving average 55 positioned above current trading levels.
It is important for the price to gather bearish momentum during today’s sessions, which would facilitate targeting first $5.2700, followed by the next key support near $4.9500. However, a strong push above $5.5100 with a positive close would cancel this bearish outlook and give the price a chance to start recovering, potentially moving first toward $5.6300.
The expected trading range for today is between $5.2700 and $5.5100
Trend forecast: Bearish
Copper price stayed below $5.5100, maintaining its negative stance and increasing the likelihood of forming short-term corrective downward waves. Since yesterday, the price has been fluctuating near $5.4200, affected by the ongoing divergence in key indicators, particularly the moving average 55 positioned above current trading levels.
It is important for the price to gather bearish momentum during today’s sessions, which would facilitate targeting first $5.2700, followed by the next key support near $4.9500. However, a strong push above $5.5100 with a positive close would cancel this bearish outlook and give the price a chance to start recovering, potentially moving first toward $5.6300.
The expected trading range for today is between $5.2700 and $5.5100
Trend forecast: Bearish
– Written by
David Woodsmith
STORY LINK GBP/USD Forecast: Pound Sterling Choppy as Iran Talk Uncertainty Persists
The Pound US Dollar (GBP/USD) exchange rate moved without a clear trajectory on Thursday, amid uncertainty around US-Iran peace negotiations.
At the time of writing, GBP/USD was trading at $1.3364, having wavered throughout the session.
The US Dollar experienced uneven movement, rising early in the session before giving back those gains, as uncertainty surrounding potential US-Iran peace talks clouded market sentiment.
Earlier in the week, US President Donald Trump suggested that discussions were underway to bring an end to the conflict, a claim swiftly dismissed by Tehran.
Since then, reports have remained mixed, with speculation ranging from informal contact to the possibility of structured negotiations taking place in the coming days.
Washington has also tabled a peace proposal that Iran has publicly rejected, though there are suggestions it is still being weighed behind closed doors. At the same time, the deployment of an additional 2,000 US troops to the region has raised questions about the credibility of de-escalation efforts.
Amid these conflicting signals, the safe-haven US Dollar found it difficult to establish a clear trend.
Get better rates and lower fees on your next international money transfer.
Compare TorFX with top UK banks in seconds and see how much you could save.
The Pound struggled to find momentum, with the absence of notable UK economic releases leaving Sterling without a clear catalyst.
With little fresh data to guide markets, GBP traded cautiously as investors continued to assess how the ongoing Middle East crisis could influence the UK’s economic outlook.
While rising energy prices may encourage the Bank of England to maintain a more restrictive policy stance, they also risk placing additional pressure on already weak growth prospects.
Friday’s UK retail sales figures could act as a headwind for the Pound. Forecasts suggest sales volumes contracted by 0.8% in February, with a drop of this scale likely to raise fresh concerns about the resilience of the UK economy.
Across the Atlantic, the final reading of the US consumer sentiment index is also due. If confidence is confirmed to have weakened or revised lower, this could place some downward pressure on the US Dollar.
Developments in the US-Iran conflict are expected to remain a key driver of movement. Any indication that both sides are willing to engage in meaningful peace discussions may lift market sentiment and support GBP/USD. On the other hand, further escalation could reinforce demand for the safe-haven US Dollar and potentially push the exchange rate lower.

International Money Transfer? Ask our resident FX expert a money transfer question or try John’s new, free, no-obligation personal service! ,where he helps every step of the way,
ensuring you get the best exchange rates on your currency requirements.
TAGS: Pound Dollar Forecasts