The main category of All News Articles.
You can use the search box below to find what you need.
[wd_asp id=1]
The main category of All News Articles.
You can use the search box below to find what you need.
[wd_asp id=1]
HSBC has sharply raised its Brent crude price forecast for 2026, lifting its outlook from $80 to $90 per barrel as the crisis in the Strait of Hormuz drags on with no resolution in sight. The bank’s senior oil analyst, Kim Fustier, said global oil markets are unlikely to find balance again until the middle of 2027, a timeline that points to months of tight supply and elevated prices ahead.
HSBC’s revision marks one of the clearest signals yet that major banks now view the Hormuz disruption as a lasting feature of the oil market rather than a passing shock. The bank’s updated Brent crude price forecast reflects a market where supply constraints are expected to persist well into next year, not just through the current quarter.
The 2026 forecast climbed from $80 to $90 per barrel, but the more striking move came further out. HSBC also raised its 2027 Brent outlook to $85 per barrel, up sharply from a prior $65 estimate. That’s a $20 jump for a year in which, in calmer conditions, analysts might have expected prices to have already normalized. Looking further ahead, HSBC’s assumption for 2028 and beyond sits at $75 per barrel, suggesting the bank sees some cooling off eventually, but not a full return to the sub-$70 environment that prevailed before the crisis began.
Brent crude prices have climbed past $100 per barrel lately amid intensifying shipping attacks in the region, yet HSBC’s updated figures—though lower than current spot prices—reflect the bank’s outlook for where prices will land once the initial panic subsides. That distinction matters: a forecast below the current trading price isn’t a bet on relief so much as a signal that HSBC views today’s premium as partly driven by short-term volatility on top of a genuinely tighter underlying supply picture.
The Strait of Hormuz oil crisis is the reason behind HSBC’s entire recalibration. This narrow waterway between Iran and Oman normally carries roughly a fifth of the world’s daily oil consumption, and its disruption has rewritten supply assumptions across the industry.
Oil flows through the strait have stabilized at around 6 million barrels per day, about 30% of pre-conflict levels, according to HSBC’s analysis. That collapse followed a failed diplomatic push: a US-Iran memorandum of understanding designed to stabilize transit through the strait fell apart in July 2026, removing the market’s main hope for a quick fix. Fustier’s note comes in the direct aftermath of that failure, and it explains why HSBC is no longer treating the disruption as temporary.
Why it matters: a fifth of global oil consumption depends on a waterway that is currently operating at less than a third of its normal throughput. Any further deterioration in the diplomatic relationship between Washington and Tehran could keep that bottleneck in place for far longer than markets initially priced in.
HSBC does still see a path back toward normal, just a slow one. By mid-2027, the bank projects flows will climb to 9.5 million bpd, following a gradual rise to 8 million bpd by the end of 2026. Even under that relatively optimistic trajectory, transit volumes would remain well below historical norms for more than a year, which is exactly why the bank pushed its 2027 forecast up so aggressively.
HSBC’s global oil supply disruption scenario isn’t the only possible outcome, and the bank has laid out what happens if diplomacy keeps failing instead of stabilizing.
In a stalemate scenario, where negotiations keep collapsing and transit volumes stay depressed, Fustier’s analysis points to Brent surging as high as $120 per barrel before moderating sometime in 2027. That figure underscores how sensitive this market remains to political developments in the Gulf: a single failed round of talks, as seen in July 2026, was enough to force a $10 upward revision in the 2026 forecast alone.
Beyond the immediate volatility, HSBC’s broader HSBC oil price outlook assumes the market eventually settles into a new, somewhat higher normal. The bank’s 2028-and-beyond assumption of $75 per barrel implies that even a resolved Hormuz crisis would leave a lasting mark on pricing, since rebuilding shipping confidence and restoring full transit volumes tends to take longer than the initial disruption itself. Until flows return closer to their pre-conflict baseline, oil markets are unlikely to rebalance, and HSBC’s own timeline for that puts the turning point around the middle of 2027.
HSBC raised its 2026 Brent crude price forecast because the crisis in the Strait of Hormuz remains unresolved, causing prolonged disruptions to global oil supply.
Oil flows through the strait have dropped to around 6 million barrels per day, about 30% of the volume seen before the conflict began.
HSBC expects oil flows to gradually recover to 8 million barrels per day by the end of 2026 and 9.5 million barrels per day by mid-2027.
If diplomatic efforts keep failing, HSBC’s analysis suggests Brent crude prices could spike to $120 per barrel before moderating sometime in 2027.
Article produced with the assistance of artificial intelligence and reviewed by the editorial team.
The euro zone also remains front and center. The ECB is going to hike rates by 25 bps today and mail the deposit rate at 2.50%. The consensus in the market is that the ECB will not hike again this year. Euro zone inflation was at 3.3% in August, and pressure on energy prices is building, with Deutsche Bank calling for a December rate hike.
Sterling remains subdued. The Bank of England is more cautious than its peers. There is a high consensus in the market that the BoE will hold rates on September 17. 57 of the economists polled in the REUTERS survey expect the BoE to hold for the remainder of the year. Energy concerns are high, and wage and price inflation are still muted.
As indicated in the chart, tightening by the ECB contrasts with the Fed’s data dependency and the BoE’s wait-and-see approach.
Fundamental bias: DXY neutral-to-bearish, EUR moderately bullish, GBP neutral.
Welcome, my fellow traders! I have prepared a price forecast for US Crude, XAUUSD, and EURUSD using a combination of the margin zones method and technical analysis. Based on the market analysis, I suggest entry signals for intraday traders.
Gold continues to trade in a short-term downtrend.
The article covers the following subjects:
Yesterday, the oil price continued to rise, reaching the Target Zone 2 of 94.49–93.68. Today, the price tried to break through this zone, but bears defended it. If the asset remains below the Target Zone 2, a correction may start.
Should a correction develop, the price may fall to the support zone A of 90.65–90.22. Once this zone is tested, consider long trades, with the first target at 92.61 and the second one around 95.01.
Buy near support A of 90.65–90.22. TakeProfit: 92.61, 95.01. StopLoss: 89.07.
Gold extends its short-term downtrend. The price is trading below resistance B of 4,451–4,436. Earlier this week, the asset reached the first bearish target of 4,367. The second target is at 4,282. Consequently, consider holding short trades or opening new ones today.
A breakout above 4,464 will invalidate the bearish scenario. In that case, the short-term trend will turn bullish, and one may consider long trades, targeting the upper Target Zone of 4,621–4,590.
Hold part of the short trades opened at resistance B of 4,451–4,436. TakeProfit: 4,282. StopLoss: at breakeven.
The euro is attempting to continue its short-term uptrend. The second bullish target is at 1.1711. Therefore, consider holding some of the long trades opened earlier near support B of 1.1585–1.1572.
If the EURUSD pair declines and settles below support B, the trend may turn bearish. In this case, consider short trades the next trading day, with a target in the lower Target Zone of 1.1459–1.1434.
Hold part of the long trades opened at support B of 1.1585–1.1572. TakeProfit: 1.1711. StopLoss: at breakeven.
Would you like to learn more about technical analysis methods and principles? Explore our comprehensive guide.
P.S. Did you like my article? Share it in social networks: it will be the best “thank you” 🙂
Useful links:
The content of this article reflects the author’s opinion and does not necessarily reflect the official position of LiteFinance broker. The material published on this page is provided for informational purposes only and should not be considered as the provision of investment advice for the purposes of Directive 2014/65/EU.
According to copyright law, this article is considered intellectual property, which includes a prohibition on copying and distributing it without consent.
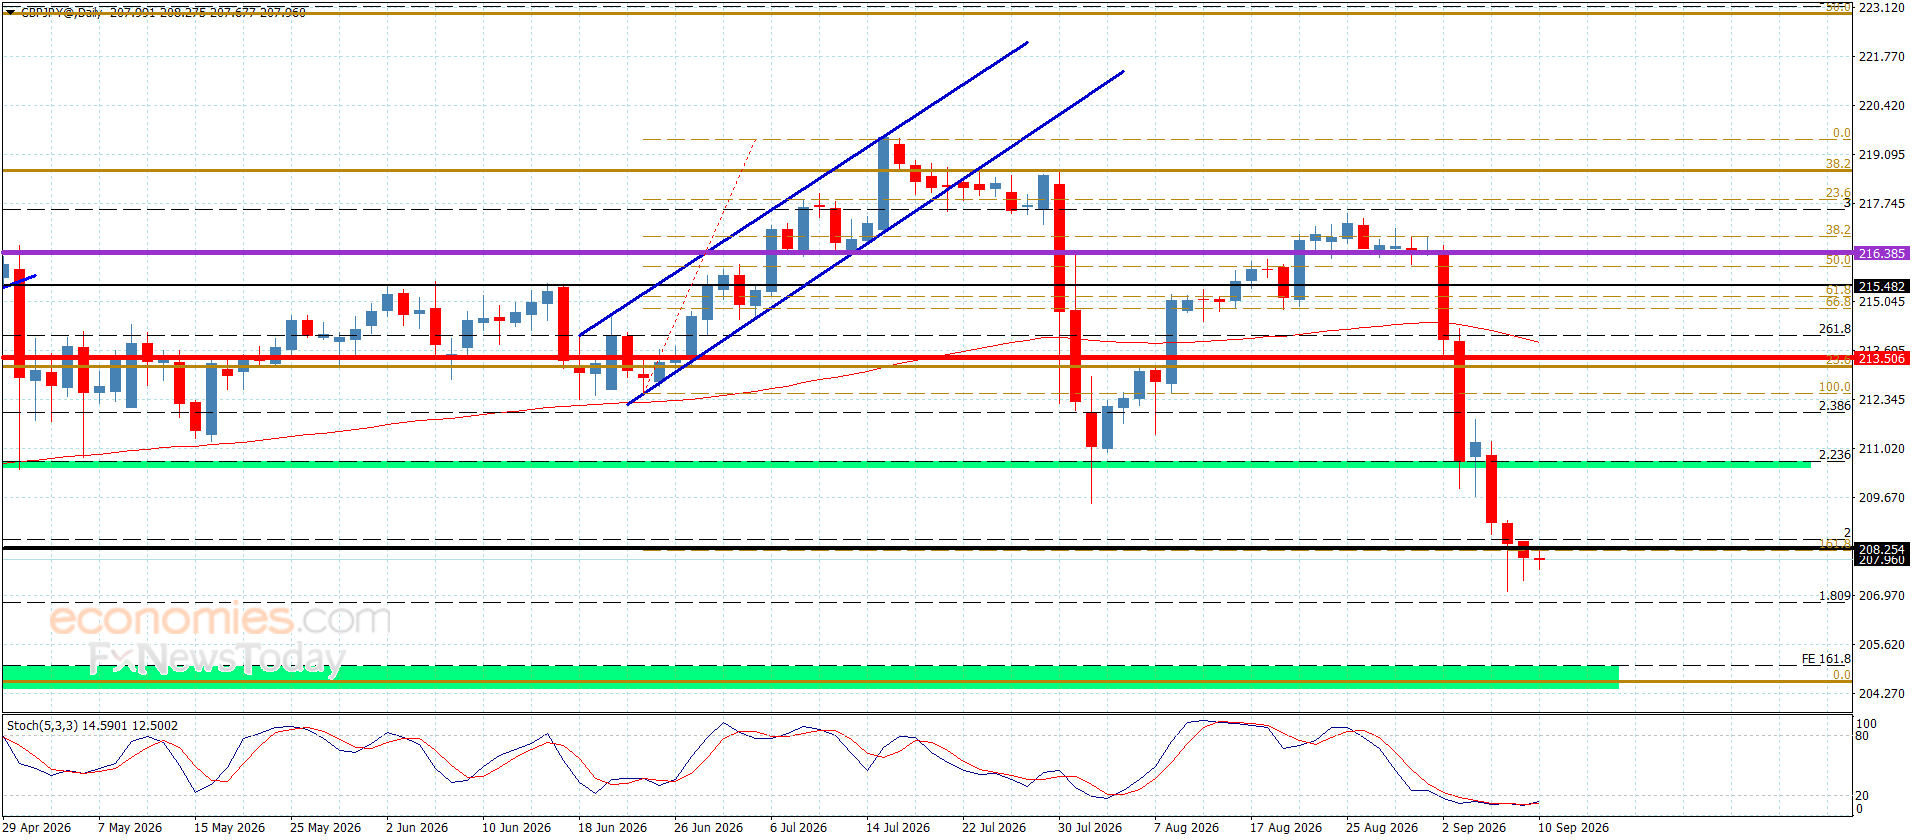
The GBPJPY pair forced to provide more sideways trading after facing a strong obstacle at 207.20, delaying the negative trend and its stability near 208.10 level, reminding you that the negative scenario will remain valid, depending on the stability of the barrier at 210.40, also providing negative momentum by the main indicators will increase the chances of attacking the current obstacle, and surpassing it will make the price target new bearish stations that might begin at 206.70 and 205.85.
The failure of breaking the obstacle and holding above it will confirm the dominance of the sideways trend, to expect forming mixed instable trading with a chance to recover some of the losses by its rally towards 209.60.
The expected trading range for today is between 206.70 and 208.45
Trend forecast: Bearish
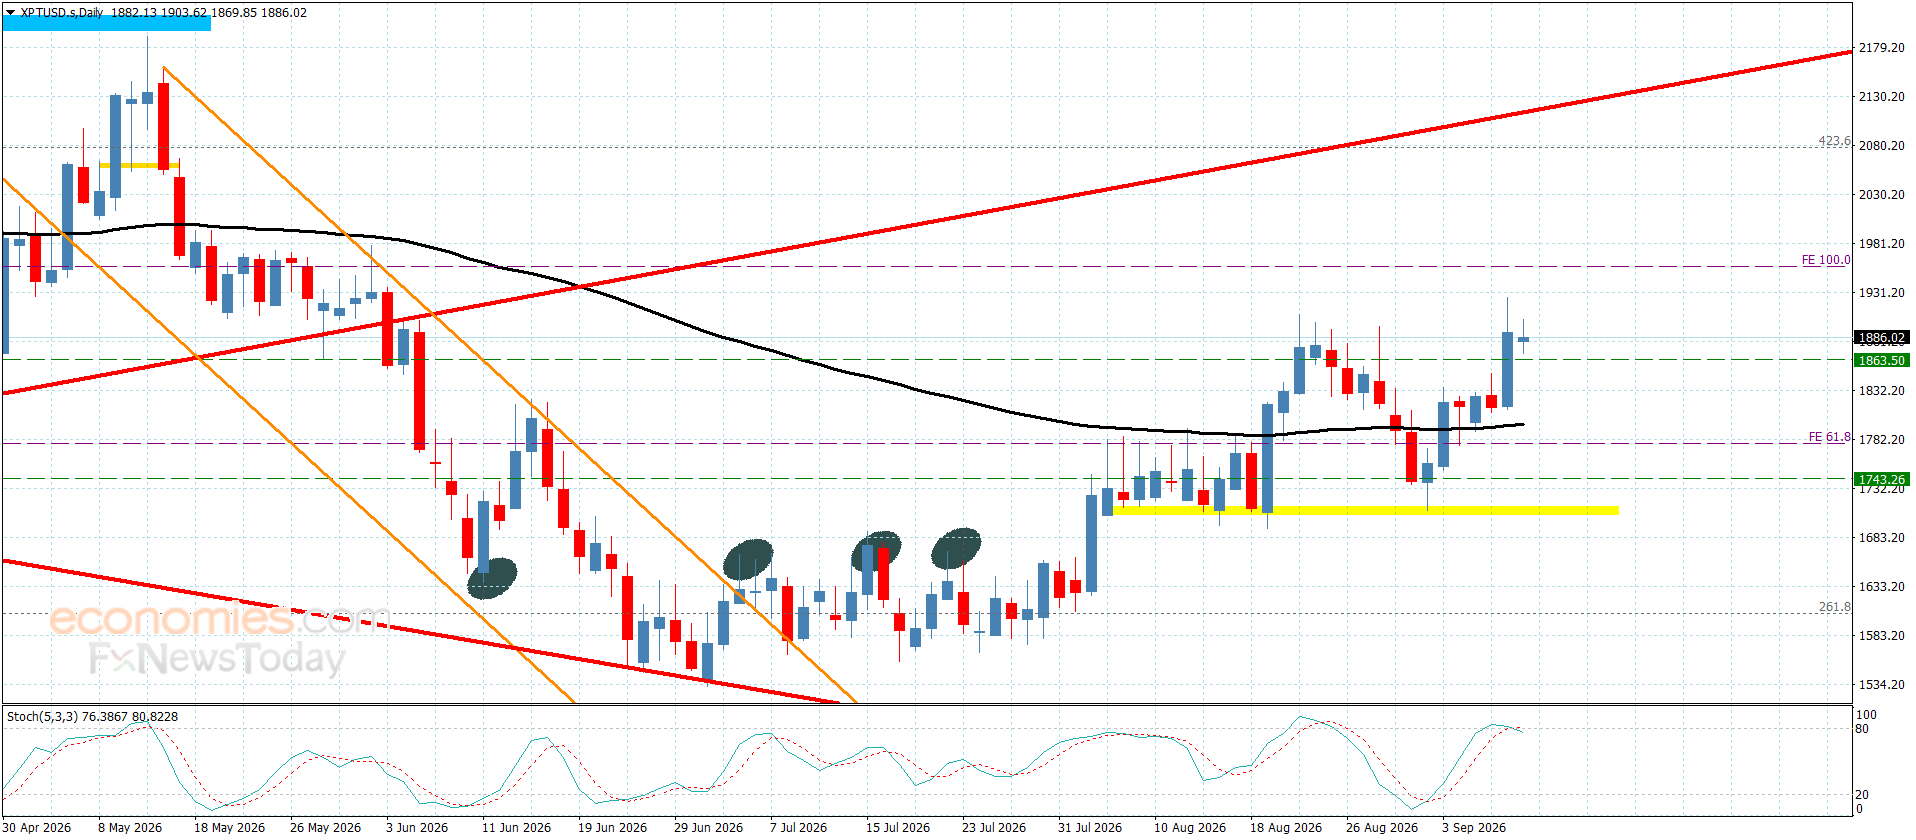
Platinum price succeeded in surpassing $1835.00 level yesterday, reaching the initial target by hitting $1926.00 level, despite the positive factors, we confirm the stability of the trading above $1900.00 to reinforce the chances of resuming the bullish trend and targeting new positive targets by reaching $1958.00 initially, followed by $2060.00, which represents the next main target in the medium trading.
While the price failure to settle above $1900.00 might force it to activate the corrective attempts, to expect reaching the 55-level moving average near $1790.00.
The expected trading range for today is between $1850.00 and $1958.00
Trend forecast: Bullish
EUR/JPY remains steady after three days of losses, trading around 178.60 during the Asian hours on Thursday. Technical analysis of the daily chart indicates the currency cross remains within the descending channel pattern, signalling a bearish bias.
The EUR/JPY cross is maintaining a bearish near-term bias as it holds beneath both the nine-period and 50-period Exponential Moving Averages (EMAs). The currency cross’s slide below these dynamic resistances suggests rallies are likely to be sold into, while the 14-day Relative Strength Index (RSI) near 23 hints at oversold conditions that could slow, but not yet reverse, the current downward pressure.
The EUR/JPY cross may find its primary support at the lower boundary of the descending channel around 177.90. A break below the channel would strengthen the bearish bias and put downward pressure on the cross as it navigates the region around the 10-month low of 175.70, recorded in November 2025.
On the upside, the EUR/JPY cross could rebound toward the nine-day EMA of 180.84, followed by the 50-day EMA of 183.72. Further resistance lies at the upper boundary of the descending channel around 185.50, followed by the all-time high of 187.95 set on April 17.
(The technical analysis of this story was written with the help of an AI tool. Know more.)
The table below shows the percentage change of Euro (EUR) against listed major currencies today. Euro was the strongest against the Canadian Dollar.
| USD | EUR | GBP | JPY | CAD | AUD | NZD | CHF | |
|---|---|---|---|---|---|---|---|---|
| USD | -0.03% | -0.04% | -0.03% | 0.04% | 0.01% | -0.14% | -0.13% | |
| EUR | 0.03% | -0.02% | -0.02% | 0.05% | 0.04% | -0.11% | -0.10% | |
| GBP | 0.04% | 0.02% | 0.02% | 0.07% | 0.06% | -0.10% | -0.08% | |
| JPY | 0.03% | 0.02% | -0.02% | 0.05% | 0.05% | -0.13% | -0.09% | |
| CAD | -0.04% | -0.05% | -0.07% | -0.05% | -0.01% | -0.17% | -0.16% | |
| AUD | -0.01% | -0.04% | -0.06% | -0.05% | 0.00% | -0.15% | -0.12% | |
| NZD | 0.14% | 0.11% | 0.10% | 0.13% | 0.17% | 0.15% | 0.06% | |
| CHF | 0.13% | 0.10% | 0.08% | 0.09% | 0.16% | 0.12% | -0.06% |
The heat map shows percentage changes of major currencies against each other. The base currency is picked from the left column, while the quote currency is picked from the top row. For example, if you pick the Euro from the left column and move along the horizontal line to the US Dollar, the percentage change displayed in the box will represent EUR (base)/USD (quote).
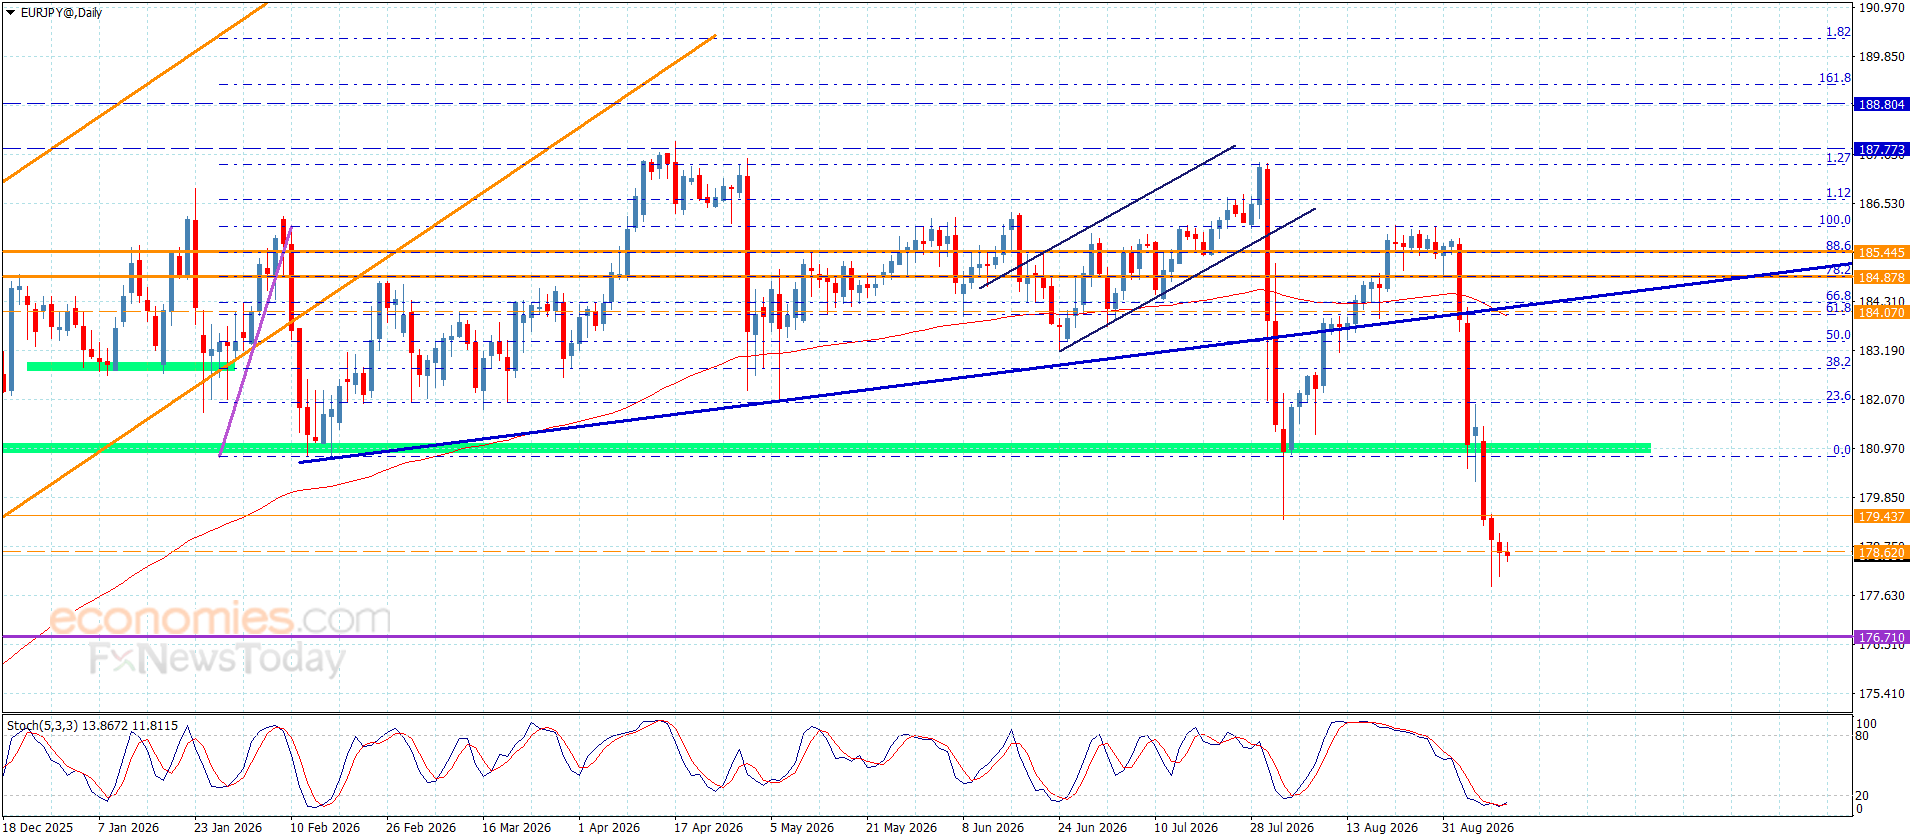
Despite the weakness of the last trading of EURJPY pair’s price and forming weak sideways fluctuation by its stability near 178.50, it will not affect the main bearish scenario due to its stability below 180.80 barrier.
Providing negative momentum continuously by the main indicators will increase the chances of attacking 177.80 barrier, as surpassing it will open the way for reaching extra negative stations that are represented by 177.35 and 176.70 level.
The expected trading range for today is between 177.35 and 179.40
Trend forecast: Bearish
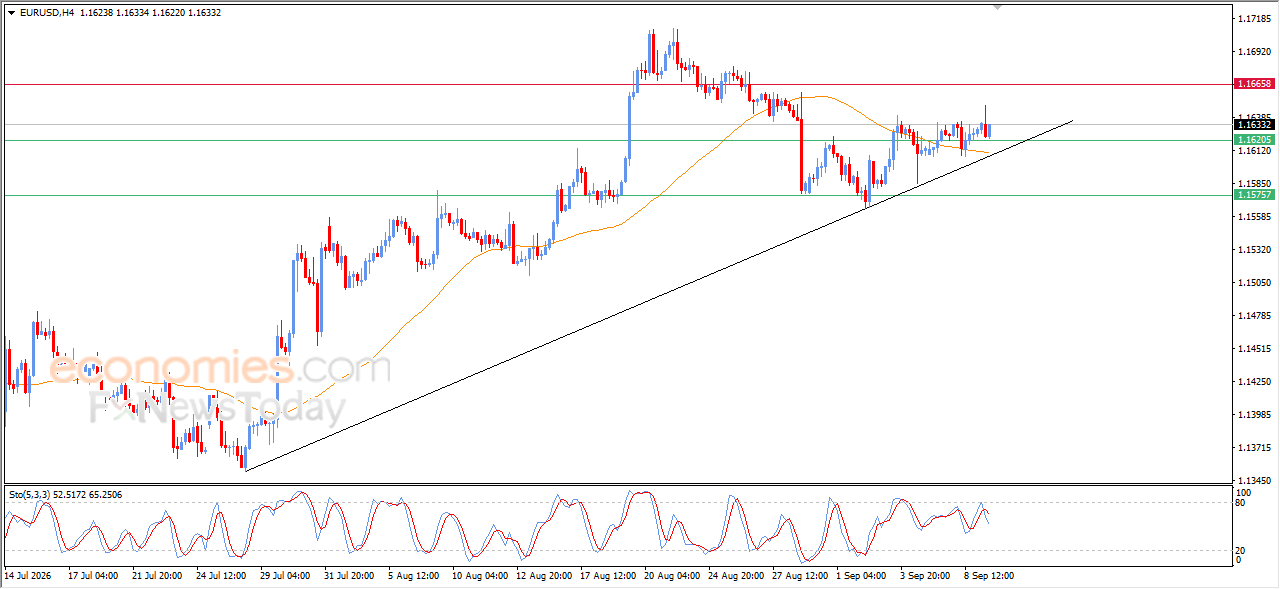
The EURUSD pair has been experiencing volatile trading in its latest intraday movements, as the pair attempts to offload some of its overbought conditions on the relative strength indicators, with negative signals beginning to emerge, against the dominance of the short-term bullish trend, with the pair moving alongside a trend line supporting this path. In addition, positive pressure continues to stem from trading above EMA50, which provides a support base that reinforces the pair’s chances of rising in the near term.
Brent crude futures rose $2.15, or 2.2%, to $100.07 a barrel by 0721 GMT, while U.S. West Texas Intermediate crude was up $1.70, or 1.83%, at $94.73 a barrel.
Brent has risen by a quarter since early last month as hopes fade for a permanent resolution to the six-month-old conflict between the U.S. and Iran.
U.S. Secretary of State Marco Rubio said Washington would continue targeting Iranian oil tankers in response to attempted attacks on U.S. warships. “Iran continues to try to hit U.S. naval ships, and for every time they do that or try to do that, they’re going to lose tankers,” Rubio told reporters during a visit to Colombia.
U.S. Central Command said on Tuesday that its forces had destroyed five Iranian crude oil carriers on September 8 following attempted missile attacks on a U.S. Navy warship over the previous two days.
Jordan’s air-defence systems intercepted 18 of the 20 ballistic missiles launched from Iranian territory, while the other two fell in unpopulated areas, according to the country’s state news agency, which cited the military. No casualties were reported.
Goldman Sachs has warned that oil prices could reach as high as $120 a barrel if attacks on shipping in the Middle East intensify, with the renewed hostilities raising concerns about disruptions to crude supplies.Daan Struyven, co-head of global commodities research at Goldman Sachs, said in an interview with Bloomberg that recent developments indicated that the risk of wider and more severe shipping disruptions had become an important concern.
Struyven said Goldman Sachs sees “meaningful upside to crude oil prices”, while also suggesting that investors position for higher natural gas and refined product prices. He said the supply shocks in gas and fuels are larger than those in the crude market.
The duration of the disruption will be critical for the oil market. JPMorgan estimates that every additional month of disruption could add around $7 to $8 a barrel to Brent prices. If the disruption lasts three months, the bank expects average monthly Brent prices to reach around $114 a barrel.
Citi has raised its average Brent crude price forecast for the third quarter to $86 a barrel from $80, pointing to a longer-than-expected timeline for the reopening of the Strait of Hormuz.
ANZ analysts have also increased their short-term Brent forecast to $95 a barrel and warned that prices could rise further if the Middle East conflict escalates. They said a prolonged standoff involving calibrated military action by the U.S. and Iran appeared to be the most likely scenario, potentially delaying the return of full Middle East supply.
(Disclaimer: Recommendations, suggestions, views and opinions given by the experts are their own. These do not represent the views of The Economic Times)
– Written by
Frank Davies
STORY LINK Pound Sterling Forecast: Yen Surge and Fed Rate Bets Lift GBP/USD
The Pound US Dollar (GBP/USD) exchange rate made modest gains on Wednesday, with Sterling benefiting as broader currency market dynamics limited demand for the US Dollar.
At the time of writing, GBP/USD was trading at around $1.3559, up by approximately 0.2% compared with Wednesday’s opening levels.
The US Dollar (USD) struggled for momentum on Wednesday, with a rally in the Japanese Yen putting pressure on the ‘Greenback’.
The Yen rose to a seven-month high against the US Dollar as expectations of a Bank of Japan (BoJ) interest rate hike continued to build.
Growing speculation around further monetary tightening in Japan has also encouraged investors to unwind Yen-funded carry trades, providing another source of support for the currency.
Meanwhile, the US Dollar faced additional headwinds as markets adopted a cautious stance ahead of Friday’s US consumer price index.
August’s inflation figures could have a significant bearing on the Federal Reserve’s September policy decision, with markets currently assigning around a 60% probability to a 25-basis-point rate hike.
Get better rates and lower fees on your next international money transfer.
Compare TorFX with top UK banks in seconds and see how much you could save.
A weaker-than-expected inflation reading could cause these expectations to retreat, particularly following comments from Fed Governor Christopher Waller suggesting he would prefer to keep interest rates unchanged if there are indications that price pressures are continuing to ease.
Sterling (GBP) managed to edge higher against the US Dollar but remained largely subdued versus its other major counterparts on Wednesday as a fresh jump in energy costs reignited concerns over UK inflation.
UK wholesale natural gas prices surged to their highest levels since 2022, with ongoing instability in the Middle East contributing to the sharp increase.
Higher energy costs could strengthen the case for the Bank of England (BoE) to raise interest rates later in the year.
However, the potential impact on consumers appeared to be a greater concern for GBP investors.
There are growing fears that another squeeze on household finances could weigh heavily on consumer spending, potentially undermining the UK economy’s momentum in the months ahead.

Turning to Thursday, the latest US inflation data is likely to set the tone for the Pound to US Dollar (GBP/USD) exchange rate.
The latest producer price index is expected to show that factory-gate inflation picked up again in August.
A stronger-than-forecast reading could reinforce expectations ahead of Friday’s more closely watched consumer price data, potentially lending further support to the ‘Greenback’ if it points to renewed inflationary pressure.
For Sterling, attention will shift towards the UK’s latest GDP figures on Friday.
Economists expect month-on-month economic activity to have stagnated in July. Should the figures confirm that growth stalled, the Pound could face fresh selling pressure as investors reassess the outlook for the UK economy.
International Money Transfer? Ask our resident FX expert a money transfer question or try John’s new, free, no-obligation personal service! ,where he helps every step of the way,
ensuring you get the best exchange rates on your currency requirements.
TAGS: Pound Dollar Forecasts