The main category of All News Articles.
You can use the search box below to find what you need.
[wd_asp id=1]
The main category of All News Articles.
You can use the search box below to find what you need.
[wd_asp id=1]
Jakarta, Pintu News – Dogecoin (DOGE) is showing signs of a significant shift after several years in a predominantly bearish market structure.
Recent price movements on both short-term and long-term time frames indicate that the meme coin may be preparing for a larger directional move, while market participants are closely watching DOGE’s response around key technical levels.
So, how is the Dogecoin price moving today?
On January 7, 2026, Dogecoin saw a 1.85% dip over the past 24 hours, trading at $0.1478, which is approximately IDR 2,487. During the same 24-hour period, DOGE fluctuated between IDR 2,606 and IDR 2,417.
At the time of writing, Dogecoin holds a market capitalization of around IDR 428.33 trillion, with a 24-hour trading volume of roughly IDR 31.55 trillion.
Read also: Ethereum Price Reached $3,250 Today: ETH Shows Strong Resilience?
Analyst X by the name of Trader Tardigrade notes that Dogecoin is currently visible on the weekly chart, where the price continues to touch the descending trendline that has limited the upside since its peak in 2021. It is this trendline that has kept Dogecoin in a downward trend throughout most of the current cycle.
What makes this situation different is the price response after breaking the trendline in 2024. Instead of experiencing a sharp rejection, DOGE showed a retracement and retest in the same region.
This retest is important because it signals that an area of resistance may turn into an area of acceptance, especially if there is confidence from buyers to continue defending the region.
The current price structure also suggests compression around the trendline, with a series of higher lows compared to the bottoms formed in 2022 and 2023.
From a market cycle perspective, if DOGE is able to hold strong above this trend line, it could turn into a support level and potentially push the price back to test higher resistance levels as recorded in late 2021 to 2022.
On the daily chart (6/1), BitGuru analysts pointed out some clear market phases to explain why the bearish bias still remains in the Dogecoin market.
Read also: Spectacular Surge of Meme Coin Market in Early 2026: What’s Happening?
In the early stages of the market movement, it was seen that DOGE formed arounded base pattern and then entered a strong expansion phase until it peaked slightly above the $0.25 level. However, in the first week of October, the price started to fall and swept away late long positions, resulting in the market sentiment turning negative.
The price declines that occurred in November and December were fairly controlled without any strong rallies or consistent patterns of lower highs. This suggests a distribution pattern, not a panic sell-off. When prices broke through equal lows, many stop losses were triggered, and liquidity on the sell side was absorbed.
After that liquidity sweep phase, Dogecoin entered a period of tight consolidation. Volatility began to diminish, and the downward pressure began to lose steam, although the price remained above the $0.12-$0.13 range.
The latest breakout in January 2026 shows that DOGE managed to return to the $0.14-$0.15 range with strong buying pressure, signaling a potential further upside movement after this accumulation phase.
That’s the latest information about crypto. Follow us on Google News to get the latest crypto news about crypto projects and blockchain technology. Also, learn crypto from scratch with complete discussion through Pintu Academy and stay up-to-date with the latest crypto market such as bitcoin price today, xrp coin price today, dogecoin and other crypto asset prices through Pintu Market.
Enjoy an easy and secure crypto trading experience by downloading Pintu crypto app via Google Play Store or App Store now. Also, get a web trading experience with various advanced trading tools such as pro charting, various types of order types, and portfolio tracker only at Pintu Pro.
*Disclaimer
This content aims to enrich readers’ information. Pintu collects this information from various relevant sources and is not influenced by outside parties. Note that an asset’s past performance does not determine its projected future performance. Crypto trading activities have high risk and volatility, always do your own research and use cold cash before investing. All activities of buying and selling bitcoin and other crypto asset investments are the responsibility of the reader.
Reference:
Gold is correcting from weekly highs of $4,500 early Wednesday as buyers take a breather after the recent relentless upsurge, backed by geopolitical flare-ups globally and increased US Federal Reserve (Fed) interest rate cut bets for 2026.
Having climbed nearly 4% so far this week, traders resort to profit-taking on their Gold long positions in a readjustment move after the bright metal ran into the $4,500 barrier.
Traders also gear up for a bunch of high-impact US economic data releases due later on Wednesday, including the ADP monthly Employment Change, JOLTS Job Openings and ISM Services PMI data.
These data will be closely scrutinized to gauge the timing of the next Fed rate cut as markets continue pricing in two rate reductions for this year. Weaker-than-expected jobs and private services sector data could reaffirm bets for two cuts in the coming months, boding well for non-yielding assets like Gold at the expense of the US Dollar (USD).
On Monday, the US ISM Manufacturing PMI declined to 47.9 in December, against the forecast of 48.3, reinforcing dovish Fed expectations and keeping the recovery attempts in the USD short-lived.
The ongoing bearish undertone around the USD, combined with the escalating geopolitical tensions globally, continues to keep the positive momentum intact in Gold, despite the latest retracement.
On the latest geopolitical developments, Russia deployed submarine and other naval vessels to escort an aging oil tanker off the coast of Venezuela, according to the Wall Street Journal (WSJ).
Meanwhile, China ramped up tensions with Japan by banning exports of goods with potential military uses, following Taiwan-related remarks by Japan’s Prime Minister Sanae Takaichi.
In the daily chart, the 21-day Simple Moving Average (SMA) advances above the 50-day, with price holding over both, signaling firm bullish momentum. The 21-day SMA at $4,363.88 acts as nearby dynamic support. The Relative Strength Index (RSI) at 63.41 remains in bullish territory without overbought readings, keeping the bias tilted to the upside.
Broader trend metrics stay supportive as the 100- and 200-day SMAs continue to climb and the market trades above them. The moving average stack shows buyers in control, with secondary support at the 50-day SMA around $4,212.04 and deeper layers near the 100-day at $3,997.46 and the 200-day at $3,653.43. As long as price holds above the 21-day SMA, the uptrend would extend, while pullbacks could be absorbed into the rising averages.
(The technical analysis of this story was written with the help of an AI tool)
The ADP Employment Change is a gauge of employment in the private sector released by the largest payroll processor in the US, Automatic Data Processing Inc. It measures the change in the number of people privately employed in the US. Generally speaking, a rise in the indicator has positive implications for consumer spending and is stimulative of economic growth. So a high reading is traditionally seen as bullish for the US Dollar (USD), while a low reading is seen as bearish.
Next release:
Wed Jan 07, 2026 13:15
Frequency:
Monthly
Consensus:
45K
Previous:
-32K
Source:
ADP Research Institute
Monetary policy in the US is shaped by the Federal Reserve (Fed). The Fed has two mandates: to achieve price stability and foster full employment. Its primary tool to achieve these goals is by adjusting interest rates.
When prices are rising too quickly and inflation is above the Fed’s 2% target, it raises interest rates, increasing borrowing costs throughout the economy. This results in a stronger US Dollar (USD) as it makes the US a more attractive place for international investors to park their money.
When inflation falls below 2% or the Unemployment Rate is too high, the Fed may lower interest rates to encourage borrowing, which weighs on the Greenback.
The Federal Reserve (Fed) holds eight policy meetings a year, where the Federal Open Market Committee (FOMC) assesses economic conditions and makes monetary policy decisions.
The FOMC is attended by twelve Fed officials – the seven members of the Board of Governors, the president of the Federal Reserve Bank of New York, and four of the remaining eleven regional Reserve Bank presidents, who serve one-year terms on a rotating basis.
In extreme situations, the Federal Reserve may resort to a policy named Quantitative Easing (QE). QE is the process by which the Fed substantially increases the flow of credit in a stuck financial system.
It is a non-standard policy measure used during crises or when inflation is extremely low. It was the Fed’s weapon of choice during the Great Financial Crisis in 2008. It involves the Fed printing more Dollars and using them to buy high grade bonds from financial institutions. QE usually weakens the US Dollar.
Quantitative tightening (QT) is the reverse process of QE, whereby the Federal Reserve stops buying bonds from financial institutions and does not reinvest the principal from the bonds it holds maturing, to purchase new bonds. It is usually positive for the value of the US Dollar.
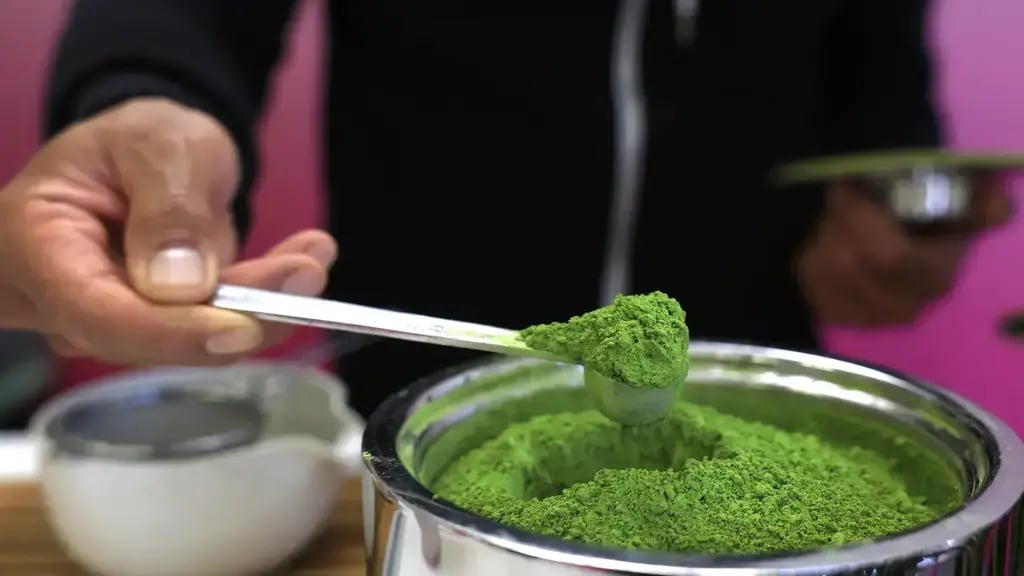
Maya Schneidman and Daniela Kolber are heirs to two of Israel’s most prominent business families. Both are in their twenties, childhood friends whose bond was forged through close family ties. In recent years, they have also built a trendy lifestyle empire entirely of their own making. At the height of the coronavirus pandemic in 2021, the two launched Mix and Matcha, a wellness brand centered on powdered green tea sourced from Japan. The product has taken the global superfood world by storm, and increasingly, Israeli consumers as well.
Six years later, Mix and Matcha is Israel’s first dedicated matcha company. It has played a central role in introducing authentic Japanese matcha culture to the local market and has cultivated a loyal and growing community of enthusiasts. Schneidman and Kolber went door to door at cafes in major cities, armed with samples of green tea powder. They traveled across the country to coffee carts looking for the next big thing and pitched bartenders and restaurant owners on the commercial appeal of the healthy, stylish trend. Over the past five years, the two have become key figures in Israel’s matcha revolution. “We are matcha pioneers,” they say with a smile.
4 View gallery

Maya Schneidman and Daniela Kolber, leading Israel’s matcha revolution
(Photo: Reyan Preuss)
Along the way, they taught Israelis to order matcha alongside a croissant, to drink it at home with milk and cinnamon, and to incorporate it into cocktails, smoothies and desserts. Soon, they say, consumers will also be able to experience matcha-based fragrances. Their perfume line is being developed in New York, and the testers they have already brought to Israel hint at scents that are addictive and well suited to fans of artisanal fragrances.
One sensitive topic for them is the assumption that their success stems from their parents’ wealth. “I did not want money from my parents. It was a matter of principle for me,” Schneidman says. “I knew this would either be a very big success or a very big failure, and in either case, I wanted it to be on me. I invested the money I earned from my fashion blog.” Kolber adds: “I invested my military grant.”
How much did you invest?
“I will not say exactly how much, but not a lot at all,” Schneidman says. Kolber adds: “Let’s say that when we started, we bought 300 units of 30 grams of matcha. Today we buy matcha by the ton. You can do the math.”
They import only high-quality matcha that is also used in Japan for ceremonial purposes. For years, they have focused on building a complete experience around the product, including market education, branding and developing a category that did not previously exist in Israel.
Since its founding, Mix and Matcha has grown into a leading national brand, with thousands of loyal customers and a clear ambition to make matcha a daily staple, like coffee or wine, while expanding into additional health-focused products.
Today, the company employs about 10 full-time and part-time staff members and is in the midst of rapid expansion ahead of opening offices in Tel Aviv. Schneidman and Kolber also dream of conquering the American market and have already begun taking concrete steps toward New York.
 Muki Schneidman Photo: Orel Cohen
Their confidence is rooted, in part, in the environment in which they were raised. Schneidman, 26, is the daughter of business leaders Ronit and Muki Schneidman, founders of fashion and real estate ventures and current owners of Direct Insurance. She splits her time between New York and Tel Aviv after completing a bachelor’s degree in finance at the Wharton School of the University of Pennsylvania.
 Jonathan KolberPhoto: Nimrod Glikman
Kolber, 28, who is engaged to be married, is the daughter of business leaders and philanthropists Irit and Yonatan Kolber. Her mother owns the well-known Claro restaurant in Tel Aviv. Kolber earned a bachelor’s degree in marketing and fashion at FIT in New York and a master’s degree in marketing and psychology in London. She says she relied heavily on consumer psychology in building the brand.
“The Israeli palate is very open to trends. People here like trying new things,” Schneidman says. “For example, there was a crazy trend recently of drinking matcha with coconut water,” Kolber says. “We bring it to Israel and educate the audience. In the summer, people were making matcha with strawberries or blended mango, and we will bring that idea to the cafes we work with as well.” They insist that people who say they dislike matcha likely encountered a low-quality product that tastes like seaweed, not the premium matcha they import.
To demonstrate, Schneidman prepares a seasonal winter matcha they developed themselves and teach cafe owners to make. She whisks the green powder with almond milk, adds cinnamon and a hint of vanilla extract, and serves it. They wait anxiously as I taste it. It is genuinely delicious, all wrapped in the meticulous aesthetic they are known for.
Beyond the product itself, the founders have successfully created a vibrant matcha-loving community that has been consuming their products for five years, requesting them at cafes and restaurants and showing strong brand loyalty. Together with their partner Amit Mendel, who left a high-tech career to join the green vision two years ago, they are now looking overseas.
“We are entering the US market soon, opening a warehouse and shipping across the continent,” Schneidman says. “Other markets also interest us.”
The global matcha market is experiencing rapid growth and is currently valued at an estimated $4 billion to $5 billion, counting only the powder itself and excluding related accessories. Forecasts project the market will reach $8 billion to $10 billion within less than a decade.
The American market, however, is crowded with matcha brands.
“That is true, but we know what we are doing,” she says. “There is always room for another brand, especially one that is young and speaks to its audience.”
Today, Mix and Matcha supplies more than 400 cafes across Israel. They work exclusively with ceremonial-grade matcha imported directly from Japan, a product now facing a global shortage due to production limits and lengthy growing processes. “We plan our inventory quarterly and order tons in advance,” Schneidman says. Kolber adds: “Bringing a new product to market is incredibly challenging. Sustaining a consumer brand over time requires depth, strategy and constant evaluation. We hold weekly and long-term planning meetings to understand where we are and where we want to be.”
Matcha is a unique Japanese green tea in which the entire leaf is ground and consumed, rather than steeped, resulting in a highly concentrated nutritional profile. There are three grades of matcha: ceremonial grade, considered the highest quality; premium grade; and the lowest grade, cooking matcha. The finest leaves are grown under shade, harvested across three picking seasons each year, and then steamed, dried and slowly ground into an ultra-fine powder, a process that preserves their health benefits. Matcha contains antioxidants, chlorophyll and L-theanine, an amino acid that, according to aficionados, delivers focused yet calm energy over time.
The global matcha market is experiencing rapid growth and is currently valued at an estimated $4 billion to $5 billion, counting only the powder itself and excluding related accessories. Forecasts project the market will reach $8 billion to $10 billion within less than a decade, with annual growth of about 8 to 10 percent, among the highest rates in the tea and beverage category. Growth is being driven by global trends in health, functional drinks and coffee alternatives.
In Israel, the matcha market is estimated at tens of millions of shekels annually and is rising sharply, with rapid adoption in cafes, offices and home consumption.
How do you explain the hype around matcha?
“That is the thing, it is not hype,” Kolber says. “My mother, for example, does not drink coffee. She drinks matcha. We always knew it was something real, something that was part of our routine.”
“I was a matcha-obsessed kid,” Schneidman says. “At 13, I was baking matcha cookies and handing them out to friends, and everyone said, ‘What is wrong with you?’ What hooked me was that you can do so much with the powder. It is both an everyday product and something trendy. You want to taste it and be part of a wellness, health and superfood community.”
‘Our parents truly believe in us,” Schneidman says. “Sometimes I tell my father, ‘You are just saying it is good because I am your daughter,’ and he tells me, ‘You have something good here. Do not give up in difficult moments.’’
It seems your connection to the trend is also linked to the environment you grew up in, where there is more exposure to experimentation and premium products.
“Exposure to premium products definitely plays a role,” Schneidman says, “but that is not why there is hype. Matcha speaks to a broad palate. Coffee culture has evolved significantly in recent years, so has wine culture, and matcha has also become a drink you consume every day.”
The two have known each other since childhood and say they are “like cousins.” “Our families spent a lot of time together, shared meals and gatherings. We became family in every sense,” they say. “As teenagers, we also formed a close friendship of our own.”
What do your parents say about your success?
“They are incredibly supportive and proud of us. They know how to give good advice when needed and are always there,” Schneidman says. “We have the best support system in the world,” Kolber adds. “My mother, Ronit, has been in our WhatsApp group from the very beginning,” Schneidman says. “She loves the brand and gives us tips. I always joke that she is our best salesperson, because at every cafe she sits in, she asks whether they serve Mix and Matcha. When we first started, there were months when she packed matcha and customer orders and helped keep the business running while we were both studying.”
Kolber adds: “My mother owns a restaurant in Tel Aviv, and her team advises us. I talk to them a lot.”
And yes, Claro serves matcha.
“It was not automatic,” Schneidman says. “They held tastings and did not accept the product right away.” “It was a normal process, like with any cafe and any supplier,” Kolber says. “Aside from an introduction, there were no shortcuts. There is no financial juice here. What there is, is a strong consulting framework.”
“Our parents truly believe in us,” Schneidman says. “Sometimes I tell my father, ‘You are just saying this is good because I am your daughter,’ and he says, ‘You have something good here. Do not give up during the hard moments.’”
Pi Network is steadily transforming the landscape of digital economies by bringing together millions of pioneers under a unified vision of utility, innovation, and community-driven development. With over 60 million users, Pi Network is no longer just a cryptocurrency platform—it is evolving into a Web3 ecosystem that fuses gaming, artificial intelligence, and decentralized finance, offering unprecedented utility for its participants.
The recent announcements highlight two major pillars of the Pi economy: Web3 gaming through CiDi Games and decentralized AI tasks via OpenMind. Both initiatives exemplify the network’s strategy of leveraging community power to generate real-world value, transcending traditional notions of digital currency and positioning PiCoin as a practical tool within a broader digital ecosystem.
Web3 gaming is a fast-growing sector within the blockchain space, offering decentralized ownership, tokenized rewards, and immersive experiences that empower users to participate actively in digital economies. CiDi Games, integrated with Pi Network, provides Pioneers the opportunity to become part of this emerging gaming universe. By participating in game economies, users can earn, spend, and utilize PiCoin, reinforcing the coin’s utility and creating a tangible bridge between digital assets and interactive entertainment.
Beyond gaming, Pi Network’s collaboration with OpenMind introduces a decentralized approach to artificial intelligence. Global AI tasks can be distributed across the network, harnessing the collective computational power and participation of Pi Pioneers. This not only accelerates AI development but also ensures that the benefits of innovation are shared broadly across the community. By combining PiCoin incentives with practical AI applications, Pi Network demonstrates a model where digital currency drives participation and value creation in real-world technological advancements.
The fusion of gaming and AI within the Pi ecosystem represents a new paradigm of utility for cryptocurrency. Rather than being a speculative asset dependent on market fluctuations, PiCoin is positioned as a tool for active engagement, productivity, and creative participation. Users are no longer passive holders; they become contributors, decision-makers, and beneficiaries of a decentralized economic model.
Community engagement is central to Pi Network’s approach. The platform’s 60M+ pioneers are the backbone of its ecosystem, providing the computational, social, and economic input required to sustain both gaming and AI applications. The network’s design ensures that participation is accessible to a broad audience while incentivizing meaningful contributions through rewards, governance participation, and opportunities for skill development.
The decentralized nature of these initiatives reinforces Pi Network’s commitment to Web3 principles. By distributing both computational tasks and governance across its community, the network avoids centralization risks while fostering a cooperative and participatory environment. This model contrasts with traditional centralized platforms, where value creation and decision-making are concentrated among a few stakeholders. Pi Network empowers its pioneers, aligning incentives with active participation and long-term ecosystem growth.
Technically, the integration of CiDi Games and OpenMind within the Pi Network ecosystem requires robust infrastructure. The network has continuously enhanced its blockchain capabilities, ensuring scalability, security, and efficient transaction processing. These improvements are critical as PiCoin moves beyond simple transactions to more complex applications involving gaming economies and distributed AI computation. The technical readiness of the platform is a key factor in enabling widespread adoption and maintaining user confidence.
From a market perspective, these developments position Pi Network as a project with tangible utility, addressing a challenge faced by many cryptocurrencies: demonstrating real-world relevance. By connecting PiCoin to gaming and AI applications, the network creates clear avenues for value generation and economic participation, moving beyond speculative investment to practical engagement. This strategy also enhances liquidity, network activity, and long-term sustainability, as users interact with the coin in meaningful ways.
The integration of Web3 gaming and AI also illustrates the potential for Pi Network to influence broader trends in digital economies. Gaming, AI, and decentralized finance are converging sectors within the blockchain ecosystem. Projects that can successfully combine these domains have the potential to redefine digital engagement, offering users multifaceted opportunities to earn, interact, and innovate within a unified platform. Pi Network’s initiatives exemplify this approach, demonstrating how community-driven ecosystems can create both economic and technological value.
For pioneers, active participation in these initiatives is both rewarding and impactful. Gamers within CiDi Games can earn PiCoin through play, while contributors to OpenMind tasks can leverage their computational resources for AI problem-solving. These mechanisms create feedback loops where participation strengthens the network, enhances utility, and incentivizes further engagement. By fostering such loops, Pi Network ensures that value is continuously created, distributed, and reinvested into the ecosystem.
The broader implications for Web3 adoption are significant. Projects that demonstrate practical utility, community involvement, and technical readiness are better positioned to achieve mainstream recognition and adoption. Pi Network’s focus on gaming and AI not only drives pioneer engagement but also provides a blueprint for other decentralized ecosystems seeking to integrate multiple domains of utility under a single token economy.
Education and onboarding remain essential as the network grows. Pioneers need clear guidance on participating in gaming economies, contributing to AI tasks, and leveraging PiCoin within the ecosystem. The Pi Core Team continues to provide resources, tutorials, and community support, ensuring that participation is accessible, engaging, and productive for all users. This focus on user empowerment is a defining characteristic of the Pi Network model.
Looking ahead, Pi Network’s emphasis on utility positions it for long-term growth and sustainability. By aligning its 60M+ pioneers with Web3 gaming and decentralized AI, the network is creating a self-sustaining economy where value flows organically through participation, collaboration, and innovation. This approach contrasts with many cryptocurrencies that rely solely on speculative demand, demonstrating that a well-structured, community-driven ecosystem can generate real-world impact.
In conclusion, Pi Network is redefining the role of digital currency by combining gaming, AI, and decentralized participation within a single ecosystem. Its 60M+ pioneers are not just users—they are contributors, decision-makers, and beneficiaries of a growing Web3 economy. Through CiDi Games and OpenMind, PiCoin gains practical utility, real-world relevance, and a foundation for long-term adoption. As the network continues to expand, Pi Network exemplifies how community, innovation, and decentralized power can converge to create a sustainable, engaging, and valuable digital economy for pioneers worldwide.
Writer @Victoria
Victoria Hale is a pioneering force in the Pi Network and a passionate blockchain enthusiast. With firsthand experience in shaping and understanding the Pi ecosystem, Victoria has a unique talent for breaking down complex developments in Pi Network into engaging and easy-to-understand stories. She highlights the latest innovations, growth strategies, and emerging opportunities within the Pi community, bringing readers closer to the heart of the evolving crypto revolution. From new features to user trend analysis, Victoria ensures every story is not only informative but also inspiring for Pi Network enthusiasts everywhere.
The articles on HOKANEWS are here to keep you updated on the latest buzz in crypto, tech, and beyond—but they’re not financial advice. We’re sharing info, trends, and insights, not telling you to buy, sell, or invest. Always do your own homework before making any money moves.
HOKANEWS isn’t responsible for any losses, gains, or chaos that might happen if you act on what you read here. Investment decisions should come from your own research—and, ideally, guidance from a qualified financial advisor. Remember: crypto and tech move fast, info changes in a blink, and while we aim for accuracy, we can’t promise it’s 100% complete or up-to-date.
In my view, bets on more BoJ rate hikes, threats of yen intervention, and expectations of Fed rate cuts suggest a negative price outlook. However, the BoJ neutral interest rate and incoming US economic data will be pivotal, given the focus on US-Japan rate differentials.
A higher neutral interest rate level would signal multiple BoJ rate hikes and a narrower US-Japan interest rate differential. A narrower rate differential would likely trigger a yen carry unwind, sending USD/JPY toward 140 over the longer term.
However, upside risks to the bearish outlook include:
These events would send USD/JPY higher. However, the threat of yen interventions is likely to cap the upside at the 158 level, based on the latest communication.
Read the full USD/JPY forecast, including chart setups and trade ideas.
In summary, the USD/JPY trends will hinge on the BoJ’s neutral rate and the Fed rate path.
A neutral rate in the range of 1.5% to 2.5% would suggest a more hawkish BoJ rate path. Additionally, dovish Fed chatter would support expectations of narrower rate differentials, reinforcing the bearish outlook for USD/JPY.
Crucially, a sharply stronger yen could kickstart an unwinding of yen carry trades, which would likely push USD/JPY toward 140 over the longer 6-12 month time horizon.
For more in-depth analysis, review today’s USD/JPY trading setups in our latest reports and consult the economic calendar.
Industry Analysis Examines Eight-Ingredient Powdered Formula, Nitric Oxide Pathway Research, and Age-Specific Circulatory Considerations for Men Entering 2026
LOS ANGELES, CA, Jan. 06, 2026 (GLOBE NEWSWIRE) — Disclaimer: This article is for informational purposes only. It is not medical advice. Always consult a qualified healthcare professional before starting supplements. If you purchase through links in this article, a commission may be earned at no additional cost to you.
Men increasingly turn to dietary supplements when digital advertisements promise renewed vitality and improved performance. As January 2026 begins, post-holiday consumer search interest in this category is commonly observed. Nitric Boost Ultra, a powdered dietary supplement from a company working with BuyGoods as its retailer, represents one formulation within this expanding category.
Industry observers note that post-holiday periods typically see increased health-related search activity as consumers commit to wellness goals entering new years. This pattern appears commonly observed in 2026, with searches for terms related to male circulatory health, natural performance support, and nitric oxide supplementation often discussed more actively compared to late-year periods.
Some widely cited epidemiological projections have estimated that erectile dysfunction prevalence could reach approximately 322 million men worldwide by 2025, a figure often cited to explain the scale of consumer interest in male wellness and circulation-related topics. This demand drives both legitimate product development and problematic marketing practices that regulatory bodies continue to monitor.
This analysis examines the nitric oxide supplement category through the specific lens of Nitric Boost Ultra’s eight-ingredient formulation, exploring ingredient research, realistic expectations frameworks, age-specific physiological considerations, and the broader market context as the male wellness industry enters 2026. Previous industry coverage has examined various aspects of this product category, including scientific research of multi-pathway nitric oxide formulations and alternative natural approaches to circulatory support.
View the current Nitric Boost Ultra offer (official Nitric Boost page)
Industry Context: Post-Holiday Search Behavior Patterns
Digital advertising platforms including Meta (Facebook/Instagram), Google Display Network, TikTok, and YouTube often feature increased male wellness supplement advertising activity entering January 2026. According to standard industry patterns, post-holiday periods typically generate heightened consumer research activity as individuals commit to health-related resolutions.
Consumer search patterns suggest that individuals seeing advertisements for products like Nitric Boost Ultra often follow similar validation pathways. Initial searches focus on legitimacy verification, followed by ingredient research, user experience investigation, pricing comparison, and purchasing decision factors. This creates specific content needs within the male wellness information ecosystem.
The nitric oxide supplement subcategory within male wellness has experienced particular growth over the past 18 months.
What Is Nitric Boost Ultra?
Nitric Boost Ultra is described by the company as a powdered dietary supplement manufactured and distributed by a company working with BuyGoods as its retailer. The product is positioned within the male wellness category and is commonly researched by consumers interested in circulatory function and nitric oxide pathway supplementation.
According to the company’s materials, the formula contains eight primary ingredients selected for their association with nitric oxide production, blood vessel function, and circulatory support. The powder format distinguishes it from the capsule-based supplements that dominate this category.
The product is distributed to consumers primarily through online channels, with advertising emphasizing natural ingredients, blood flow support, and benefits related to male vitality and performance.
The Nitric Oxide Connection: Scientific Foundation and Market Application
To evaluate the theoretical basis for nitric oxide support supplementation, understanding this molecule’s physiological role is essential. This represents established science that informs supplement formulation approaches across the category.
Nitric oxide functions as a signaling molecule regulating vascular tone. Published research in peer-reviewed journals including Circulation, the Journal of Applied Physiology, and the American Journal of Clinical Nutrition has established that nitric oxide helps blood vessels relax and dilate, affecting blood flow throughout the body. This mechanism relates to cardiovascular health, exercise performance, and male wellness through well-documented pathways.
The body produces nitric oxide through two primary biochemical pathways. The dietary nitrate-nitrite-nitric oxide pathway converts nitrates from foods into nitrite, which then converts to nitric oxide under specific conditions. The L-arginine-nitric oxide pathway involves amino acids serving as substrates for enzymes that produce nitric oxide. Research examining these pathways spans decades and multiple health contexts.
Studies have demonstrated that beetroot juice consumption can increase plasma nitrate concentrations, that L-citrulline supplementation can raise L-arginine levels more effectively than direct L-arginine supplementation in certain contexts, and that these biochemical changes can affect various measures of vascular function. Meta-analyses published in journals including Hypertension and the British Journal of Nutrition have examined these effects across study populations.
However, translating ingredient-level research into finished product expectations represents a significant methodological gap. Individual ingredient studies typically use different doses, isolated compounds, and controlled populations that may not reflect typical supplement users or real-world conditions.
This discussion is intended to explain general physiology and ingredient research, not to evaluate Nitric Boost Ultra or any supplement as a medical treatment.
Ingredient Analysis: Research Context for Eight-Component Formula
Nitric Boost Ultra contains eight ingredients. Understanding what research says about each ingredient individually provides context for evaluating formulation approaches in this category. These findings are ingredient-level and do not confirm outcomes for any finished multi-ingredient supplement.
Beetroot Powder
Beetroot is one of the most studied dietary sources of nitrates. According to research published in the American Journal of Clinical Nutrition and the Journal of Applied Physiology, beetroot supplementation has been examined in numerous contexts including cardiovascular health, exercise performance, and vascular function.
A 2013 meta-analysis in the journal Hypertension examined multiple studies and found that dietary nitrate supplementation was associated with changes in blood pressure parameters in some study populations. Individual study results varied based on baseline health status, dosage, and duration.
Studies examining beetroot for exercise performance have shown mixed results. Some research has observed changes in exercise tolerance or time to exhaustion in certain populations, while other studies have found minimal effects. Variables including training status, exercise intensity, and individual physiology appear to influence outcomes.
These findings are ingredient-level research. Nitric Boost Ultra’s specific beetroot powder dose and formulation context differ from isolated beetroot studies.
L-Arginine
L-arginine is an amino acid that serves as a direct substrate for nitric oxide synthase enzymes. Research examining L-arginine supplementation spans decades and multiple health contexts.
According to studies published in journals including the Journal of Sexual Medicine and Circulation, L-arginine supplementation has been investigated for potential relationships to vascular function in various populations. A 1999 study in BJU International examined L-arginine supplementation in certain populations and observed changes in some participants. However, a 2011 Cochrane review examining L-arginine for cardiovascular conditions noted that evidence quality was often limited by small sample sizes and methodological variations.
Research has also identified that oral L-arginine bioavailability can be limited by intestinal and hepatic metabolism, which has led to interest in alternative approaches including L-citrulline supplementation. Previous industry analysis of nitric oxide pathways has examined these biochemical mechanisms in detail.
These findings are ingredient-level and do not confirm outcomes for finished supplements.
L-Citrulline DL-Malate
L-citrulline is an amino acid that converts to L-arginine in the kidneys. Research published in the British Journal of Nutrition and other journals has shown that L-citrulline supplementation can increase plasma L-arginine concentrations more effectively than equivalent doses of L-arginine itself, due to differences in metabolism.
Studies examining L-citrulline for exercise performance have shown varying results. Some research has observed changes in exercise parameters or muscle soreness markers, while other studies have found minimal effects. The addition of malate (malic acid) in the DL-malate form is theorized to support energy metabolism, though research specifically on citrulline malate combinations is more limited than research on L-citrulline alone. Recent analysis of performance-oriented nitric oxide formulations has examined L-citrulline’s role in various supplement contexts.
These findings are ingredient-level research and do not confirm outcomes for any finished multi-ingredient supplement.
Horny Goat Weed (Epimedium)
Epimedium, commonly called horny goat weed, contains a compound called icariin. According to research published in journals including Phytotherapy Research and the Journal of Sexual Medicine, icariin has been studied primarily in laboratory and animal models for its biochemical properties.
Laboratory studies have examined icariin’s relationship to certain enzyme systems. However, human clinical research on horny goat weed or icariin remains limited, with most studies being small in scale or conducted primarily in animal models.
Traditional use of epimedium in herbal medicine spans centuries, though traditional use does not equate to clinical validation by modern research standards. These findings are ingredient-level and do not confirm outcomes for finished supplements.
Dong Quai (Angelica sinensis)
Dong quai has been used in traditional practices. Research published in journals including Phytotherapy Research has examined various compounds in dong quai including coumarins and ferulic acid.
Some laboratory and animal studies have examined dong quai’s biochemical properties in experimental contexts. However, human clinical research specifically examining dong quai for male wellness applications remains quite limited.
These findings are ingredient-level research and do not confirm outcomes for finished supplements.
Ginkgo Biloba Powder
Ginkgo biloba is one of the most extensively researched botanical supplements. According to a 2009 Cochrane review and other systematic analyses, ginkgo has been studied in multiple health contexts.
Research examining ginkgo has produced mixed results across various applications. Ginkgo’s flavonoid and terpenoid compounds have been studied for biochemical properties in experimental settings, though clinical significance for specific wellness applications remains debated across study populations.
Ginkgo has documented interactions with anticoagulant medications and carries considerations that should be discussed with healthcare providers. These findings are ingredient-level and do not confirm outcomes for finished supplements.
D-Aspartic Acid
D-aspartic acid is an amino acid that has been studied in contexts related to biochemical processes. According to research published in Reproductive Biology and Endocrinology, a 2009 study found changes in certain biomarkers in some study participants taking D-aspartic acid supplementation.
However, subsequent research has produced inconsistent results. A 2013 study in the Journal of the International Society of Sports Nutrition found minimal effects in certain populations. Current evidence suggests effects may vary significantly based on multiple individual factors.
These findings are ingredient-level research and do not confirm outcomes for finished supplements.
Niacin (Vitamin B3)
Niacin is a B vitamin involved in numerous metabolic processes. At higher doses, niacin causes vasodilation through mechanisms distinct from nitric oxide pathways. This is responsible for the characteristic niacin flush that some users experience.
Research published in the Journal of Sexual Medicine and other journals has examined niacin in various health contexts. A 2011 study found that niacin supplementation was associated with changes in certain biomarkers in some populations.
Niacin at supplemental doses can cause temporary skin flushing, warmth, and itching. While generally not harmful, these effects can be uncomfortable. High-dose niacin over extended periods requires monitoring in some contexts.
These findings are ingredient-level and do not confirm outcomes for any finished multi-ingredient supplement.
Critical Context: Ingredient Research vs. Product Applications
This ingredient analysis reveals an important pattern: individual ingredients in Nitric Boost Ultra have been studied in various contexts, often with mixed or preliminary results. None of these studies examined Nitric Boost Ultra as a finished product. The specific combination of ingredients, their doses in this particular formula, and their interactions remain unstudied in clinical trials.
This is not unique to Nitric Boost Ultra. Most dietary supplements on the market have not undergone independent clinical trials as finished products. Consumers must understand that ingredient research provides theoretical rationale but cannot guarantee product efficacy.
Consumer Evaluation Framework: What Individuals Researching This Category Often Consider
Based on the formulation’s focus and the research behind its ingredients, consumers researching nitric oxide support supplements often evaluate products based on several factors.
Nitric Boost Ultra May Align With the Interests of Individuals Who:
Are interested in proactive circulatory support approaches. Research has established that vascular function changes with age. While supplements cannot reverse aging processes, some consumers approaching or past age 40 seek nutritional approaches within broader wellness strategies.
Engage in regular physical activity and want to explore nutritional support options. Some ingredients in formulations like this have been studied in exercise contexts. Individuals who maintain active lifestyles may be interested in the ingredient profile.
Prefer natural approach exploration before considering other interventions. For individuals with mild concerns who are not yet considering other options, dietary supplements represent a different approach. This may be most relevant for those with mild interests rather than significant concerns.
Find powder formats more convenient than capsules. Some individuals prefer mixing supplements into beverages rather than swallowing multiple capsules. The powder delivery system may appeal to those who already use protein powders or other powdered supplements.
Alternative Approaches May Be More Appropriate For Individuals Who:
Have significant or persistent concerns. Dietary supplements provide nutritional support, not medical interventions. Individuals with significant concerns should prioritize medical evaluation to explore underlying factors and discuss appropriate options including approaches that have undergone rigorous clinical testing.
Take multiple medications, particularly blood pressure medications, blood thinners, or related medications. Several ingredients in formulations like Nitric Boost Ultra have documented or theoretical interactions with common medications. Medical oversight becomes particularly important for individuals managing multiple health factors.
Have hormone-related health considerations. D-aspartic acid has been studied in contexts related to biochemical processes. Individuals with conditions affected by hormonal factors should discuss supplementation with healthcare providers.
Are sensitive to niacin or have experienced uncomfortable reactions to B vitamins. The niacin in this formula can cause temporary flushing, skin warmth, and itching in some users. While generally not dangerous, these effects can be unpleasant.
Expect immediate, dramatic changes. Supplements targeting nitric oxide pathways typically require consistent daily use over time periods. They provide nutritional support for normal physiological processes, not on-demand pharmaceutical-type effects.
Questions Consumers Often Bring to Healthcare Providers
Before selecting any supplement in this category, individuals often discuss with healthcare providers:
These questions help ensure that supplement choices align with individual health needs and goals rather than replacing fundamental health practices or necessary medical care.
Age-Specific Considerations: Male Wellness Across Life Stages
Physiological function changes with age, and understanding these changes helps set realistic expectations for supplement support at different life stages.
Understanding Age-Related Changes in Physiological Function
Changes in various physiological parameters with age are common and often reflect normal processes rather than disease states. According to research published in the Journal of Sexual Medicine and other medical journals, these changes may include various parameters requiring more time or stimulation, changes compared to younger years, and other age-related patterns.
These changes result from multiple factors including changes in nitric oxide production, blood vessel elasticity, hormonal shifts, and other physiological processes. Understanding that some degree of change is normal helps individuals maintain perspective and set appropriate expectations for interventions including supplementation.
Considerations for Men in Their 40s
Men in their 40s often first notice subtle changes in various wellness parameters. At this age, proactive approaches to health may be most relevant. Research suggests certain biochemical processes may begin changing around age 40, though individual variation is substantial.
For men in this age range experiencing early-stage interests, lifestyle factors including exercise, diet, stress management, and sleep often have significant impact. Supplementation targeting nitric oxide pathways may be considered as one component of a broader health strategy.
Men in their 40s should be particularly attentive to cardiovascular health. Any sudden changes in wellness parameters warrant medical evaluation.
Considerations for Men in Their 50s
Men in their 50s often experience more noticeable changes in various wellness parameters. At this age, distinguishing between normal age-related changes and changes that indicate health conditions becomes important.
Certain biomarkers typically change gradually with age, though the timing and degree vary substantially between individuals. Some men in their 50s may benefit from biomarker evaluation if concerns include not just one parameter but also energy, mood, and other factors potentially related to broader changes.
Cardiovascular health becomes increasingly important in this decade. Blood pressure, cholesterol, blood sugar, and other cardiovascular factors significantly impact circulatory function throughout the body.
Considerations for Men 60 and Beyond
For men in their 60s and beyond, medical oversight becomes particularly important. At this age, men are more likely to be managing multiple health factors and taking several medications, creating increased potential for supplement interactions.
Wellness concerns at this age more commonly reflect vascular changes, hormonal shifts, or medication effects rather than mild early changes. While supplements may provide some nutritional support, expectations should be realistic. Medical evaluation is typically appropriate for this age group.
Realistic Expectations: What Nitric Oxide Support Supplements Are Designed to Provide
Setting accurate expectations is essential for satisfaction with any supplement, particularly those marketed for male wellness.
What Nitric Oxide Support Supplements Are Designed to Do
Nitric oxide supplements like Nitric Boost Ultra are formulated to support the body’s natural production of nitric oxide through dietary precursors and related compounds. The theoretical benefit is nutritional support for blood flow and circulatory function through physiological processes.
For some individuals with mild interests related to circulation and blood flow, this nutritional approach may be relevant within broader wellness strategies. The ingredients have been studied primarily for their relationships to normal physiological processes.
Some individuals report subjective experiences when using nitric oxide support supplements consistently over time. These reports represent individual experiences and should not be interpreted as typical or guaranteed outcomes.
What Nitric Oxide Supplements Are Not Designed to Do
Nitric oxide supplements are not medical interventions and cannot replace appropriate medical care for diagnosed conditions. Nitric Boost Ultra is described by the company as a dietary supplement; dietary supplements are regulated differently than prescription medications and are not approved by the FDA for addressing diseases.
They do not work like prescription medications. Pharmaceutical products have specific mechanisms and timelines of action. Supplements work through different pathways.
They cannot address severe physiological issues, significant biochemical imbalances, or major health conditions. When concerns are significant or long-standing, medical evaluation and pharmaceutical intervention may be appropriate.
They cannot substitute for fundamental health practices. No supplement can compensate for poor diet, lack of exercise, inadequate sleep, excessive alcohol consumption, smoking, or unmanaged stress.
Individual Variability: Why Experiences Differ
Research consistently shows substantial individual variation in supplement experiences. Factors influencing outcomes include:
Baseline health status. Individuals with mild interests often report different subjective experiences than those with significant concerns. Supplements provide nutritional support, not interventions for advanced medical situations.
Age and physiology. Younger individuals with early-stage changes may respond differently than older individuals with more substantial physiological changes.
Underlying factors. Various wellness concerns can stem from vascular issues, hormonal imbalances, psychological factors, medication side effects, or combinations of these. Supplements addressing blood flow pathways may not be relevant for concerns with different root causes.
Consistency of use. Most supplements require consistent daily use over several weeks. Users expecting immediate changes may discontinue before giving products adequate trial time.
Lifestyle factors. Diet, exercise, sleep quality, stress levels, alcohol consumption, and smoking status all significantly impact wellness parameters. Supplements work best within the context of overall healthy habits.
Medication interactions. Some medications can affect wellness parameters or interact with supplement ingredients, influencing apparent effects.
Psychological factors. Performance anxiety, relationship stress, depression, and other mental health factors significantly affect wellness and can influence supplement experiences.
This variability explains why supplement experiences often range from highly positive to disappointing. Both perspectives can be accurate representations of different individuals’ experiences.
Safety Considerations and Potential Interactions
While Nitric Boost Ultra contains ingredients generally recognized as safe at typical supplemental doses, several important safety considerations apply.
Blood Pressure Considerations
Ingredients affecting nitric oxide pathways can influence blood pressure. For most healthy individuals, these effects are mild. However, individuals taking blood pressure medications should discuss supplementation with healthcare providers before use.
The combination of supplements affecting blood flow with prescription blood pressure medications could potentially cause blood pressure to drop more than intended. This requires medical oversight.
Anticoagulant Concerns
Ginkgo biloba has been associated with bleeding considerations in some studies and case reports. Individuals taking blood thinning medications including warfarin, clopidogrel, aspirin therapy, or other anticoagulants should consult healthcare providers before using supplements containing ginkgo.
This is particularly important for individuals scheduled for surgical procedures, as ginkgo may need to be discontinued before surgery.
Medication Interactions
Several potential medication interactions warrant attention. Individuals should discuss supplement use with healthcare providers if taking medications, particularly those related to cardiovascular function, blood glucose management, mood management, or other categories.
Niacin Effects
Niacin at supplemental doses commonly causes temporary skin flushing, warmth, redness, and itching. These effects typically occur 20-30 minutes after taking niacin and subside within an hour or two. While not dangerous, they can be uncomfortable.
Starting with lower doses and taking niacin with food can sometimes reduce flush intensity. However, some individuals remain sensitive regardless of timing.
When to Avoid or Postpone Supplementation
Supplementation with products like Nitric Boost Ultra may not be appropriate for individuals who:
This safety overview does not replace consultation with healthcare providers. Anyone considering Nitric Boost Ultra should review the complete ingredient list with their doctor, particularly if managing health conditions or taking medications.
The Broader Context: Male Wellness Category Evolution Entering 2026
Nitric Boost Ultra operates within a male wellness supplement category experiencing both growth and increased regulatory attention. Understanding this broader industry context informs consumer evaluation of individual products.
Market Growth and Consumer Behavior Trends
According to market research firms tracking supplement sales, the global men’s health supplements market has expanded steadily over the past five years. Several demographic and cultural trends characterize this growth:
Demographic shifts: Aging male populations in developed markets create growing interest in products addressing age-related changes. The population of men over 40 continues to expand in key markets including North America, Europe, and parts of Asia.
Cultural destigmatization: Reduced stigma surrounding male health concerns has led more men to seek information proactively rather than avoiding the topic. This represents a significant shift from patterns observed a generation ago.
Digital commerce adoption: E-commerce and direct-to-consumer models have made supplement purchasing more accessible and private than retail alternatives. This particularly affects categories where consumers prefer discretion.
Information-seeking Contemporary consumers conduct extensive online research before purchasing health products. Consumer search interest indicates that verification, ingredient research, and comparison evaluation precede most supplement purchases.
Natural approach preferences: Many consumers, particularly those experiencing early-stage concerns, express preferences for trying natural interventions before considering pharmaceutical options. This creates market opportunities for supplement formulations.
New Year Resolution Context: January 2026 Patterns
The timing of this analysis coincides with a predictable annual pattern in health-related consumer behavior. January typically represents peak engagement with wellness goals as individuals commit to changes entering new calendar years.
For male wellness products specifically, several factors converge in early January:
Post-holiday reflection periods: Time away from work routines creates opportunities for health assessment and goal setting that many men deprioritize during busy periods.
Fresh start mentality: The psychological appeal of new beginnings amplifies commitment to lifestyle changes including supplement adoption.
Advertising activity: Supplement marketers increase advertising spending in December and January, capitalizing on resolution-driven consumer receptivity.
Search interest increases: Industry observation commonly shows elevated search interest for health-related terms in January compared to November-December periods.
These patterns create particular relevance for understanding how consumers encounter and research products like Nitric Boost Ultra during this timeframe.
Regulatory Landscape and Quality Concerns
The male wellness supplement category operates under Food and Drug Administration regulations governing dietary supplements, which differ substantially from pharmaceutical drug regulations. Several issues characterize the current regulatory environment:
Pre-market approval differences: Unlike prescription medications, dietary supplements do not undergo FDA pre-market approval processes. Manufacturers bear responsibility for ensuring safety and accurate labeling, but finished products reach consumers without government efficacy verification.
Claims limitations: Supplements cannot legally claim to address, manage, or prevent diseases. Products making such claims cross into drug territory and may face regulatory action. Legitimate supplements in this category focus on supporting normal function through nutritional means.
Undisclosed ingredient concerns: FDA enforcement actions have identified male wellness supplements containing undisclosed pharmaceutical ingredients. These products pose safety risks and violate supplement regulations.
Marketing practices oversight: Federal Trade Commission oversight addresses misleading advertising claims. The FTC has taken action against male wellness supplement marketers making unsubstantiated efficacy claims or using deceptive endorsements.
Counterfeit product issues: Popular supplements often face counterfeit versions sold through unauthorized channels. These may contain incorrect ingredients, improper doses, or contaminants. The presence of Nitric Boost Ultra listings on platforms like Amazon raises authenticity verification concerns for consumers.
Important Regulatory Context: The male wellness supplement category has been under increased regulatory scrutiny in recent years. Consumers should review the most current information about any product’s compliance, ingredient quality, and regulatory standing before purchasing.
How Consumers Evaluate Nitric Oxide Support Supplements in 2026
Consumers researching nitric oxide support supplements often evaluate products based on several verification factors:
Label Reading: Examining ingredient lists for transparency, dose disclosure, and proprietary blend usage. Consumers often prefer products that disclose specific ingredient amounts rather than hiding behind proprietary blends.
Ingredient Transparency: Verifying that listed ingredients match those described in marketing materials. Cross-referencing ingredient names with research databases to understand what studies exist.
Third-Party Testing: Looking for products that undergo independent testing for purity and potency. According to the company’s materials, consumers should verify any third-party testing claims directly with manufacturers.
Refund Terms Verification: Understanding satisfaction policies, return windows, and any conditions or requirements. Reading the fine print about what “money-back guarantees” actually entail.
Retailer Clarity: Confirming who manufactures, who retails, and who provides customer service. For Nitric Boost Ultra, BuyGoods serves as the retailer while the product is manufactured by the company.
Manufacturing Claims: Evaluating statements about FDA-registered facilities, GMP certification, and quality control. Understanding that FDA registration of facilities differs from FDA approval of products.
Source Verification: Ensuring purchases come from official sources rather than third-party resellers where counterfeit risks increase.
Common Misconceptions About Nitric Oxide Supplements
Several common misconceptions surround nitric oxide support supplements that consumers researching this category often encounter:
Misconception 1: “Supplements work like medications”
Dietary supplements provide nutritional support through different mechanisms than pharmaceutical drugs. They work through supporting normal physiological processes rather than pharmacological intervention.
Misconception 2: “Higher doses always work better”
More is not always better with supplements. Many ingredients have optimal dose ranges, and exceeding these may increase side effects without increasing benefits.
Misconception 3: “Natural means risk-free”
Natural ingredients can still cause side effects, interact with medications, and pose risks for certain individuals. Natural does not equal safe for everyone.
Misconception 4: “Testimonials prove effectiveness”
Individual experiences, while genuine, do not constitute scientific evidence. People who have positive experiences are more likely to leave feedback than those with neutral experiences.
Misconception 5: “FDA oversight is the same as for drugs”
Dietary supplements face different regulatory standards than prescription medications. They do not undergo pre-market approval for efficacy.
Misconception 6: “All products with the same ingredients are equivalent”
Quality, purity, dose, and formulation approaches vary between manufacturers. Not all supplements with similar ingredient lists perform identically.
Cardiovascular Health as Foundation
Wellness parameters are fundamentally related to vascular events. The same factors that promote cardiovascular health support various wellness parameters. Research has established strong connections between cardiovascular factors and male wellness. Alternative natural approaches to circulatory support have been examined in various industry contexts, though the relationship between dietary interventions and measurable outcomes remains complex.
According to studies published in the Journal of the American College of Cardiology and other cardiology journals, certain wellness parameters can sometimes serve as early indicators of cardiovascular considerations. Smaller blood vessels may show changes before larger vessels, so vascular considerations may manifest in various wellness parameters.
This means that prioritizing cardiovascular health benefits both heart health and male wellness parameters. Key factors include:
Regular physical activity. Exercise supports vascular function, helps manage weight, reduces stress, and supports healthy blood pressure and cholesterol. Studies have shown that men who engage in regular moderate to vigorous exercise have better wellness parameters across various measures.
Healthy diet. Dietary patterns associated with cardiovascular health, such as Mediterranean-style diets rich in vegetables, fruits, whole grains, fish, and healthy fats, have been associated with better wellness parameters in some studies.
Weight management. Excess weight, particularly abdominal obesity, is associated with various wellness parameters through multiple mechanisms including effects on hormones, inflammation, and vascular function.
Blood pressure monitoring. Elevated blood pressure affects blood vessels over time. Managing blood pressure through lifestyle and medication when necessary protects vascular function throughout the body.
Cholesterol management. High cholesterol contributes to vascular changes. Appropriate management supports long-term vascular health.
Blood sugar monitoring. Diabetes-related changes can affect nerves and blood vessels in ways that impact various wellness parameters. Preventing or well-managing diabetes protects multiple aspects of health.
Pricing and Purchasing Information
According to the company’s website, Nitric Boost Ultra is offered in multiple package configurations through its official online ordering channel. The company also describes a satisfaction policy and shipping terms that vary by destination and package selection.
The company states that its satisfaction policy window is 180 days, subject to the terms and conditions listed on its website. Because offers can change, readers should confirm the latest availability, shipping terms, and policy details directly with the official Nitric Boost Ultra website.
According to the company, Nitric Boost Ultra is distributed through its official online ordering channel rather than traditional retail stores; consumers are encouraged to verify current availability directly through the official website.
Customer Support and Contact Information
According to the company’s website, Nitric Boost Ultra provides customer support through multiple channels:
Phone Support: 1 (814) 885-4823
Hours: Monday through Friday (specific hours listed on website)
Email Support: [email protected]
The company states that customer service representatives can assist with orders, shipping questions, satisfaction policy inquiries, and general product information.
Retailer Information: BuyGoods serves as the retailer for this product. According to the website, BuyGoods is located at 1201 N Orange Street Suite #7223, Wilmington, DE 19801, USA. The role of BuyGoods as retailer does not constitute product endorsement or review of claims.
View the current Nitric Boost Ultra offer (official Nitric Boost page)
Making an Informed Decision About Nitric Oxide Support Supplements
After examining the research, ingredients, realistic expectations, and broader context, consumers can draw certain conclusions about evaluating products in this category.
What the Evidence Supports
Individual ingredients in Nitric Boost Ultra have been studied in various contexts related to nitric oxide production, blood flow, and vascular function. This provides theoretical rationale for formulation approaches. Some ingredients, particularly beetroot, L-citrulline, and L-arginine, have research support in contexts relevant to circulatory wellness.
The powder delivery format offers convenience for some users and is designed to mix into a beverage as an alternative to tablets, though this does not guarantee efficacy.
The company provides contact information, operates through an established retailer, and describes a satisfaction policy, all of which are factors consumers often evaluate compared to less transparent operations in this category.
What Remains Uncertain
Nitric Boost Ultra as a finished product has not undergone independent clinical trials. The specific combination of these eight ingredients at these doses has not been studied for efficacy in populations seeking male wellness support.
Individual experiences with supplements vary significantly. While some consumers may report positive experiences, these represent individual outcomes and cannot predict responses for any specific person.
The gap between ingredient research and finished product efficacy remains substantial. Published studies used different doses, different formulations, and often different populations than typical supplement users.
Factors Consumers Often Weigh
Consumers researching Nitric Boost Ultra often consider whether they:
Conversely, consumers often recognize that alternative approaches may be more appropriate if they:
The Evaluation Process
Nitric Boost Ultra represents a formulation built on ingredients with varying levels of research support for circulatory and vascular function. The theoretical rationale for this approach has basis in the science of nitric oxide and blood flow.
However, theoretical rationale does not equal guaranteed outcomes. The product has not been independently studied, and individual experiences vary significantly. It is a dietary supplement providing nutritional support within broader wellness strategies.
For individuals with mild interests who maintain overall healthy habits and have discussed supplementation with healthcare providers, products like Nitric Boost Ultra may be worth consideration as one component of a broader wellness approach.
For individuals with significant concerns, underlying health conditions, or substantial symptoms, medical evaluation and evidence-based approaches should take priority over dietary supplementation.
The decision about any supplement should be made thoughtfully, with realistic expectations, in consultation with healthcare providers, and as part of a comprehensive approach to wellness that includes fundamental lifestyle practices.
Disclaimers
Affiliate Disclosure: If you purchase products through links in this article, a commission may be earned at no additional cost to you. Always order through the official website to ensure authenticity and access to policies.
Medical Disclaimer: This content is for informational purposes only and is not a substitute for professional medical advice. Nitric Boost Ultra has not been evaluated by the FDA and is not intended to diagnose, treat, cure, or prevent any disease. Always consult a qualified healthcare professional before making changes to your diet, lifestyle, or supplement routine.
Product & Pricing Disclaimer: Product availability, consumer experiences, and pricing may vary. Always confirm the latest details directly with the official brand before making a purchase decision.
Publisher Responsibility Disclaimer: The publisher of this article has made every effort to ensure accuracy at the time of publication. We do not accept responsibility for errors, omissions, or outcomes resulting from the use of the information provided. Readers are encouraged to verify all details directly with the official source before making a purchase decision.
Contact Information:
Retailer Information:
BuyGoods is the retailer of this product. BuyGoods is a registered trademark of BuyGoods Inc., a Delaware corporation, and used by permission. BuyGoods’ role as retailer does not constitute an endorsement, approval, or review of this product or any claim, statement, or opinion used in promotion of this product.
View the current Nitric Boost Ultra offer (official Nitric Boost page)
CONTACT: Phone Support: 1 (814) 885-4823
Email Support: [email protected]

Two Trees Tea House in Occidental isn’t so much a destination as an invitation. Tucked beneath towering redwoods at the edge of town, it’s a place where time is measured in empty cups.
Filled with tins of tea, stacked porcelain teacups and time-worn wood and bamboo furniture, the space mirrors the intentional aesthetic of owners Chris Lewis and Adrian Chang, who’ve distilled years of global travel and a shared passion for tea into just 500 square feet.
After years in high-pressure jobs — Lewis as a creative director in the international division of British department store Harrods, Chang in fashion design — the couple were ready for a change. Designing tea rooms for Britain’s most prominent tea merchants brought Lewis face-to-face with the troubled legacy of colonialism in the tea trade. For Chang, tea offered a way to reconnect with his Chinese heritage. Together, those experiences prompted the couple to take a fresh look at what tea could represent.

Rooted in that philosophy, the pair have made it their mission to bring ethically sourced, single-origin teas to their adopted community, without pretense or pressure.
“Tea is for everyone,” Chang said, pouring hot water over curled leaves on a rainy winter day.
There’s a simple pleasure in ignoring text alerts and to-do lists to stare at the bloom of color as water warms the tea leaves. Oolong loosens tongues as easily as whiskey and 20 minutes becomes two hours as shoulders relax, backs unkink and conversation replaces small talk.


“Time doesn’t exist here,” said Chang, which is precisely the point. Tea resists being rushed. Leaves need time to steep, unfurl and show what they’re made of. Today, ritual has often given way to convenience. Despite its long history, tea is usually treated much like coffee: a quick vehicle for caffeine. Drop a bag in hot water, move on.
Chang notes that some commercially bagged teas are mostly sift left over from whole leaves, stripped of structure and character — a commodity rather than an act of hospitality.
At Two Trees, whole, rolled leaves tumble into porcelain cups with a soft plink, each one intact and recognizable. The dried teas carry herbal and floral notes, sourced from farms Chang and Lewis have visited themselves. It is there that the stories take shape.


While a simple pot is a lovely starting point, Two Trees’ guided tea service is worth the time (a donation is suggested). Chang’s guided five-tea Gong Fu tasting unfolds like quiet theater, paced by a sand hourglass, with tales of Two Trees’ tea partners woven into slow, meditative pours. It’s hard not to fall a little in love, not just with the tea but with the people and places behind each leaf.
Jing Mai Ancestor Red tea is farmed on a mist-wrapped mountain in China’s Yunnan province, near the borders of Laos, Myanmar and Vietnam. The ancient tea forests have been cultivated for more than a thousand years, with tea plants (Camellia sinensis) growing up to 50 feet. The Dai and Bulang people harvest the tea, continuing a millennia-long practice.


Or consider the Ilam tea district of Nepal, which sits at 7,600 feet, one of the highest altitudes for growing tea. Here, local women seeking refuge from oppression are paid living wages to pick delicate white tea made from the earliest spring leaves.
Woven into each of these stories is a profound awareness of history. Lewis approaches Two Trees’ sourcing with a focus on relationships and responsibility, acknowledging the people and places behind the leaves too often written out of history.
“Tea is unifying, disarming and human. It’s about what it does to you and how it makes you feel,” said Chang, heating another pot of water for whoever comes in next.
Open from noon to 5 p.m. Thursday to Sunday. Reservations are required for guided tastings, but anyone is welcome to stop by for a pot of their blended tea regardless of ability to pay.
3597 Bohemian Highway, Occidental, 707-504-8685, twotreesteahouse.com
Natural gas fell below the long-term trend indicator, the 200-day average, on Monday and closed below it thereby confirming the breakdown. Today’s clear bearish response shows the sellers continue to dominate despite a potential bullish hammer candle that formed yesterday. A low-end target is at the lower long-term uptrend line, currently at approximately $3.01. Failure of the 200-day average shows selling pressure at a degree that could see the lower uptrend line eventually reached and possibly lower levels.
However, the next lower target zone is around $3.26 to $3.24 (D), consisting of a 78.6% projected target for a falling ABCD pattern and a 78.6% Fibonacci retracement of the full upswing from the August low. Given weakness today, it looks like that target will likely be reached before the bulls take back control. If it fails, then the lower trendline becomes a target. And if that line fails to reverse the descent a 100% projection for the ABCD pattern shows a potential target below the long-term uptrend line at $2.89.
It is interesting to note that the 20-month moving average is at $3.31 currently, near the next potential support zone. That means that the monthly chart also indicates potential support around the next lower price zone and therefore enhances the potential significance of that price zone.
On the upside, a rally above Monday’s high of $3.53 heads towards the 200-day average, now at $3.56. A daily close above the 200-day line would be needed to confirm strength, while Friday’s high of $3.70 being the first upside target, followed by a swing low at $3.80 (B). The 10-day average would then be next. It is now at $3.92 and falling.
For a look at all of today’s economic events, check out our economic calendar.
Supplementation from a standardized tart cherry (Prunus cerasus L.) extract can support the reduction of inflammation and the management of hyperuricemia, according to a recently published study.1 Hyperuricemia, the study notes, is a potential contributor to metabolic dysfunction, endothelial damage, and chronic kidney disease. Tart cherry is noted for antioxidant and anti-inflammatory properties from its polyphenolic compounds, the study explains, which can reduce plasma urate and levels of C-reactive protein (CRP), a biomarker of systemic inflammation and predictor of cardiovascular disease and other disorders.
The study, “
This study involved 10 healthy adult participants who consumed 500 mg of the standardized whole-fruit tart cherry extract or a placebo daily for four weeks. There were two supplement phases with a 14-day washout period occurring between phases. The extract used in the study was NordicCherry Tart Cherry Extract from biotech company Specnova and was a tart cherry powder in capsules.
Blood samples were taken on day 1 at baseline, 2 hours, 4 hours, and 8 hours after ingestion (to assess acute effects) and on day 28 at baseline and 8 hours after ingestion (to assess chronic effects).
By the end of the study, systemic inflammation and urate levels were significantly reduced in the supplement group compared with the placebo group.
Highlighted results include:
Additionally, the interventions were well-tolerated and no adverse events were reported by participants.
The supplementation offered an alternative to a pharmacological treatment for inflammation and urate metabolism, the researchers stated. “Four weeks of daily supplementation with 500 mg of tart cherry extract significantly reduced systemic inflammation and urate levels in healthy adults, supporting its potential as a polyphenol-rich, foodbased strategy for managing low-grade inflammation and hyperuricemia,” they concluded.
They noted the need for a larger study population to support generalizability and statistical power, plus examining additional biomarkers. More research is needed on the potential effects for participants with impaired kidney function, they noted.
This study examined a powder extract, rather than a juice-based formula, which can have varying polyphenol content and glycemic load, the study explains. It adds that the powder formula is a shelf-stable consistent alternative for long term use.
“NordicCherry® Tart Cherry Extract is already a well-established ingredient used to support muscle strength and exercise recovery,” stated study author Sebastian Balcombe, founder and CEO of Specnova, in an emailed statement to Nutritional Outlook. “This trial adds important new evidence that these benefits extend beyond sports nutrition to cardiometabolic health in otherwise healthy adults. This opens the door for new and unique formulations using NordicCherry®.”
The study also notes that previous researched has linked reductions in CRP levels, even small ones, to improvements in cardiometabolic outcomes.
Reference
A prominent crypto commentator known as Mason Versluis has issued a notable warning for XRP investors, pointing out that parts of the discussion around XRP to lofty price targets as high as $10,000 have drifted far away from reality and risk misleading investors.
Pundit Pushes Back Against $10,000 XRP Predictions
Bullish price predictions around XRP have been arriving at an unusually fast pace in recent months, especially as spot exchange-traded funds and institutional participation are now a major part of investor conversations.
Social media platforms are now filled with increasingly high targets, ranging from triple-digit valuations to extreme calls for four-figure and even five-figure prices at $10,000. Just a few years ago, you would not have believed such XRP price predictions would be as rampant as this.
In a recent video clip circulating across the crypto community, Mason Versluis delivered an unusually blunt assessment of the $10,000 predictions for the altcoin. He dismissed the figure outright, noting that such price targets should not even be part of current conversations.
According to Versluis, anyone aggressively promoting those numbers is doing investors a disservice and misleading them. His argument is based on the fact that XRP has yet to demonstrate the ability to break above far lower price levels, making five-digit projections detached from present conditions.
A closer look at XRP’s circulating supply explains why the $10,000 prediction raises doubts. XRP currently has a circulating supply of about 66 billion tokens with a market cap of $141.9 billion. Therefore, calculations based on the current circulating supply would imply a market cap of roughly $660 trillion if the altcoin reaches $10,000, which is far greater than the current top 100 assets by market cap combined.
To put this in context, gold currently has a market cap of about $31 trillion. The most realistic way that the token might reach $10,000 is for the circulating supply to decrease significantly.
Bullish Bias Exists, But Built Around Progression
According to Versias, XRP reaching $10,000 is not outright impossible. However, the world has only seen roughly 2% of the changes that would be required for XRP to approach a $10,000 valuation.
XRP has not even reached $10, let alone maintained it. In order for any outstanding price levels to become a reality, XRP would first need to break above double digits $10, and hold above. From here, discussions about $50, $100, or higher only become meaningful after XRP proves strength at each preceding level.
Despite the criticism, Versluis made it clear that his outlook on XRP is not bearish. He acknowledged that his stance has grown increasingly optimistic due to developments such as ETF momentum, DeFi activity, and institutional engagement surrounding XRP and the XRP ledger, continuing to improve.