The main category of All News Articles.
You can use the search box below to find what you need.
[wd_asp id=1]
The main category of All News Articles.
You can use the search box below to find what you need.
[wd_asp id=1]
Silver trades around $62 per ounce on Tuesday, not far from the 2026 low of $61.01 posted in March. King Dollar regained its crown after the Federal Reserve shifted to a hawkish stance at its June meeting, with easing tensions in the Middle East also helping.
As the XAG/USD pair approaches the critical threshold, sellers gain confidence and look for potential targets should a bearish breakout occur. In the meantime, it’s worth remembering the precious metal flirted with such a bottom earlier in June and attracted modest buying interest, which, anyway, met sellers ahead of the $ 70 mark, now a technical roof.
The Federal Reserve (Fed) held its first monetary policy meeting, chaired by Kevin Warsh, and as widely anticipated, officials kept the Fed’s Fund Rate unchanged, floating between 3.5% and 3.75%. But surprises were not missing. Policymakers now lean towards a rate hike before year’s end, a 180-degree change from the previous meeting in which a rate cut was still on the table.
Chair Warsh made it pretty clear that he does not believe in forward guidance and that decisions will depend on data. He also announced changes to most of what the Fed does to set monetary policy, and to the approach used to get there.
Still, rate-hike bets are actually taking their toll on Silver.
The United States (US) and Iran signed an agreement last week, which brought major relief to financial markets. Oil prices plunged, with the barrel of West Texas Intermediate (WTI) hovering around $73, not far above pre-war levels. However, the deal is far from a complete roll-back of what happened in the last few months. Negotiations continue, with tensions revolving around Tehran’s willingness to accept nuclear inspections and the full reopening of the Strait of Hormuz. Vessels are indeed moving through, but Iran keeps demanding control of the critical passage. Also, tensions between Israel and Lebanon remain a sticky point to be solved.
Relief – and lower Oil Prices – are another factor playing in the USD’s favor.
The technical setup for XAG/USD hints at lower lows ahead. In the daily chart, the pair extends its slide below the 20-day, 100-day, and 200-day Simple Moving Averages (SMAs), with the shorter one about to cross below the longer one, both converging near the $70 level and reinforcing the strength of the resistance area. The same chart shows the Momentum indicator heads nowhere below its midline, while the Relative Strength Index (RSI) indicator aims firmly lower near 33, suggesting sellers remain in control despite the risk of a corrective bounce.
On the topside, initial resistance is clustered around the longer-term averages, with the 200-day SMA at $69.33 closely followed by the 20-day SMA at $69.38, forming the first significant cap for any recovery attempts. A sustained break above that zone would open the way toward the 100-day SMA at $76.71, where the broader bearish structure would likely be challenged. Once the year low gives up, investors will be looking for XAG/USD behavior around the $60 psychological threshold. Failure to bounce sustainably from the latter will open the door for a test of the $54.60 price zone, where the pair bottomed last December. Additional declines expose the $50 mark, where selling interest is likely to recede.
(The technical analysis of this story was written with the help of an AI tool.)
– Written by
David Woodsmith
STORY LINK GBP/USD Price Forecast: Hawkish Fed Expectations Keep US Dollar Supported
The Pound to US Dollar (GBP/USD) exchange rate edged lower on Tuesday as investors reacted to the latest UK purchasing managers’ index data.
At the time of writing, GBP/USD was trading close to $1.3224, down roughly 0.2% compared with Tuesday’s opening levels.
The Pound (GBP) came under selling pressure on Tuesday after fresh survey data painted a weaker-than-expected picture of the UK economy.
Markets had anticipated that June’s preliminary PMI figures would show a return to growth in the UK’s dominant services sector. Instead, the data revealed that activity contracted at a faster pace than in the previous month, dampening confidence in the economic outlook.
The disappointing release prompted investors to further scale back expectations for future Bank of England (BoE) policy tightening. Some analysts now believe the central bank could keep interest rates unchanged for the rest of 2026.
The US Dollar (USD) remained firmly bid throughout Tuesday’s session as markets continued to digest the implications of the Federal Reserve’s latest policy meeting.
Demand for the ‘Greenback’ was underpinned by expectations that US interest rates may stay elevated for an extended period, with investors increasingly embracing a higher-for-longer outlook.
Get better rates and lower fees on your next international money transfer.
Compare TorFX with top UK banks in seconds and see how much you could save.
Although the Fed left borrowing costs unchanged at its most recent meeting, officials struck a relatively hawkish tone, indicating that further policy tightening cannot be ruled out should inflationary pressures prove stubborn.
Additional support for USD came from a cautious market mood, as weakness across global technology stocks encouraged investors to seek the safety of traditional haven assets.
With little in the way of major economic releases scheduled over the next couple of days, movements in the Pound to US Dollar (GBP/USD) exchange rate may be driven largely by developments on the UK political front.
As Andy Burnham looks all but guaranteed to succeed Keir Starmer as Prime Minister, investors are increasingly focused on who may be selected for key cabinet positions. In particular, any indications regarding the next Chancellor could have implications for market sentiment toward the UK.
Sterling traders may also pay close attention to comments from BoE policymaker Sarah Breeden on Wednesday. Given her reputation as one of the more dovish members of the Monetary Policy Committee, any suggestion that rates are likely to remain on hold could weigh on the Pound.
For the US Dollar, broader market sentiment may remain the primary driver in the near term, with investors awaiting a series of high-profile US economic releases due later in the week.

International Money Transfer? Ask our resident FX expert a money transfer question or try John’s new, free, no-obligation personal service! ,where he helps every step of the way,
ensuring you get the best exchange rates on your currency requirements.
TAGS: Pound Dollar Forecasts
Copper price continues to hold to the bearish corrective scenario, posting some downward corrective trades and settling near the $6.2400 level. We reiterate the importance of the price gathering additional negative momentum, which would strengthen the chances of attacking the support level at $6.1000 soon. A break below this level would open the way toward further corrective targets, starting at $5.9200 and then $5.8000.
On the other hand, the possibility of a renewed bullish move remains valid if the price succeeds in breaking above the $6.6000 level and maintaining stability above it. This would pave the way toward notable positive targets, beginning at $6.7300 and then $7.0000.
The expected trading range for today is between $6.1000 and $6.4200
Trend forecast: Bearish
The USD/JPY pair enters a bullish consolidation phase during the Asian session on Tuesday and currently trades just above 161.50 amid mixed fundamental cues. Spot prices, however, remain well within striking distance of a 40-year peak, around the 162.00 neighborhood set in July 2024, as traders remain on edge amid fears that Japanese authorities will step in to prop up the Japanese Yen (JPY).
Local broadcaster TBS reported that Japan’s Finance Minister Katayama held an online meeting with US Treasury Secretary Bessent to discuss the JPY’s sharp decline and potential intervention. Adding to this, Japan’s Chief Cabinet Secretary Minoru Kihara said that he will take appropriate action against the foreign exchange (FX) moves if needed. This holds back JPY bears from placing fresh bets and caps the upside for the USD/JPY pair.
However, economic risks stemming from the Middle East conflict and energy supply disruptions through the Strait of Hormuz continue to undermine the JPY. Apart from this, a persistently wide Japan-US rate differential keeps the JPY bulls on the back foot. The US Dollar (USD), on the other hand, stands firm near its highest level since May 2025, lending additional support to the USD/JPY pair.
Last week’s sustained breakout through the previous intervention zone, around the 160.50-160.60 area, comes on top of the recent solid bounce from the 200-day Exponential Moving Average (EMA) and keeps the broader uptrend intact. That said, the Relative Strength Index (14) is hovering in overbought territory near 70, which hints at risk of consolidation or a corrective pause rather than a confirmed near-term top for the USD/JPY pair.
Meanwhile, the Moving Average Convergence Divergence (MACD) indicator remains positive above the zero line, reinforcing the underlying upward pressure. In the meantime, the structural pivot around 160.60-160.50 should protect the immediate downside. Moreover, the 200-day EMA at 156.47 should provide a deeper layer of trend support if a sharper corrective pullback unfolds amid elevated RSI readings.
(The technical analysis of this story was written with the help of an AI tool.)
The table below shows the percentage change of Japanese Yen (JPY) against listed major currencies last 30 days. Japanese Yen was the strongest against the New Zealand Dollar.
| USD | EUR | GBP | JPY | CAD | AUD | NZD | CHF | |
|---|---|---|---|---|---|---|---|---|
| USD | 1.73% | 1.49% | 1.66% | 2.90% | 2.62% | 3.16% | 2.85% | |
| EUR | -1.73% | -0.24% | -0.09% | 1.12% | 0.88% | 1.42% | 1.11% | |
| GBP | -1.49% | 0.24% | 0.21% | 1.43% | 1.16% | 1.68% | 1.39% | |
| JPY | -1.66% | 0.09% | -0.21% | 1.17% | 0.99% | 1.51% | 1.10% | |
| CAD | -2.90% | -1.12% | -1.43% | -1.17% | -0.17% | 0.33% | -0.04% | |
| AUD | -2.62% | -0.88% | -1.16% | -0.99% | 0.17% | 0.53% | 0.22% | |
| NZD | -3.16% | -1.42% | -1.68% | -1.51% | -0.33% | -0.53% | -0.31% | |
| CHF | -2.85% | -1.11% | -1.39% | -1.10% | 0.04% | -0.22% | 0.31% |
The heat map shows percentage changes of major currencies against each other. The base currency is picked from the left column, while the quote currency is picked from the top row. For example, if you pick the Japanese Yen from the left column and move along the horizontal line to the US Dollar, the percentage change displayed in the box will represent JPY (base)/USD (quote).
Silver price (XAG/USD) loses over 1% after registering modest gains in the previous day, trading around $64.50 per troy ounce during the Asian hours on Tuesday. The non-yielding Silver struggles amid a hawkish policy outlook at the Federal Reserve (Fed).
Last week, the US central bank opted to hold its benchmark interest rate steady between 3.50% and 3.75%. However, the updated economic projections and commentary from Kevin Warsh, presiding over his first meeting as Fed Chair, surprised the market by leaning more hawkish than anticipated. As a result, futures traders have fully priced in a 25-basis-point rate hike for the September meeting, with some pricing in a minor probability of a tightening move as early as next month.
The downside of the Silver price could be restrained amid progress in ongoing peace talks between the US and Iran, which helped ease concerns about inflation. According to a CNBC report on Tuesday, US Vice President JD Vance noted that negotiations have made “great progress,” despite some underlying friction. This followed Vance’s Monday announcement that Iran has agreed to readmit International Atomic Energy Agency (IAEA) inspectors. The optimism was mirrored by Iranian Foreign Minister Abbas Araghchi, who similarly confirmed that the Swiss dialogue has yielded “major progress.”
Precious metals, including Silver, have faced persistent downward pressure since the outbreak of the Middle East conflict in late February. Disruptions to energy flows through the Strait of Hormuz initially drove crude oil prices higher, intensifying market fears that central banks would keep interest rates elevated to curb sticky inflation.
The supply outlook shifted after Washington issued Tehran a 60-day license to sell oil on international markets. This regulatory relief has fueled expectations of a faster recovery in global crude supplies, potentially easing the inflationary pressures that have weighed heavily on safe-haven assets.
Silver is a precious metal highly traded among investors. It has been historically used as a store of value and a medium of exchange. Although less popular than Gold, traders may turn to Silver to diversify their investment portfolio, for its intrinsic value or as a potential hedge during high-inflation periods. Investors can buy physical Silver, in coins or in bars, or trade it through vehicles such as Exchange Traded Funds, which track its price on international markets.
Silver prices can move due to a wide range of factors. Geopolitical instability or fears of a deep recession can make Silver price escalate due to its safe-haven status, although to a lesser extent than Gold’s. As a yieldless asset, Silver tends to rise with lower interest rates. Its moves also depend on how the US Dollar (USD) behaves as the asset is priced in dollars (XAG/USD). A strong Dollar tends to keep the price of Silver at bay, whereas a weaker Dollar is likely to propel prices up. Other factors such as investment demand, mining supply – Silver is much more abundant than Gold – and recycling rates can also affect prices.
Silver is widely used in industry, particularly in sectors such as electronics or solar energy, as it has one of the highest electric conductivity of all metals – more than Copper and Gold. A surge in demand can increase prices, while a decline tends to lower them. Dynamics in the US, Chinese and Indian economies can also contribute to price swings: for the US and particularly China, their big industrial sectors use Silver in various processes; in India, consumers’ demand for the precious metal for jewellery also plays a key role in setting prices.
Silver prices tend to follow Gold’s moves. When Gold prices rise, Silver typically follows suit, as their status as safe-haven assets is similar. The Gold/Silver ratio, which shows the number of ounces of Silver needed to equal the value of one ounce of Gold, may help to determine the relative valuation between both metals. Some investors may consider a high ratio as an indicator that Silver is undervalued, or Gold is overvalued. On the contrary, a low ratio might suggest that Gold is undervalued relative to Silver.
Platinum price remains affected by recurring negative pressures, represented by its overall stability below the main resistance level currently extending toward $1,940.00. In addition, the $1,865.00 level is forming another strong barrier, forcing the price to renew its bearish attempts, with the price currently positioned near the $1,645.00 level.
The availability of negative momentum will increase the chances of the price attacking the support level at $1,605.00 soon. A break below this level would strengthen the chances of resuming the bearish move, targeting $1,565.00 and then $1,490.00 respectively.
The expected trading range for today is between $1,565.00 and $1,700.00
Trend forecast: Bearish
Coffee (KC) is trading at $267.4, showing a moderate daily gain of 0.38%. The asset is positioned above its key short-term moving averages, reflecting some intraday resilience despite the prevailing market context.
Real-time Data
10:02
272.58
On the technical front, KC/USD is currently holding above the MA-20 and MA-50 on the hourly timeframe, while it remains well below the MA-200 on the daily chart. The Ichimoku Kijun line at $264.32 provides immediate support, serving as a potential anchor for near-term price action. Momentum indicators are overwhelmingly negative, with MACD, RSI, CCI, and Stoch RSI all in Sell territory. The Bull/Bear Power (BBP) registers an oversold condition, reflecting strong dominance from sellers within the session. Meanwhile, the ADX signals a neutral trend, and the Awesome Oscillator does not provide a clear direction, indicating a pronounced divergence between price action and underlying momentum signals.
In the short term, KC/USD is expected to trade within a range of $263.4 to $271.4 over the next one to two trading days, representing a typical volatility band relative to current levels. The baseline scenario envisions sideways movement as price consolidates within this corridor. Should resistance be breached on the upside, there is scope for a move toward the upper boundary of the forecast range. Conversely, a break below immediate support at $264.32 could trigger a further slide toward the lower end of the projected window.
In a recent review, analysts noted a prevailing downside bias for coffee amid persistent selling pressure and technical resistance. However, the current stabilization above near-term moving averages suggests early signs of resilience, making the $264.32 level a pivotal support to monitor for confirmation of a potential shift in momentum.
Platinum price remains affected by recurring negative pressures, represented by its overall stability below the main resistance level currently extending toward $1,940.00. In addition, the $1,865.00 level is forming another strong barrier, forcing the price to renew its bearish attempts, with the price currently positioned near the $1,645.00 level.
The availability of negative momentum will increase the chances of the price attacking the support level at $1,605.00 soon. A break below this level would strengthen the chances of resuming the bearish move, targeting $1,565.00 and then $1,490.00 respectively.
The expected trading range for today is between $1,565.00 and $1,700.00
Trend forecast: Bearish
Natural gas price remains positioned below the 55-period moving average, fluctuating repeatedly near the $3.250 level, confirming its continued adherence to the bearish scenario, which is based on the stability of resistance at $3.520.
We emphasize the importance of the price gathering negative momentum at the current levels, which would allow it to form further bearish waves and target the $3.050 and $2.920 levels respectively in the near term. However, a breakout above the resistance level and stability above it would confirm a shift toward the bullish path, allowing the price to begin recording further gains with an initial target at $3.710.
The expected trading range for today is between $3.050 and $3.350
Trend forecast: Bearish
GBP/USD is trading close to this year’s lows as political uncertainty builds and speculation surrounding Prime Minister Keir Starmer’s future adds another headwind for sterling.
Starmer may step down as soon as today, although it is still unclear whether he will or whether he will remain in power to fight any potential leadership challenge from Greater Manchester Mayor Andy Burnham, whose victory in the Makerfield by-election has given him a path to Westminster.
For the pound, the key focus is fiscal policy. Should Burnham become Prime Minister, markets will want clarity on his spending plans and whether he would maintain the current fiscal rules. Any suggestion of increased borrowing could be poorly received by the UK bond market, particularly given the UK’s already stretched debt position.
A potential increase in gilt issuance to fund higher spending could make investors nervous at a time when concerns surrounding public finances remain elevated.
The pound has also come under pressure after cooler-than-expected UK CPI data last week prompted markets to scale back expectations for a Bank of England rate hike this year.
This contrasts with the more hawkish tone from the Federal Reserve following last week’s FOMC meeting.
The Fed’s hawkish tilt helped lift the US Dollar Index to a fresh 2026 high and could continue to support the greenback.
Attention now turns to US Core PCE inflation data, which could provide further clues over the outlook for US interest rates.
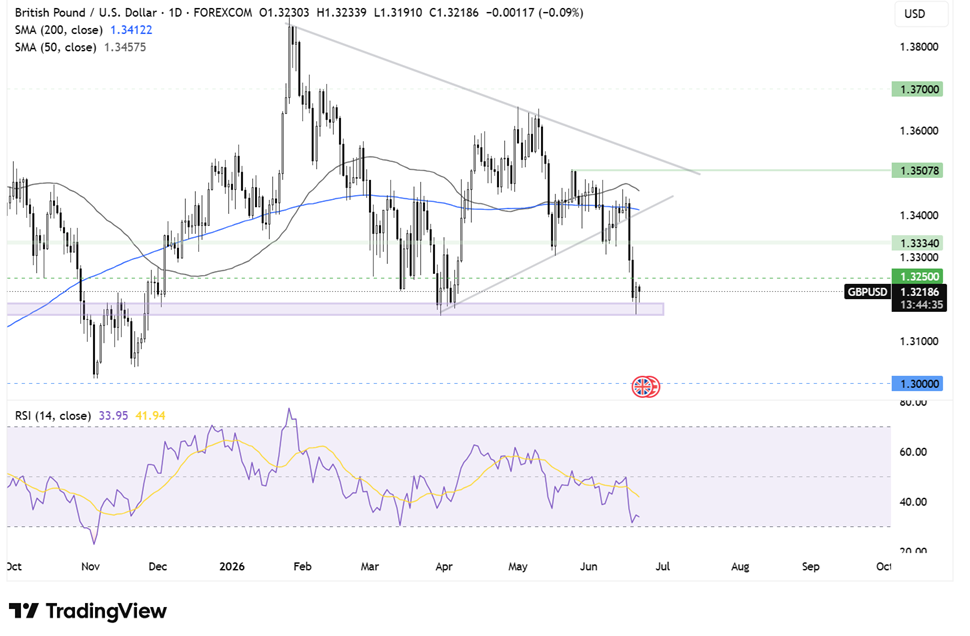
GBP/USD broke below its symmetrical triangle pattern, falling to a low of 1.3160 before recovering back above 1.3200. The pair continues to trade below its 50 and 200 SMAs, while the RSI remains below 50, keeping sellers hopeful of further downside.
Sellers will look for a break below 1.3160 to create a lower low and open the door towards the psychological 1.3000 level.
Buyers may be encouraged by the hammer candlestick reversal pattern. However, they will need to reclaim 1.3250 before bringing 1.3335 into focus. Above here, the 200 SMA around 1.3400 and the rising trendline resistance come into view.
EUR/USD fell to 1.1410 last week, its lowest level since March, as the US dollar surged following the hawkish FOMC meeting. While the pair has recovered some ground, it remains well below 1.1500.
The euro is finding some support today after progress was reported in the first session of talks between the US and Iran. Oil prices have fallen further as vessels continue to move through the Strait of Hormuz.
This is positive for Europe, which remains heavily dependent on imported energy.
However, gains in EUR/USD could remain limited by continued US dollar strength. Last week’s FOMC meeting saw the Fed leave rates unchanged, but nine of 18 policymakers now expect a rate hike before the end of the year. Meanwhile, new Fed Chair Kevin Walsh doubled down on the importance of returning inflation to target, reinforcing the hawkish message.
Attention this week will focus on US Core PCE, the Fed’s preferred inflation gauge, which could provide further clues over the path of US interest rates.
While the ECB raised rates just a week before the Federal Reserve, that move already appears to have faded into the background. The ECB maintained a cautious, data-dependent tone and another rate hike risks placing additional pressure on an already fragile Eurozone economy.
Today, attention turns to Eurozone consumer confidence, which is expected to remain broadly stable around -18. ECB President Christine Lagarde is also due to speak.
Tomorrow’s PMI figures could provide further insight into the health of the Eurozone economy after May’s composite PMI remained in contraction territory. Another weak reading could keep pressure on the euro.
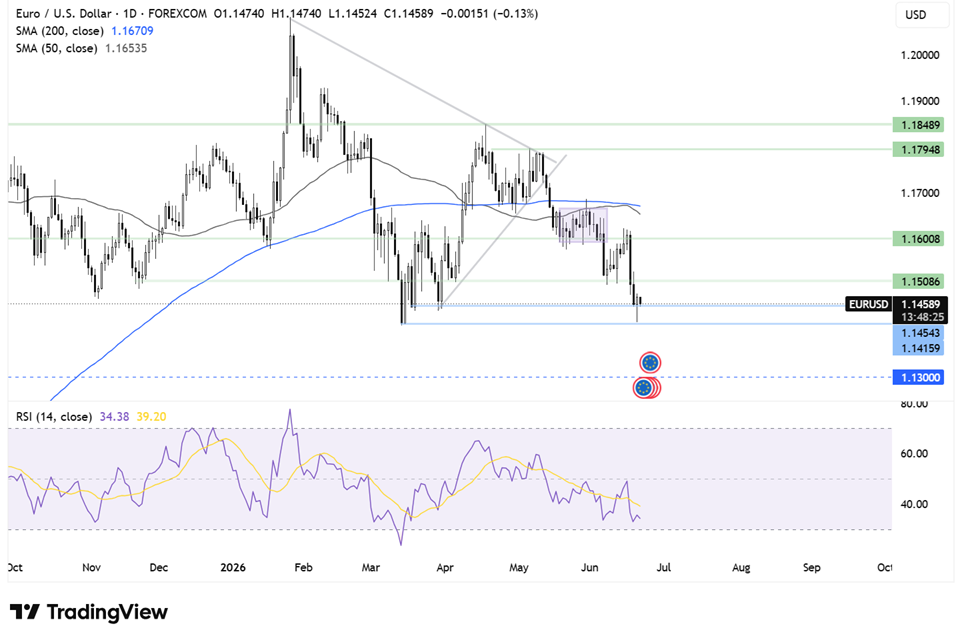
EUR/USD broke down from its symmetrical triangle pattern, falling below its 200 SMA and dropping to a low of 1.1410. This, combined with the RSI below 50, keeps sellers hopeful of further downside.
Immediate support can be seen at 1.1450, with a break below opening the door to 1.1400. Sellers will be looking to take out this level to create a lower low and extend the decline towards 1.1300.
Buyers may be encouraged by the long lower wick on Friday’s candle, suggesting demand emerged at lower levels. The hammer candlestick could signal a reversal. In that scenario, buyers would need to rise above 1.1500 to bring 1.1600 into focus, before exposing the 200 SMA at 1.1670.


