The main category of All News Articles.
You can use the search box below to find what you need.
[wd_asp id=1]
The main category of All News Articles.
You can use the search box below to find what you need.
[wd_asp id=1]
The Japanese Yen has struggled to build on recent gains despite expectations for further Bank of Japan policy tightening, but MUFG believes investors are overlooking a structural shift that could provide significant long-term support for the currency.
The US Dollar to Japanese Yen exchange rate (USD/JPY) traded close to recent cyclical highs on Friday, with the Yen remaining under pressure from higher oil prices and resilient US economic data.
MUFG argues that the Yen’s recent weakness masks an important structural change in Japanese investment behaviour, as the Government Pension Investment Fund (GPIF) and other institutional investors steadily increase allocations to domestic assets.
“We would still argue that it marks a notable turning point from the Abenomics era.”
The bank believes Japan is gradually reversing the policies introduced more than a decade ago, when pension funds were encouraged to reduce domestic bond holdings in favour of overseas and riskier assets.
“There is though some evidence that flows have already started to shift.”
MUFG highlights a sustained increase in purchases of Japanese government bonds by trust banks since 2021, noting that the GPIF’s domestic bond allocation has already risen from 23.9% at the end of fiscal 2019 to 26.9% today.
If allocations eventually move towards 31%, MUFG estimates that could generate around ¥12 trillion of additional demand for Japanese government bonds, even before allowing for future growth in the pension fund.

MUFG believes the Bank of Japan now has an opportunity to reinforce this shift towards domestic investment.
“The BoJ now needs to show it is not constrained by the government.”
With household inflation expectations at their highest level since 2006, the bank argues that a September interest rate increase would strengthen confidence that policymakers remain committed to normalising monetary policy.
“Hiking in September would be the best way to do that and would go some way to helping turn the yen stronger.”
While geopolitical tensions in the Middle East and higher oil prices continue to support the US Dollar in the near term, MUFG believes Japan’s evolving pension investment strategy represents a significant longer-term positive for the Yen that markets have yet to fully price in.
Gold (XAU/USD) shows moderate gains on Friday, but remains close to the year-to-date lows, at the $3,940 area, with upside attempts capped below the $4,000 psychological level for now. The precious metal is set for a 3% weekly decline, as the resumed hostilities between the US and Iran and the higher Oil prices have offset the positive impact of lower US Treasury yields.
Bullion tumbled on Thursday as tensions in Iran escalated with US President Donald Trump threatening to target civilian infrastructure, like power plants and bridges. Tehran, in turn, flagged the closure of the Strait of Bab el-Mandeb, a move that would strangle Oil supply further and bring the global economy to the brink of recession.
XAU/USD trades remain on a bearish trend from February’s highs with no clear sign of a trend shift on the horizon, other than the bullish divergence in the Relative Strength Index (RSI). Momentum indicators in the 4-hour remain in bearish territory, with the mentioned RSI below 40 and the Moving Average Convergence Divergence (MACD) just below zero, suggesting that rallies will find sellers.
The psychological $4,000 level is holding bulls at the time of writing, closing the path towards the trendline resistance at $4,075 and mid-July highs in the $4,100 area. A clear break of these levels is needed to ease bearish pressure and shift the focus towards July’s peak, in the $4,200 area.
On the downside, the year-to-date low, at $3,941, remains at a short distance. Further down, the October 2025 low, at $3,886, emerges as the next target, ahead of the 127.2% Fibonacci extension of the late-June downleg, at the $3,830 area.
(The technical analysis of this story was written with the help of an AI tool. Know more.)
Gold has played a key role in human’s history as it has been widely used as a store of value and medium of exchange. Currently, apart from its shine and usage for jewelry, the precious metal is widely seen as a safe-haven asset, meaning that it is considered a good investment during turbulent times. Gold is also widely seen as a hedge against inflation and against depreciating currencies as it doesn’t rely on any specific issuer or government.
Central banks are the biggest Gold holders. In their aim to support their currencies in turbulent times, central banks tend to diversify their reserves and buy Gold to improve the perceived strength of the economy and the currency. High Gold reserves can be a source of trust for a country’s solvency. Central banks added 1,136 tonnes of Gold worth around $70 billion to their reserves in 2022, according to data from the World Gold Council. This is the highest yearly purchase since records began. Central banks from emerging economies such as China, India and Turkey are quickly increasing their Gold reserves.
Gold has an inverse correlation with the US Dollar and US Treasuries, which are both major reserve and safe-haven assets. When the Dollar depreciates, Gold tends to rise, enabling investors and central banks to diversify their assets in turbulent times. Gold is also inversely correlated with risk assets. A rally in the stock market tends to weaken Gold price, while sell-offs in riskier markets tend to favor the precious metal.
The price can move due to a wide range of factors. Geopolitical instability or fears of a deep recession can quickly make Gold price escalate due to its safe-haven status. As a yield-less asset, Gold tends to rise with lower interest rates, while higher cost of money usually weighs down on the yellow metal. Still, most moves depend on how the US Dollar (USD) behaves as the asset is priced in dollars (XAU/USD). A strong Dollar tends to keep the price of Gold controlled, whereas a weaker Dollar is likely to push Gold prices up.
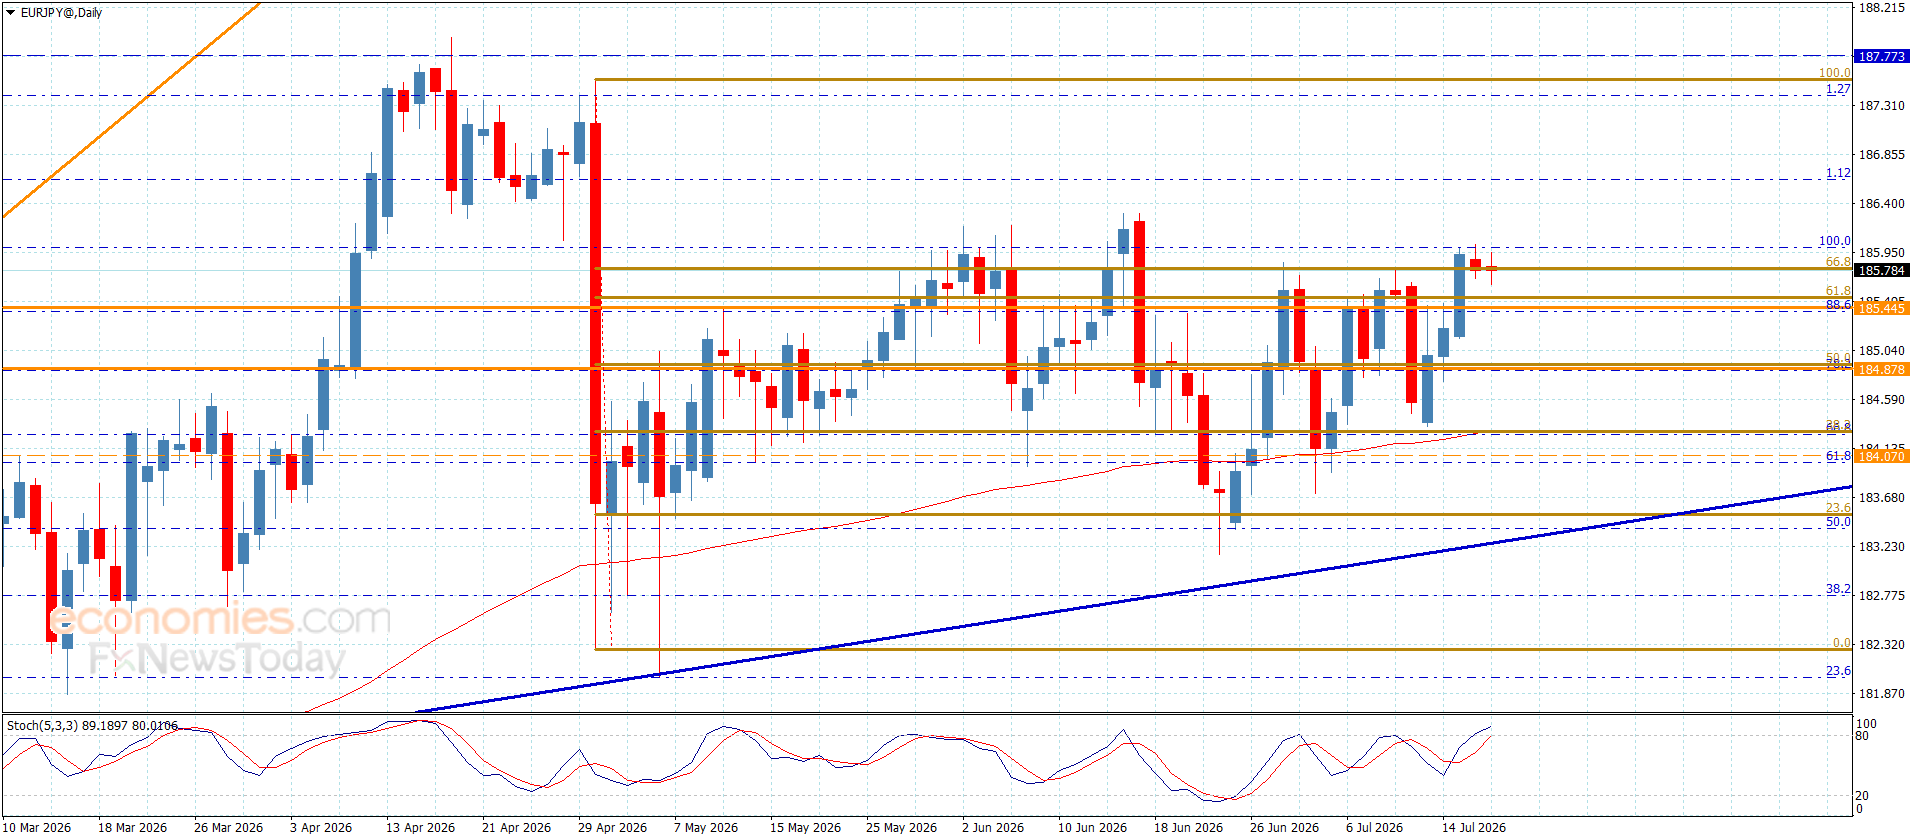
The EURJPY pair reached 286.00 level in its last bullish rally, forcing it to form some corrective waves, holding near 185.65 level, this rebound will not affect the previously suggested bullish trend, depending on forming main support at 184.35 level, besides forming a new extra support against the bullish attempts at 185.15.
Therefore, we will keep waiting for gathering the required extra positive momentum to form a strong bullish rally, to reinforce the chances of reaching positive stations that are located near 186.25 and 186.60.
The expected trading range for today is between 185.15 and 186.25
Trend forecast: Bullish
Domestic coffee prices today
The average coffee price in the domestic market today was recorded at 96,200 VND/kg, down 2,200 VND/kg compared to the previous update.
In Dak Lak, coffee prices were recorded at 96. 200 VND/kg, down 2,200 VND/kg. Gia Lai also had the same price of 96. 200 VND/kg, down 2,200 VND/kg.
In Lam Dong, coffee prices were at 95,700 VND/kg, down 2,200 VND/kg and the lowest level among the surveyed areas.
The old Dak Nong area continued to have the highest price, reaching 96,300 VND/kg, down 2,200 VND/kg compared to the previous update.
Although it has left the near-100,000 VND/kg zone, the domestic coffee price level is still maintained at a high level compared to the beginning of July.
World coffee prices
According to the updated table on July 17, world coffee prices continue to be under adjustment pressure on both the London and New York exchanges.
On the London exchange, the September 2026 Robusta futures contract fell 114 USD/ton, equivalent to 2.91%, to 3.797 USD/ton.
During the session, this contract at one point reached 3,898 USD/ton but then fell to the lowest level of 3,776 USD/ton. Trading volume reached 8,026 lots.
Robusta for November 2026 delivery fell 117 USD/ton, equivalent to 3.03%, to 3,747 USD/ton.
The January and March 2027 terms decreased by 119 USD/ton and 118 USD/ton respectively, to 3,709 USD/ton and 3,675 USD/ton.
On the New York exchange, Arabica also fell sharply. September 2026 Arabica futures fell 14.15 US cents/lb, equivalent to 4.33%, to 312.60 US cents/lb.
Arabica December 2026 futures fell 12.70 US cents/lb, or 4.10%, to 297.25 US cents/lb.
The March and May 2027 terms decreased by 12.40 US cents/lb and 12.10 US cents/lb respectively, to 291.15 US cents/lb and 289.35 US cents/lb.
Coffee price assessment
Domestic coffee prices are currently still hovering around the 96,000 VND/kg range, although they have been significantly adjusted compared to the nearly 100,000 VND/kg range before. This development shows that the market is still at a high level, but the downward pressure from the world market is clearer.
In the short term, domestic coffee prices are often affected by developments on the two international exchanges, exchange rates and trading activities of export businesses. The fact that Robusta and Arabica both decreased in the latest update may make domestic trading sentiment more cautious.
The National Center for Hydro-Meteorological Forecasting predicts that in July, the Central Highlands region will have many days of showers and thunderstorms, with days of moderate to heavy rain, with rain concentrated in the afternoon and night. The weather in the Central Highlands should not be understood as a factor causing immediate supply shortage, but as a risk that needs to be monitored for plant care and product quality in high humidity conditions.
From a global supply-demand perspective, the International Coffee Organization (ICO) said that the average ICO aggregate price index for May 2026 reached 256.05 US cents/lb, down 3.8% compared to the previous month, in the context of market reactions with expectations of more abundant supply.
For Brazil, the Foreign Agricultural Services Agency of the US Department of Agriculture (USDA/FAS) quoted a forecast from the Brazilian National Supply Company as saying that Brazil’s coffee production in the 2026-2027 crop year may reach 66.7 million bags, an increase of 18% compared to 2025. The prospect of a large crop in Brazil continues to be a factor that could put pressure on Arabica prices in the medium term.
For Robusta, supply from Vietnam is still an important factor. The USDA/FAS Coffee Annual report in Vietnam forecasts Vietnam’s coffee production in the 2026-2027 crop year to reach 32.5 million bags converted to green beans, thanks to production expansion after a period of high coffee prices.
Vietnam is the world’s largest Robusta producer, so the prospect of increased production may put pressure on Robusta in the medium term. However, in the short term, prices may still fluctuate sharply due to developments on the London exchange, inventory, export demand and weather in major production areas.
The Italian bank says expectations that Andy Burnham will appoint a fiscally conservative Chancellor have created a potential “wind of change” for UK assets, easing concerns over public finances and providing support for the Pound.
GBP/USD was trading around 1.3450 on Friday after rising more than 1.7% in July, recovering from June’s decline and moving back above the 1.35 area earlier in the week.
UniCredit says Sterling’s recent strength has been driven by expectations surrounding the incoming UK government and, in particular, the choice of Chancellor.
Reports that current Home Secretary Shabana Mahmood is the frontrunner for the role have reduced market concerns that Burnham could pursue a more expansionary fiscal approach.
The bank argues that fiscal credibility has become a crucial factor for investors following recent concerns over rising UK borrowing needs.
A more conservative approach to government finances could reduce pressure on gilt markets and improve confidence in Sterling.
UniCredit highlights the reaction in UK government bonds as an important indicator of improving market sentiment.
Following reports on the expected Chancellor appointment, gilts rallied, with the 10-year UK yield falling below 4.92% after reaching close to 5.20% in May.
The bank notes that concerns over UK fiscal policy had previously pushed gilt yields higher and weighed on the Pound.
However, current market conditions are very different from the September 2022 mini-budget crisis, when unfunded tax cuts triggered a sharp sell-off in UK assets and sent GBP/USD to record lows.
UniCredit believes the recent improvement in sentiment could allow further Sterling gains if expectations around the new government are confirmed.
The bank notes that GBP/USD has already moved above 1.35 for the first time since May, while EUR/GBP has fallen below 0.85 to multi-year lows.
Technical indicators suggest GBP/USD could target 1.37 if positive sentiment continues.
However, UniCredit cautions that it is still too early to determine whether this represents a lasting shift in investor positioning or simply a short-term reaction to political developments.
Another factor supporting Sterling is the possibility that markets continue pricing a Bank of England rate increase later this year.
UniCredit says that if expectations of a November rate hike remain in place, the summer period could prove far less damaging for Sterling than political uncertainty earlier in the year had suggested.
A combination of improved fiscal confidence, stronger gilt performance and supportive rate expectations could therefore provide further support for the Pound.
UniCredit sees scope for GBP/USD to extend its recovery if the improving political backdrop is sustained.
The bank highlights 1.37 as the next potential target for the pair, while acknowledging that further gains depend on continued investor confidence in the new UK government’s fiscal approach.
With GBP/USD currently near 1.3450, Sterling has already recovered significantly from its June lows, but UniCredit believes the recent political shift could provide further upside momentum.
Why is UniCredit positive on the Pound?
UniCredit believes expectations of a fiscally conservative UK Chancellor could improve investor confidence, support gilts and reduce concerns over government borrowing.
What is UniCredit’s GBP/USD target?
The bank highlights 1.37 as a potential next target for GBP/USD if positive market sentiment continues.
Why are UK gilts important for Sterling?
Gilt yields and demand from investors are closely linked to confidence in UK fiscal policy. Stronger gilt performance can support the Pound by reducing concerns over government finances.
Could political uncertainty still hurt GBP/USD?
Yes. UniCredit says it is too early to confirm whether the recent move represents a lasting change in sentiment, meaning Sterling remains sensitive to developments surrounding the new government.
The central bank of Chile, the world’s largest copper producer, recently lowered its 2026 economic growth forecast, but it raised its average copper price forecast to US$5.90 per pound. The change reflects strong global demand and limited mine supply. It also shows that copper remains one of the world’s strongest commodity markets, even as economic growth slows.
As the biggest producer, Chile has a major influence on global copper supply. Copper is essential for power grids, electric vehicles (EVs), renewable energy, battery storage, and AI data centers. Higher prices could benefit mining companies while supporting the industries driving the global energy transition.
Chile’s latest forecast shows confidence in the copper market. The central bank expects copper to average US$5.90 per pound in 2026, before easing to US$5.20 in 2027 and US$5.00 in 2028.
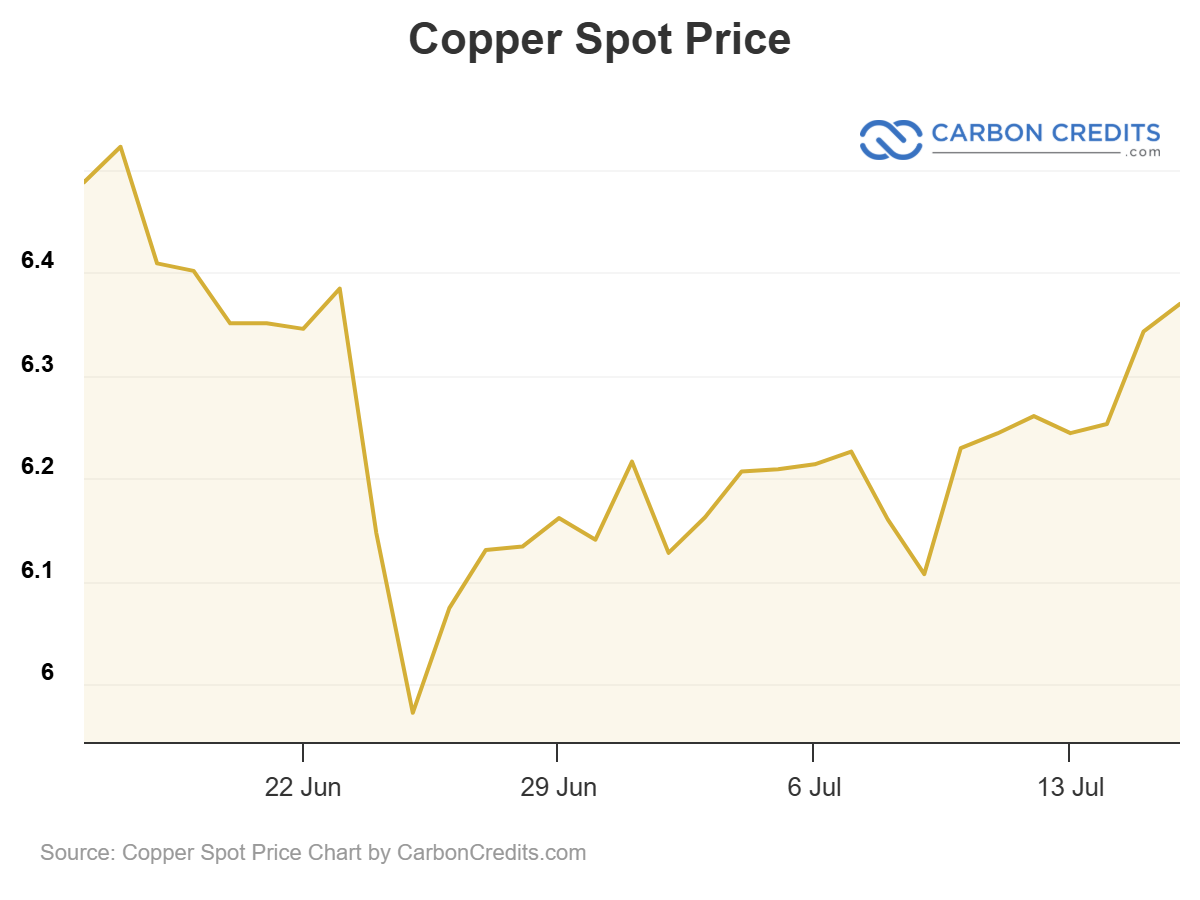
Even with slower economic growth, officials believe demand will stay strong because the world still needs more copper for clean energy and new technology.
Chile’s Copper Commission (Cochilco) shares that view. Earlier this year, it also raised its copper price outlook. The agency said prices are being supported by tight global supply and growing demand from renewable energy, electric transport, and digital infrastructure.
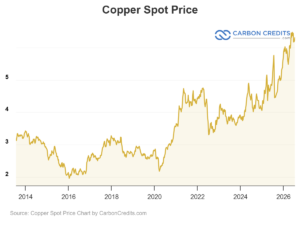
Copper prices have seen some ups and downs over the past year. However, they remain well above their historical average. Analysts say the market is now being driven more by long-term demand than by short-term economic swings.
Copper has become one of the world’s most important metals.
According to the International Energy Agency (IEA), power grids will create the largest increase in copper demand over the coming decades. Countries need thousands of kilometers of new transmission lines to connect renewable energy projects and meet rising electricity demand.
Electric vehicles also use much more copper than traditional cars. The IEA estimates that a battery-powered EV needs about 2.5x more copper than a gasoline-powered vehicle. Wind turbines, solar farms, and battery storage systems also require large amounts of the metal.
Artificial intelligence is adding even more demand. AI data centers need transformers, substations, cooling systems, backup power, and large networks of electrical cables. All of these use copper.
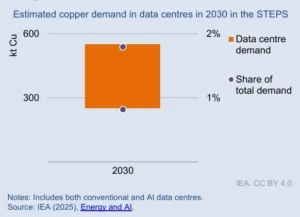
The IEA expects electricity use by data centers around the world to more than double by 2030, reaching about 945 terawatt-hours (TWh) each year. That is roughly equal to Japan’s total annual electricity use today. Most of the increase will come from AI.
As companies like Google, Microsoft, Amazon, and Meta build more AI data centers, demand for copper will keep growing.
Chile remains the world’s biggest copper producer.
According to the U.S. Geological Survey (USGS), Chile produced about 5.3 million metric tonnes of copper in 2025. That was about one-quarter of global mine production.
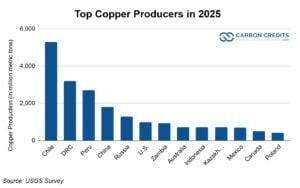
The country’s biggest mines include Escondida, Collahuasi, and Codelco. Together, they supply copper to manufacturers around the world.
Cochilco expects Chile’s annual copper production to reach about 5.54 million metric tonnes by 2034. However, growth is likely to be slow. Many older mines now produce lower-grade ore. New mining projects are also becoming more expensive and take longer to develop.
Chile’s state-owned miner Codelco recently said its production is expected to stay close to current levels over the next few years instead of reaching its long-term target of 1.7 million metric tonnes a year by 2030.
Bernardo Fontaine, Codelco Chairman, remarked:
“It is very possible that it sits at a production rate quite similar to the one it has today.”
The company is still recovering after output fell to its lowest level in more than 20 years during 2022 and 2023. Production from its own mines reached 1.33 million metric tonnes last year.
Fontaine further said several major expansion projects have faced unexpected delays and higher costs as it works to offset declining ore grades. The company also sees the El Abra mine, where it owns a 49% stake alongside Freeport-McMoRan, as a promising project for future investment. Freeport plans to invest US$7.5 billion to expand the mine.
With demand rising and supply growing slowly, many analysts believe copper prices could remain strong for years to come.
While demand keeps growing, copper supply is not rising as fast.
Many of the world’s largest copper mines are getting older. As ore grades fall, companies must process more rock to produce the same amount of copper. That increases both costs and energy use.
New mines also take a long time to build. According to the IEA, developing a new copper mine can take 15 to 20 years from discovery to production. Permitting, financing, and environmental reviews all add time to the process.
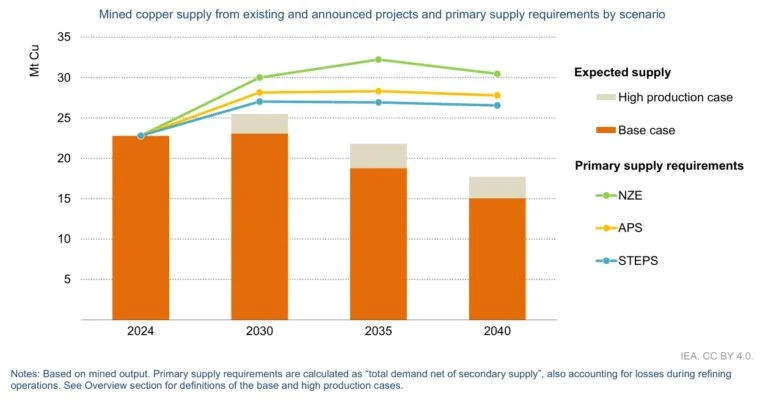
The International Copper Study Group (ICSG) expects global mine production to increase over the next few years. However, many analysts believe that growth will still fall short of future demand because of project delays, lower ore grades, and rising costs.
Copper is now at the center of the clean energy transition.
The IEA estimates that clean energy technologies could account for almost half of global copper demand by 2040 under a pathway that reaches net-zero emissions by 2050. That includes electric vehicles, renewable power, battery storage, electricity networks, and hydrogen projects.
Power grids will need the biggest investment. The World Bank estimates that global electricity networks must expand rapidly to support cleaner energy and growing electricity demand. Every new transmission line, transformer, and substation requires large amounts of copper.
The rapid growth of AI is adding another layer of demand. New data centers require huge amounts of electrical equipment before they can even begin operating. As more countries build AI infrastructure, copper demand is expected to remain strong.
Strong copper prices may also encourage companies to invest in new projects. The challenge is timing.
Even if companies approve new projects today, many will not begin producing copper until the next decade. That means supply could remain tight while demand continues to grow.
According to S&P Global, global copper demand could nearly double, from 28 million metric tons a year in 2025 to 42 million metric tons by 2040. This is driven mainly by electrification, clean energy, AI, and digital technologies. Meeting that demand will require major investment across the mining sector.
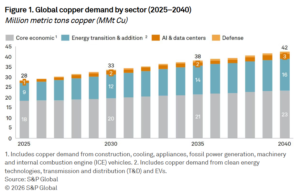
Copper’s long-term outlook remains positive, but risks still exist. A weaker global economy could reduce industrial demand in the short term. Trade tensions and changing government policies may also create periods of price volatility.
However, most market analysts expect the long-term trend to remain strong because the world cannot expand clean energy without more copper.
Chile’s latest forecast reflects that reality. Even as economic growth slows, the country expects copper prices to stay well above historical levels because demand continues to outpace supply.
As countries build more renewable power, modernize electricity grids, expand AI infrastructure, and produce more electric vehicles, demand for copper is likely to remain strong for many years. That is why many analysts believe today’s high prices may be part of a much longer market cycle rather than a short-term rally.
The article covers the following subjects:
Consider long positions from corrections above 161.55 with a target of 166.50–170.00.
Breakout and consolidation below 161.55 will allow the pair to continue declining to the levels of 159.86–158.90.
On the weekly time frame, an ascending third wave of larger degree 3 has formed, a downward correction has been completed as the fourth wave 4, and the fifth wave 5 is developing. On the daily chart, the third wave of smaller degree (3) of 5 appears to be developing, with wave 3 of (3) forming as its part. On the H4 time frame, wave i of 3 has formed, a local correction has been completed as wave ii of 3, and wave iii of 3 is developing. If the presumption is correct, USD/JPY will continue to rise to 166.50–170.00. The level of 161.55 is critical in this scenario as a breakout below it will enable the pair to continue declining to the levels of 159.86–158.90.
This forecast is based on the Elliott Wave Theory. When developing trading strategies, it is essential to consider fundamental factors, as the market situation can change at any time.
The content of this article reflects the author’s opinion and does not necessarily reflect the official position of LiteFinance broker. The material published on this page is provided for informational purposes only and should not be considered as the provision of investment advice for the purposes of Directive 2014/65/EU.
According to copyright law, this article is considered intellectual property, which includes a prohibition on copying and distributing it without consent.
At 5:50 a.m. Eastern Time today, oil was priced at $86.09 per barrel with Brent serving as the benchmark (we’ll explain different benchmarks later in this article). That’s an increase of $1.45 compared with yesterday morning and around $16 higher than the price one year ago.
It’s impossible to forecast oil prices with detailed precision. Many different elements affect the market, but ultimately it boils down to supply and demand. When worries about economic recession, war, and other large-scale disruptions increase, oil’s path can shift fast.
Gas prices at the pump don’t only track crude oil. They also include what it takes to refine and move that fuel, the taxes layered on top, and the extra markup your local station adds to stay in business.
Since crude oil generally makes up a majority of the per-gallon cost, changes in its price have an outsized impact. When oil surges, gas prices typically rise in tandem. But when oil retreats, gas prices often lag on the way down, a trend sometimes described as “rockets and feathers.”
In case of emergency, the U.S. has a store of crude oil known as the Strategic Petroleum Reserve. Its primary purpose is energy security in case of disaster (think sanctions, severe storm damage, even war). But it can also go a long way toward softening crippling price hikes during supply shocks.
It’s not a long-term answer and is more meant to provide temporary relief, assisting consumers and keeping critical parts of the economy running, like key industries, emergency services, public transportation, etc.
Both oil and natural gas are key sources of the energy we use every day. Because of this, a big change in oil prices can affect natural gas. For example, if oil prices increase, some industries may swap natural gas for some segments of their operations where possible, which increases demand for natural gas.
To gauge oil’s performance, we often turn to two benchmarks:
Between these two, Brent better represents global oil performance because it prices much of the world’s traded crude. And, it’s often the best way to track historical oil performance. In fact, even the U.S. Energy Information Administration now uses Brent as its primary reference in its Annual Energy Outlook.
Looking at the Brent benchmark across several decades, oil has been anything but steady. It’s seen spikes due to factors such as wars and supply cuts, and it’s also seen crashes from global recessions and an oversupply (called a “glut”). For example:
All to say, oil’s historical performance has been anything but smooth. Again, it’s hugely affected by wars, recessions, OPEC whims, evolving energy initiatives and policies, and much more.
Looking to stay up-to-date regarding the latest energy developments? Check out our recent coverage:
The current price of oil per barrel depends largely on supply and demand, including news about potential future supply and demand (geopolitics, decisions made by OPEC+, etc.). In the U.S., prices also move based on how friendly an administration is to drilling, as it can affect future supply. For example, 2025 saw the Trump administration move to reopen more than 1.5 million acres in the Coastal Plain of the Arctic National Wildlife Refuge for oil and gas leasing, reversing the Biden administration’s policy of limiting oil drilling in the Arctic.
The price of oil updates constantly when the “futures” markets are open. A futures market is effectively an auction where people agree to buy or sell oil in the future. As long as people and companies are trading contracts, the oil price is changing.
In short, shale is rock that contains oil and natural gas. Think of shale as energy yet to be tapped. The more shale the U.S. accesses, the more energy we’ll have—and the more easily oil prices can keep from spiking as much thanks to a greater supply.
When oil is expensive, it tends to make everyday items cost more. This can be related to energy (your heating, gas utilities, etc.), but it’s also due to the logistics involved with making those items accessible to you. Shipping, for example, can affect the price of things at the grocery store, as it’s more expensive to get those products from warehouses and farms onto the shelf.
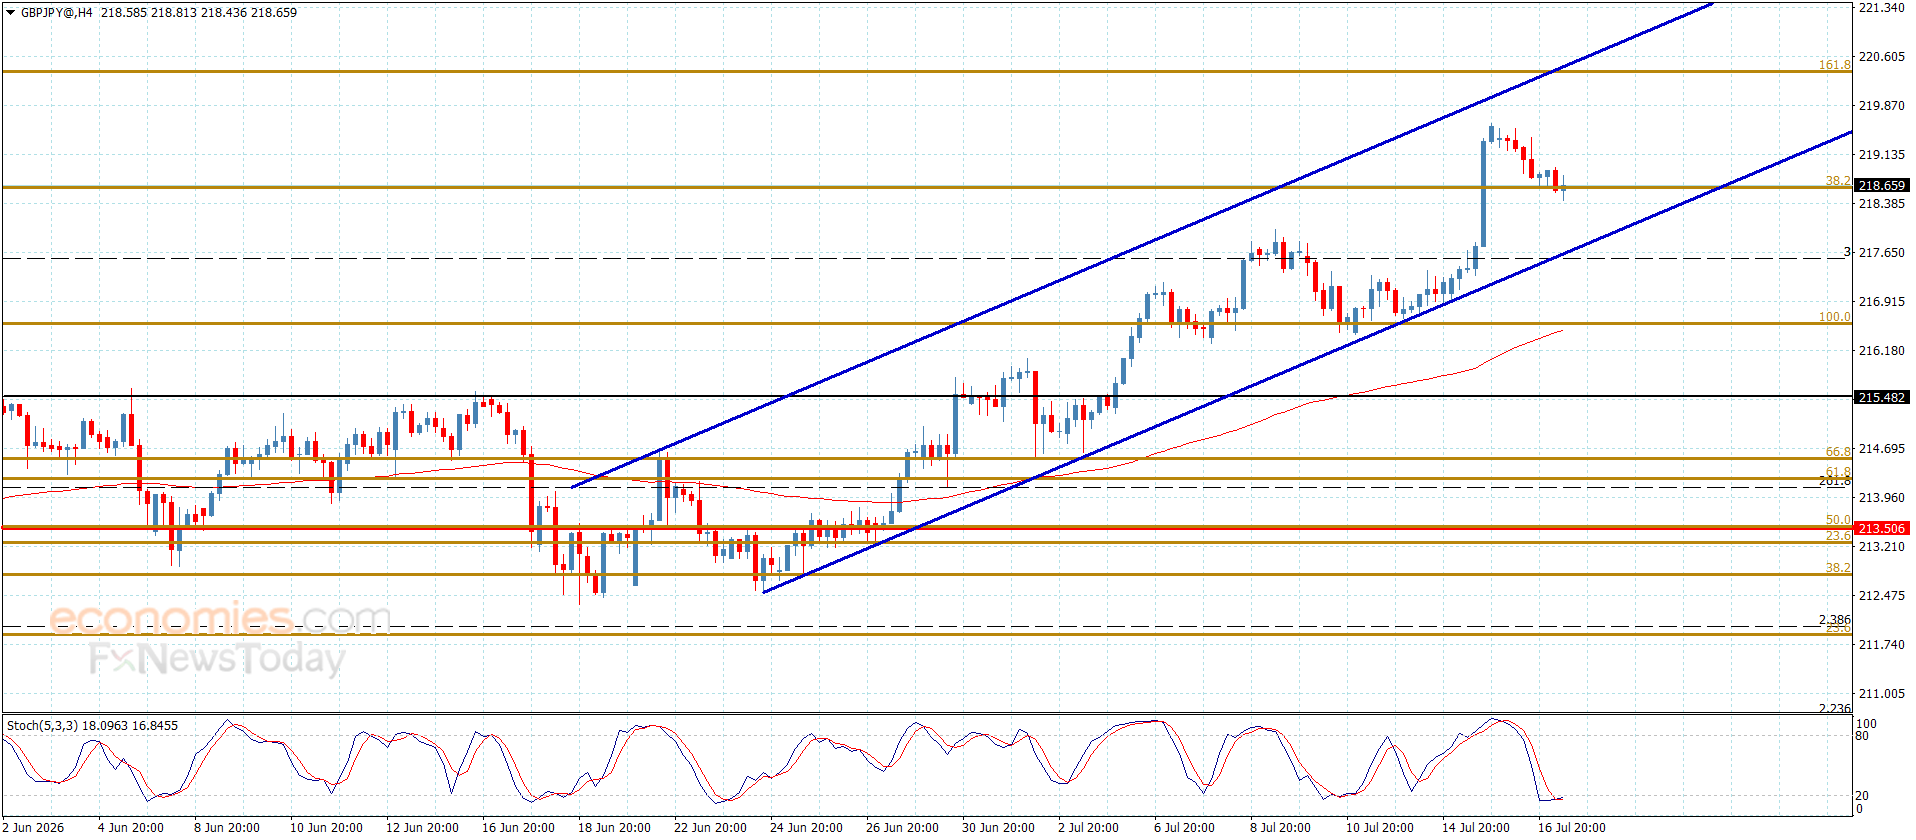
The GBPJPY pair lost the bullish momentum yesterday after recording 219.25 level, which forces it to activate the attempts of gathering gains, forming some negative corrective trading by reaching 218.45.
The price keeps forming corrective trading, attempting to test 217.90 level reaching the bullish channel’s support at 217.65, it will not affect the main bullish scenario, depending on forming main support at 216.30 level against the bullish trading.
The expected trading range for today is between 217.90 and 219.20
Trend forecast: Fluctuating within the bullish trend.
The article covers the following subjects:
Consider long positions from corrections above 70.40 with a target of 91.80–105.17.
Breakout and consolidation below 70.40 will allow the asset to continue declining to the levels of 62.00–58.50.
A descending correction appears to have formed as the second wave of larger degree (2) on the weekly chart, with wave C of (2) completed as its part. On the daily time frame, an ascending third wave (3) is likely developing. Within it, the first wave of smaller degree 1 of (3) has formed, a downward correction has been completed as the second wave 2 of (3), and wave 3 of (3) has started forming. Wave i of 3 is likely forming on the H4 chart, with wave (iii) of i unfolding as its part. If the presumption is correct, WTI will continue to rise to 91.80–105.17. The level of 70.40 is critical in this scenario as a breakout below it will enable the asset to continue declining to the levels of 62.00–58.50.
This forecast is based on the Elliott Wave Theory. When developing trading strategies, it is essential to consider fundamental factors, as the market situation can change at any time.
The content of this article reflects the author’s opinion and does not necessarily reflect the official position of LiteFinance broker. The material published on this page is provided for informational purposes only and should not be considered as the provision of investment advice for the purposes of Directive 2014/65/EU.
According to copyright law, this article is considered intellectual property, which includes a prohibition on copying and distributing it without consent.