
Category: Crypto News, News
SOL breakout fuels optimism amid ETF buzz
- Solana price breaks above its descending trendline, indicating a potential shift to an upward trend.
- REX Shares files for a Solana staking ETF with the SEC, signaling that a launch could be on the horizon.
- Technical outlook turns bullish, with SOL eyeing a rally toward the $184 resistance level and beyond.
Solana (SOL) price trades around $151 at the time of writing on Monday, after breaking above its descending trendline last week, suggesting an upward trend ahead. REX Shares files for a Solana staking ETF with the US Securities and Exchange Commission (SEC), signaling that a launch could happen soon. The technical outlook suggests a rally, targeting levels above $180.
Is Solana ETF coming soon?
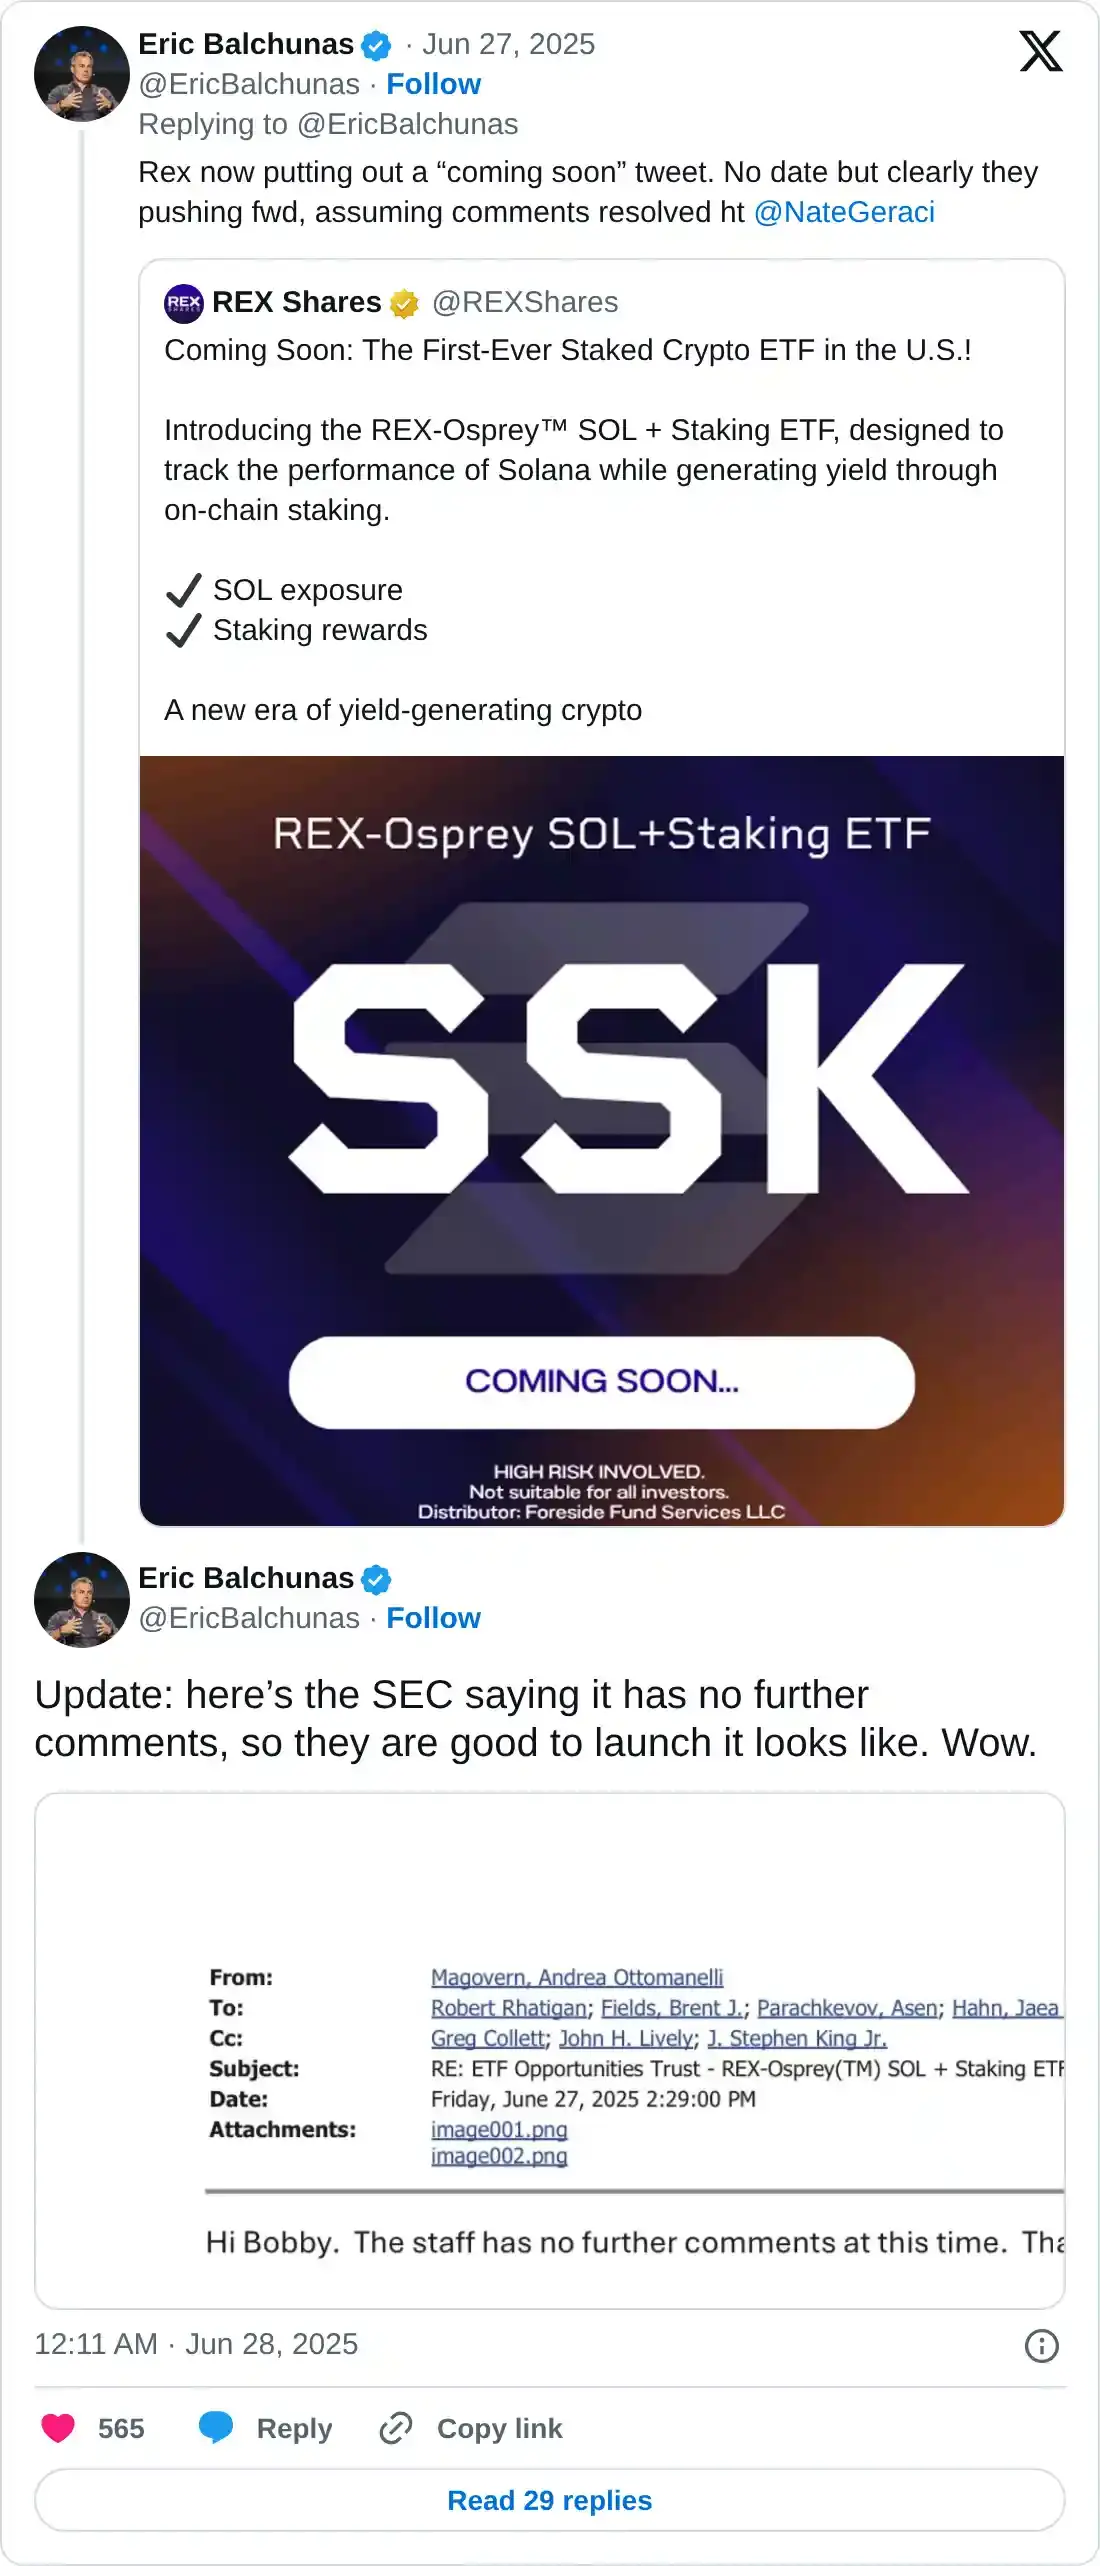
REX Shares posted on its X account on Saturday that its REX-Osprey SOL and staking ETF is designed to track the performance of Solana while generating yield through onchain staking and will be launched soon.

Eric Balchunas, Senior ETF Analyst for Bloomberg, also posted on X on the same day that the
Rex has just filed a letter with the US SEC, asking if comments have been resolved for their ‘40 Act Solana Staking ETF.
Balchunas posted: “They’re no doubt trying to get it to mkt ahead of the spot ones.”
He also cited an email screenshot to confirm that REX Shares has addressed the SEC’s comments.
“So they are good to launch, it looks like. Wow,” Balchunas added.

Solana Price Forecast: SOL breakout of the descending trendline
Solana price broke out and closed above the descending trendline (drawn by connecting multiple highs since May 24) on Saturday and rallied to close above its 50-day Exponential Moving Average (EMA) at $151.48 the next day. At the time of writing on Monday, it hovers around the 50-day EMA level at $151.48.
If SOL continues its upward trend, it could extend the rally toward its daily resistance level at $160. A successful close above this level could extend additional gains to retest its next daily resistance at $184.13.
The Relative Strength Index (RSI) on the daily chart reads 52, above its neutral level of 50, indicating that bullish momentum is gaining traction. The Moving Average Convergence Divergence (MACD) on the daily chart also displayed a bullish crossover on Saturday, providing a buy signal and indicating an upward trend.
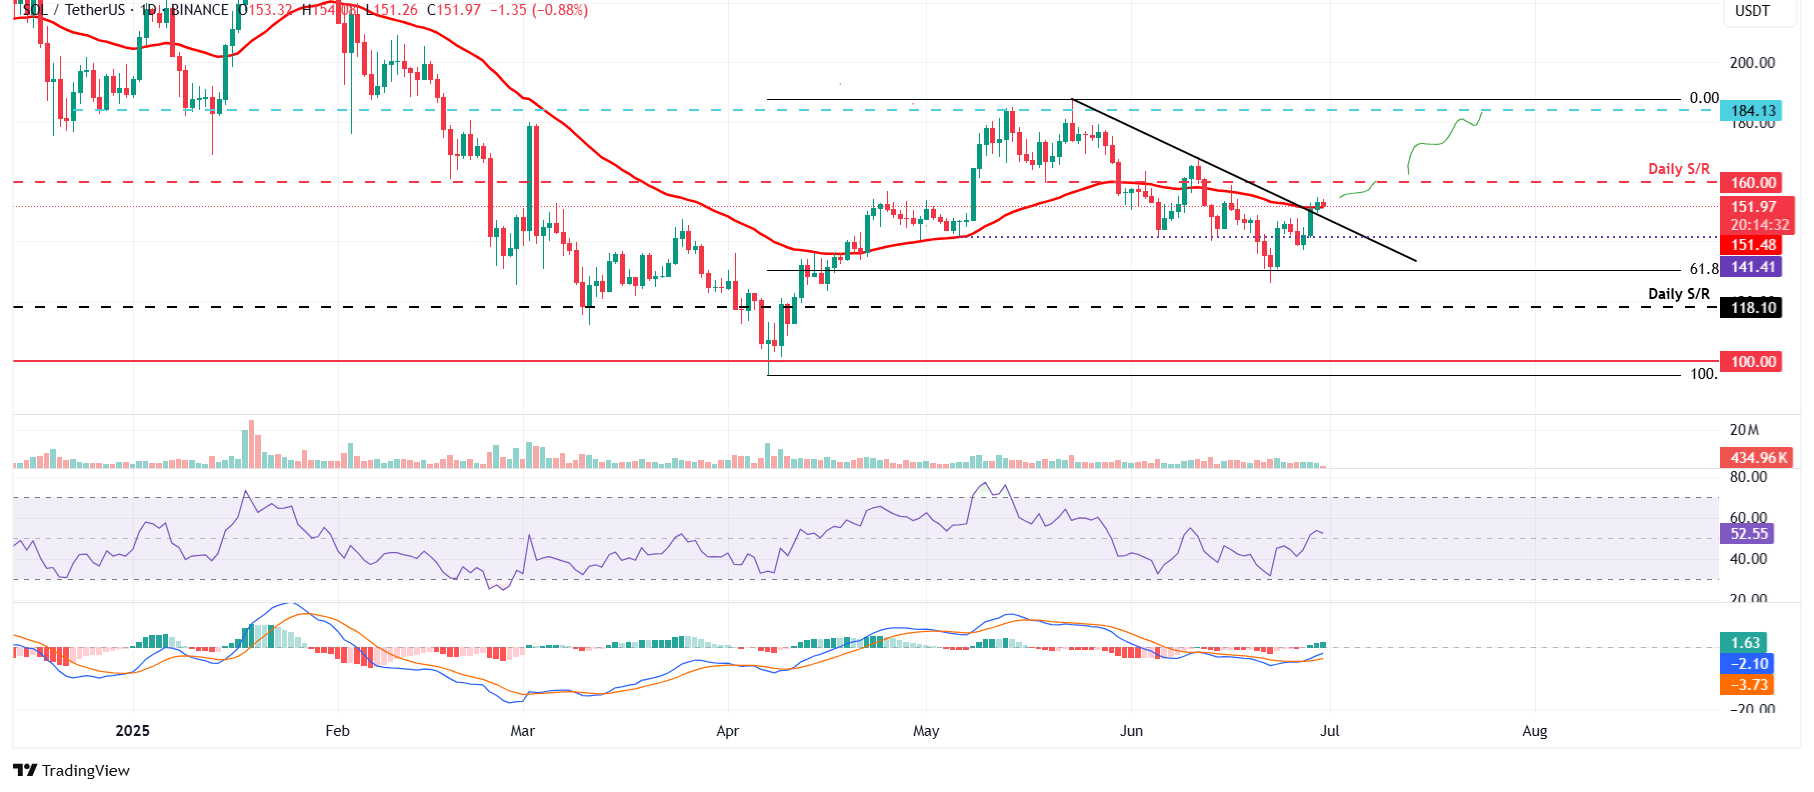
SOL/USDT daily chart
However, if SOL faces a correction, it could extend the decline toward its next support level at $141.41.


Written by : Editorial team of BIPNs
Main team of content of bipns.com. Any type of content should be approved by us.


Share this article: