
Category: Crypto News, News
Solana Price Prediction: SOL Eyes $145–$150 Rebound as Technicals and Inflows Align
Solana price is showing renewed strength as rising ETF inflows, improving technicals, and strong support levels set the stage for a potential upside move.
Momentum around Solana price is heating up in an interesting way. While the broader market has been shaky, SOL continues to show signs of strength, driven by steady inflows and improving technicals.

Solana ETF Inflows Show Relentless Strength
Solana is showing renewed strength as a combination of rising spot-ETF inflows, supportive technical indicators, and well-defined price levels begin aligning in its favor. Although broader market sentiment has been mixed, SOL’s ability to attract consistent institutional demand sets it apart from many major altcoins during this period of volatility.
Solana spot ETFs have recorded 20 straight days of net inflows, signaling strong institutional accumulation despite recent market volatility. Source: Kyle Chassé via X
Recent on-chain and fund-flow data suggest that this demand may not be incidental. Multiple independent market analysts have highlighted that Solana ETFs have recorded 20 consecutive days of net inflows, an uncommon streak that often reflects sustained, thesis-driven accumulation rather than short-term speculative positioning. In a market currently searching for direction, these steady inflows provide a tangible signal of confidence and help reinforce the foundation beneath SOL’s price action.
Solana Price Eyes Higher Resistance Levels
In the technical camp, Crypto Tony mapped out a clean projection showing Solana price potentially pushing towards the $145–$150 resistance zone. Price is currently rebounding from the lower range, holding the $138–$140 support, and the short consolidation on the chart suggests bulls may attempt another leg upward.


Solana is rebounding from key support and eyeing a move towards the $145–$150 resistance zone as bulls regain momentum. Source: Crypto Tony via X
A break above $150 would shift the Solana price structure decisively bullish and open space towards the $160 region, where the next strong supply zone sits.
Liquidation Heatmap Favors a Move Towards $145
Short-side liquidity is also stacking in interesting ways. According to CW8900’s heatmap, a heavy concentration of short liquidations sits right around $145, forming the next likely sweep level during any recovery move.
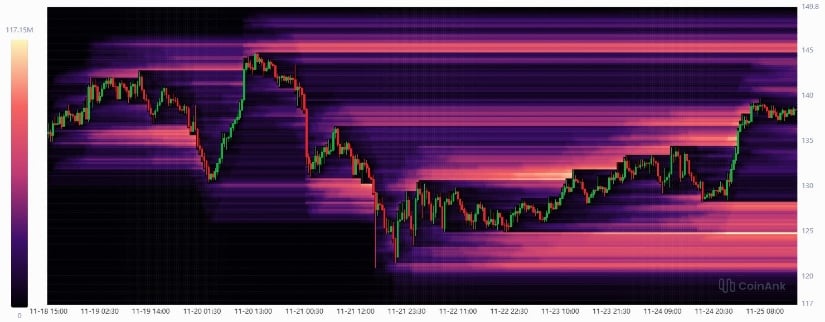
Short liquidations are heavily clustered around $145, creating a magnetic target for price during any recovery move. Source: CW8900 via X
With SOL Solana price stabilizing after its latest sell-off, these liquidity pockets act as magnets, and a push into the $145 liquidation zone becomes a realistic short-term target if momentum builds.
OBV Breaks Down Into Major Support
A notable indicator reading came from a famous crypto analyst, Income Sharks, who highlighted the OBV breaking its trendline and now resting exactly on a major support shelf. OBV rarely stays flat at key levels, and a base forming here often precedes a shift in volume flow back toward buyers.
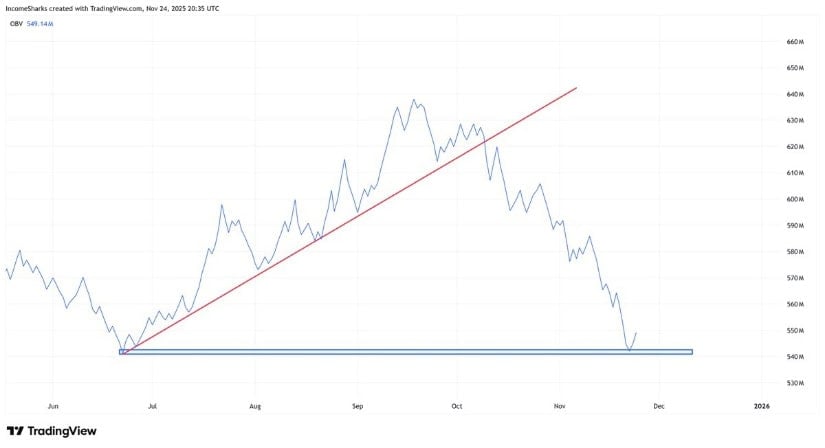
OBV has dropped into a major support shelf, signaling a potential volume shift back toward buyers if this base holds. Source: Income Sharks via X
With OBV sitting on one of its cleanest support levels in months, there’s room for volume to shift back in favor of buyers. If that happens, it would add a strong confirmation layer to any bounce forming on price action.
SOL Shows Strength Against BTC
Gordon’s SOL/BTC chart shows a clear basing pattern, with the pair holding and reacting off a rounded bottom formation. The neckline near the 0.0030 BTC level is the major barrier, and price is now pressing back towards it with improving momentum.
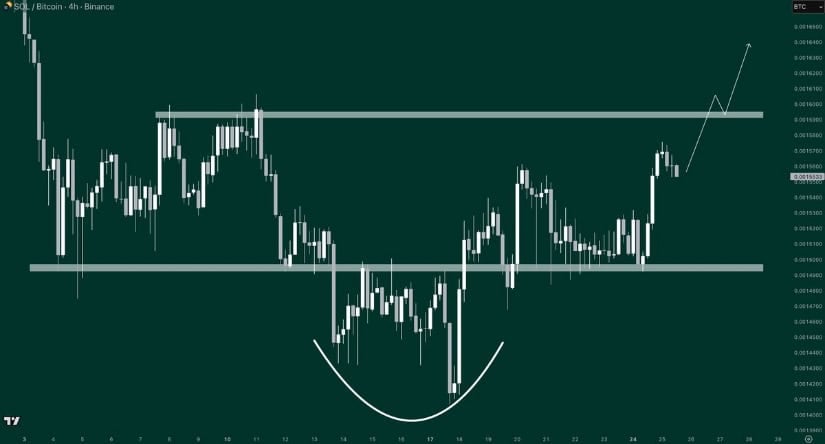
SOL/BTC is forming a rounded bottom and pressing towards the 0.0030 BTC neckline, signaling improving relative strength. Source: Gordon via X
A breakout above that neckline would confirm SOL outperforming Bitcoin in the short term, a shift that usually supports stronger USD upside as well. The relative strength coming through here is a notable sign that SOL may be preparing for a broader recovery cycle.
Final Thoughts
Solana price continues to show a blend of strong fundamentals and steady technical improvements. ETF Overall, Solana’s setup reflects an alignment of supportive factors rather than a single catalyst. Persistent ETF inflows continue to demonstrate institutional conviction, while technical indicators, such as OBV stabilizing at a major support level and the SOL/BTC pair showing renewed relative strength, point to improving market structure. These elements together create a more credible backdrop for a potential rebound than price action alone.
That said, short-term volatility remains a meaningful consideration. Any bullish continuation ultimately depends on buyers defending key support levels and maintaining the inflow trend that has underpinned SOL’s resilience. If these conditions hold, a move toward the $145–$150 zone becomes a reasonable technical expectation.

Written by : Editorial team of BIPNs
Main team of content of bipns.com. Any type of content should be approved by us.


Share this article: