
Category: Crypto News, News
Solana Price Prediction: SOL Holds Key $150 Zone, Eyeing Bullish Break Above $185 Resistance
Solana price hovers near a key support zone as rising ETF inflows and renewed buying interest hint at a potential bullish reversal in the making.
After extensive selling pressure, Solana price is starting to flash early recovery signs. SOL’s price action near the $150 to $160 range has caught traders’ attention, with rising ETF inflows hinting that institutional buyers may be positioning ahead of a potential rebound.

Solana current price is $167.51, up 0.11% in the last 24 hours. Source: Brave New Coin
SOL Structure Showing Local Bottom Formation
Solana’s higher timeframe structure is starting to look constructive after weeks of consistent declines. Altcoin Sherpa’s chart shows a potential local bottom forming between $150 to $160, a region that previously acted as a demand zone during earlier market retracements.

Solana forms a potential local bottom between $150–$160, with rising volume hinting at early accumulation as bulls look to regain control. Source: Altcoin Sherpa via X
Volume has begun to increase slightly near these lows, which could indicate early accumulation. While Sherpa notes that Bitcoin’s next move remains a key variable, Solana’s current base formation and stabilization pattern suggest that bulls may be quietly positioning for a rebound if broader sentiment improves.

ETF Inflows Strengthen the Bullish Outlook
Solana ETFs add further momentum to the bullish case. According to Rand’s data, SOL ETFs have recorded 10 consecutive days of inflows, signaling growing institutional interest and steady accumulation.

SOL ETFs see 10 straight days of inflows. Source: Rand via X
This consistent capital injection suggests that investors are treating Solana as a high-conviction altcoin, particularly given its expanding developer ecosystem and improving network metrics. Sustained ETF inflows often precede strong recovery phases, and with SOL hovering near key support, these flows could accelerate any rebound once broader market conditions turn favorable.
Solana price Inside a Major Long-Term Range
Immortal’s analysis zooms out to the SOL macro picture, noting that Solana price has now spent nearly 600 days trading within a defined range between $120 and $260. This prolonged consolidation typically builds significant energy for a larger directional breakout.
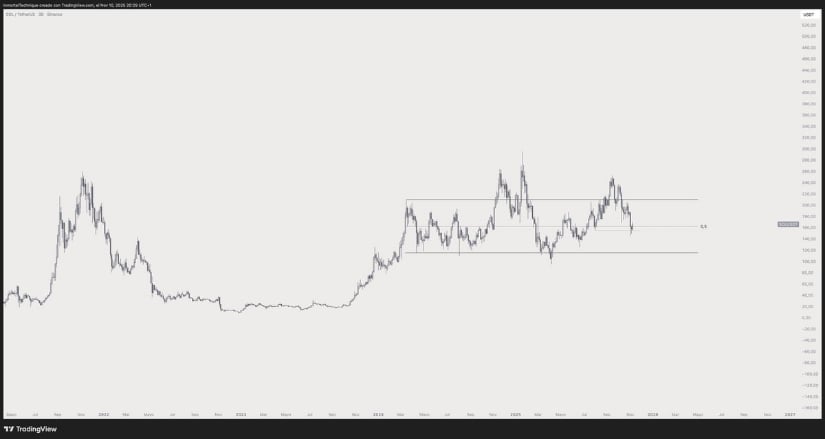
Solana has spent nearly 600 days consolidating between $120 and $260, building pressure for a potential breakout above the key $185 resistance. Source: Immortal via X
From a SOL’s technical standpoint, the range midpoint near $185 remains a pivotal level to reclaim. A decisive move above that resistance could open the door to a sustained rally, with potential to retest the $250 to $260 highs. The longer this compression continues, the stronger the eventual breakout impulse is likely to be.
Short-Term Structure Points to a Relief Rally
The 4H chart captures Solana price bouncing from a clear rising trendline, showing early signs of a short-term recovery setup. The structure forms a higher low pattern, with immediate resistance situated around $175 to $180.
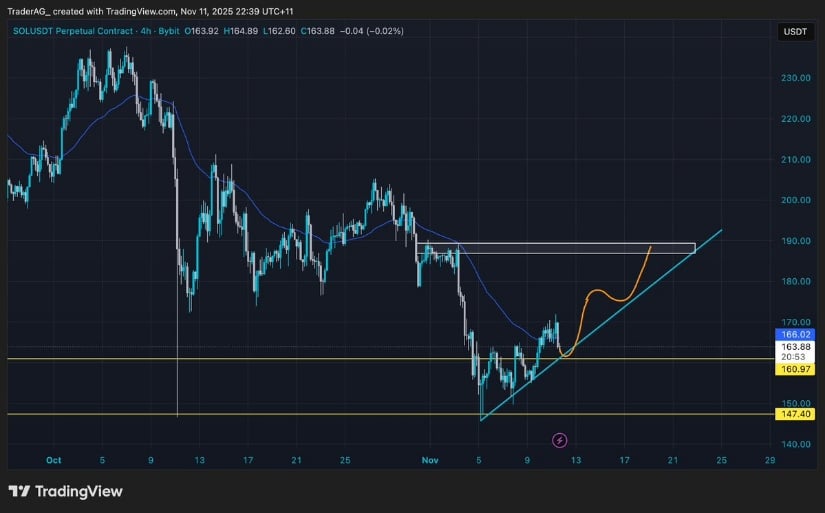
SOL rebounds from its rising trendline, forming a higher low pattern with targets set towards the $195–$200 zone. Source: TraderAG via x
A breakout above this range would confirm bullish continuation for SOL, with short-term targets near $195–$200. Momentum indicators have begun to stabilize, and if volume supports the move, a retest of the upper trendline could mark the next local impulse before any larger retracement.
Contrary View: Trendline Weakness Raises Short-Term Risk
Henry presents a more cautious scenario, noting that Solana is testing its ascending support for the third consecutive time. The triple-tap pattern visible on the 15-minute chart suggests weakening strength along the trendline, with potential liquidity pockets below $155 to $150.
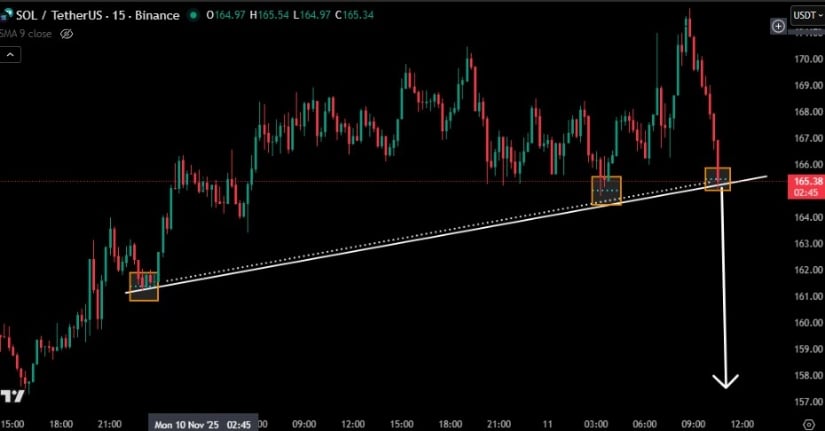
Solana faces short-term pressure as repeated tests of its ascending trendline hint at fading momentum and potential liquidity dips below $155. Source: Henry via X
Should the support break decisively, a short-term flush could occur before any meaningful recovery attempt. Solana price doesn’t negate the higher timeframe bullish outlook but warns traders of potential volatility if local liquidity zones get triggered.
Final Thoughts
Solana price continues to display signs of structural maturity across both technical and fundamental fronts. ETF inflows and long-term range compression suggest institutional interest and bullish potential, while the lower-timeframe tests highlight near-term caution.
If SOL manages to hold above $150 and reclaims the $175 to $185 region with volume confirmation, the broader bullish setup could remain intact. In such a scenario, Solana’s next major breakout could mirror prior cycle expansions.


Written by : Editorial team of BIPNs
Main team of content of bipns.com. Any type of content should be approved by us.


Share this article: