
Category: Crypto News, News
Solana Price Prediction: SOL Tests $150 Support While Analysts Warn of Head-and-Shoulders Breakdown
Solana price is slipping back towards key support levels as participants assess whether buyers can defend the chart before deeper downside opens.
Solana price is approaching a critical support area as market participants reassess whether current momentum can sustain the broader uptrend. While recent price action shows cooling demand and a series of lower highs, the key question now is whether bulls will hold the pressure or whether deeper technical levels may come into play. This analysis brings together the most important technical levels, pattern risks, and sentiment signals shaping SOL’s short-term direction, along with expert-informed commentary and a clearer view of the broader implications.
Solana Price Sliding Back Into Support Territory
Solana is currently trading just above the $145 to $150 demand zone, a region that has repeatedly triggered reactive buying over the past months. Recent candles, however, reflect a meaningful shift; lower highs continue stacking up, compression shows a lack of conviction, and the latest retest of this zone has come with softer volume, suggesting buyer fatigue.
ShangoTrades mapped support aligns with broader market structure: if this level fails to hold, the chart opens into a much wider vacuum towards $118 to $125. This deeper region previously produced a strong upside rotation, but the distance between both support layers underscores the increasing importance of Solana defending the current test
Solana slips back towards a key mid-range demand zone, testing buyers’ strength as price hovers above the $145–$150 support region. Source: ShangoTrades via X
From a structural perspective, this is where markets typically decide between controlled retracements and disorderly expansion of volatility. As long as Solana price sits in this zone, traders should expect reactive moves but remain cautious about assuming sustainability without confirmation.
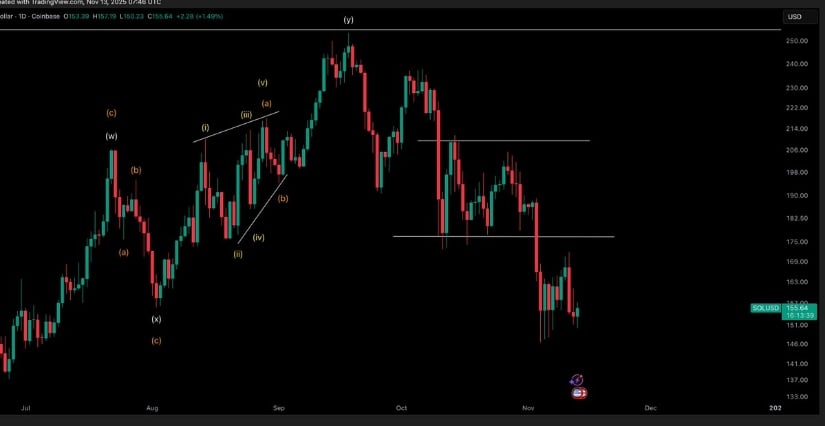
Macro Structure Shows a Head and Shoulders Risk
Zooming out, the higher-timeframe structure introduces a potential head-and-shoulders pattern, with the neckline forming around $120 to $125. The right shoulder shows thinner volume relative to the left, often a sign of waning buyer interest as markets approach exhaustion.

While traditional head-and-shoulders patterns are widely flagged, their reliability in crypto is significantly lower due to erratic liquidity and false-break behavior. Still, the presence of this formation matters because:
- It explains the continued hesitation near $150.
- It contextualizes why sellers continue to defend lower highs.
- It outlines a clear validation/invalidation threshold for traders.

Solana’s broader structure now mirrors a developing head and shoulders pattern, with the neckline around $120–$125. Source: Nebraskangrooner via X
A sustained break below the $120 to $125 neckline would solidify the downside scenario and expose Solana price prediction to deeper extensions. Until then, the pattern should be treated as a caution signal rather than a prediction.
No Bullish Confirmation Until Solana Price Reclaims $177
Short-term structure remains heavy. Solana price continues to print lower highs, and attempts to build momentum have repeatedly stalled before the $170 to $177 zone, a key resistance cluster that previously triggered the breakdown.
Solana continues to struggle beneath the key $170–$177 resistance band, keeping bullish momentum on hold until a clear reclaim unfolds. Source: Crypto Tony via X
Crypto Tony’s SOL chart places this zone as the gatekeeper for trend recovery. Relief bounces towards $162 to $168 remain possible, but without a reclaim of $177 supported by rising volume, bullish narratives will remain speculative. The Elliott Wave count, marked by overlapping lower waves, reinforces the lack of a validated reversal structure. Until buyers reclaim a decisive higher-low formation, rallies are more likely to be absorbed than extended.
For participants, this is the clearest conditional marker: no trend reversal can be taken seriously while SOL trades below $170–$177
Solana Price Prediction: Key Trendline Break Raises Concerns
Howard’s Solana chart adds another key datapoint: the loss of a multi-month diagonal support. When these trendlines break, they typically shift the market from accumulation into redistribution or full corrective mode.
Since losing the trendline, Solana’s recovery attempts have remained shallow, and Fib projections indicate potential support at:
- $125 (first reaction level)
- $81 (Fib 100% extension)
- $40–$50 (extreme 161.8% extension)
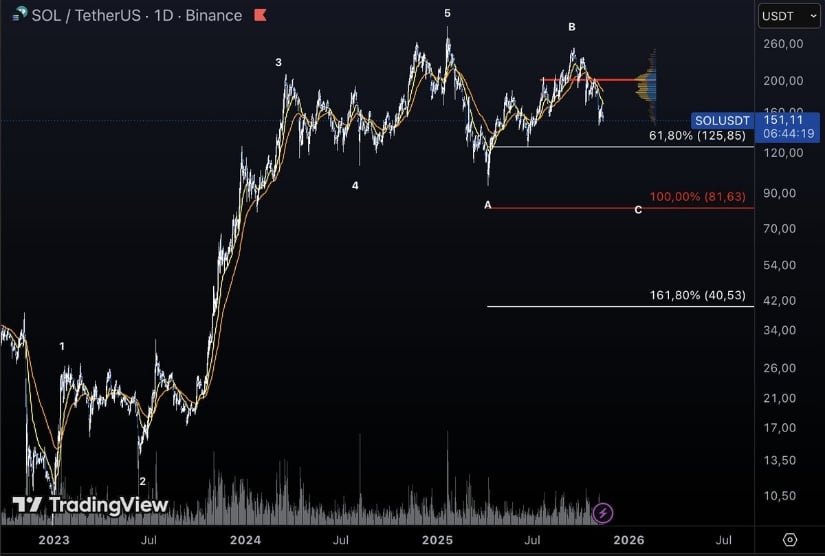
Solana’s loss of a key multi-month trendline brings fresh downside risks into play, with Fib targets and thinning volume profile pointing to volatile territory below. Source: Howard via X
These levels are scenario-based, not predictions, but they highlight how quickly downside territory widens if the current structure continues weakening. The volume profile beneath the current price is notably thin, meaning any breakdown could accelerate faster than traders expect.
Final Thoughts: Can ETFs Turn It Back for Solana?
Despite technical fragility, institutional appetite remains surprisingly steady. ETF products like BSOL and GSOL continue to see net inflows, an important long-term signal that external demand is not deteriorating. Historically, sustained ETF inflows create a supportive macro backdrop even when short-term structure turns shaky.
However, the divergence between Solana ETF demand and actual price action suggests that technicals are still in control of the near-term trend. Until Solana reclaims $170 to $177, buyers do not have structural confirmation, regardless of longer-term fundamentals.
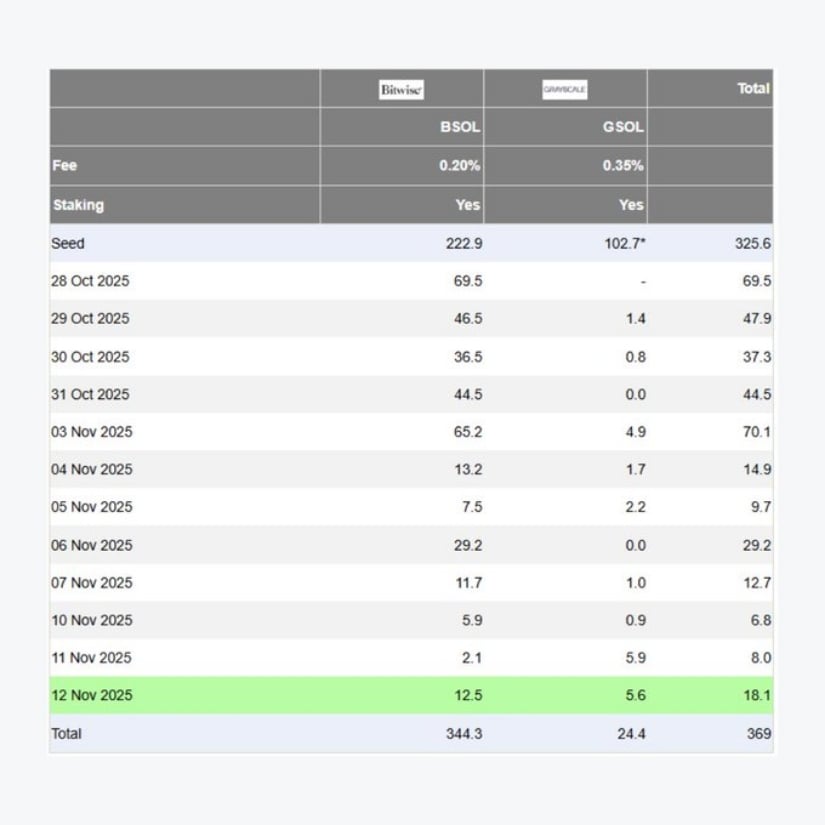
Institutional demand continues to flow into BSOL and GSOL, but Solana’s price action has yet to reflect the same strength. Source: Cointelegraph via X
If ETF inflows persist and current support zones hold, sentiment could shift quickly. Crypto markets are known for sharp reversals once bearish positioning reaches extremes. But until major resistances are regained, traders must approach the Solana chart with caution, clear risk management, and an understanding that both bullish and bearish scenarios remain technically valid.


Written by : Editorial team of BIPNs
Main team of content of bipns.com. Any type of content should be approved by us.


Share this article: