Category: Crypto News, News
Solana Price Prediction: Solana Holds Crucial Support While Analysts Track a Potential $180 Recovery Path
Solana price is stabilizing above key support levels once again, drawing renewed participants’ attention as the market watches for early signals of its next major move.
Solana price is stabilizing once again above the $135 to $140 zone, with price attempting to regain momentum after a brief period of market stagnation. Traders are now watching whether SOL can build enough strength to challenge the overhead resistance that has repeatedly capped rallies over the past week.

This steady rebound comes at a time when broader crypto sentiment remains mixed, putting additional focus on Solana’s tightening structure and the early signals emerging across multiple technical charts.
Solana price continues to defend the mid-range support around $130, a level that has repeatedly influenced short-term trading behavior. This region has acted as a reaction point throughout November, and market observers are noting that buyers are still stepping in each time SOL approaches this zone.
The recent recovery has brought Solana price today back towards the $139 to $140 handle, prompting traders to assess if this rebound carries enough momentum to challenge the key resistance cluster just above current levels.
SOL Faces Breakout Test as Trendline Resistance Approaches
One of the more notable technical observations comes from Gordon, who highlighted a clean descending trendline that has controlled Solana’s short-term movements. According to him, once SOL breaks above this level, it could “be good night to bears,” signaling a potential shift in momentum.
Solana continues to press against its descending trendline, building higher lows as buyers test this key breakout zone. Source: Gordon via X
The price structure beneath this trendline shows consistent higher lows forming on shorter timeframes, suggesting early pressure building against the resistance. If Solana can secure a decisive close above this diagonal barrier, a push towards the $145 to $148 region becomes increasingly likely. Historically, such reclaim patterns in SOL have led to fast continuation moves, particularly when backed by strengthening volume.
Rejection From $141 Keeps Short-Term Market Cautious
A contrasting view came from DevKhabib, who pointed to the recent rejection at the $141 mark as a sign that buyers are not yet strong enough to force a clean breakout. His analysis noted that the market remains stagnant, with Solana lacking the momentum needed to push beyond key intraday resistances.

Solana faces renewed hesitation at the $141 resistance, with market momentum cooling and a potential retest of the $127 support zone on the table. Source: DevKhabib via X
The structure on his chart suggests that SOL may revisit the $127 support area once more before any sustained move higher. This level has generated multiple strong reactions in prior sessions, making it a reliable zone for traders looking for discounted entries. A retest would also reset momentum indicators, giving Solana a healthier foundation for any upcoming advance.
On-Chain Data Shows Heavy Supply Near $142
On the on-chain side, Ali Martinez highlighted that 13 million SOL were accumulated around the $142 level, effectively turning it into a major resistance zone. Cost basis heatmaps show dense supply sitting just above current prices, explaining why the market struggles to clear this region on initial attempts.

On-chain data reveals a dense 13 million SOL cost-basis cluster around $142, forming a supply wall that continues to cap Solana’s upside attempts. Source: Ali Martinez via X
This cluster of holders at $142 increases the likelihood of profit-taking each time Solana approaches the zone, creating a supply wall that must be absorbed before any sustained upside move can unfold. Historically, such dense pockets of cost-basis concentration take multiple tests to break through.
High-Timeframe Structure Points Towards $480
A more macro view was shared by Trader Tardigrade, who suggested that Solana may be undergoing a massive Wyckoff-style reaccumulation phase at the current level. His chart outlines the classic multi-phase structure, with SOL potentially transitioning between phase C and phase D.
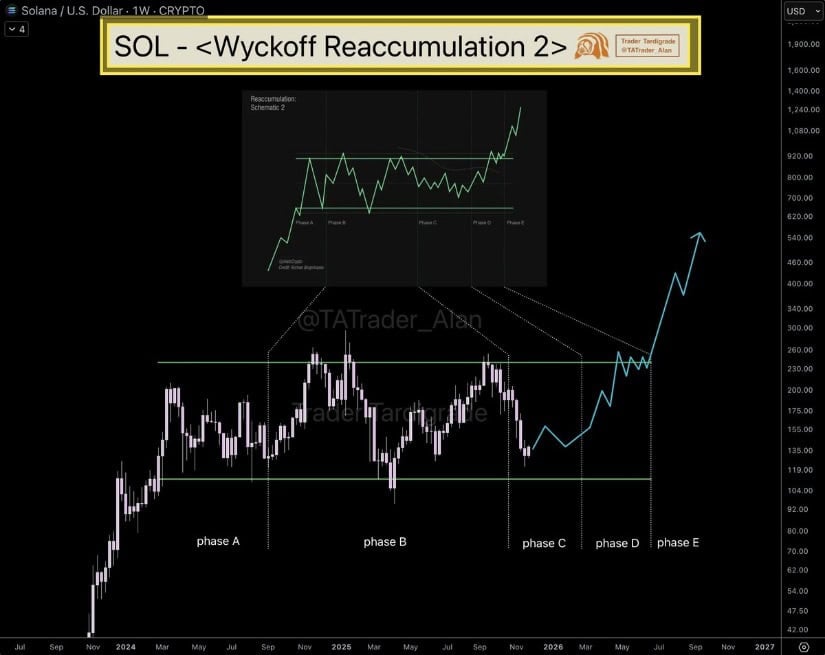
Macro chart suggests Solana may be in a Wyckoff-style reaccumulation phase. Source: Trader Tardigrade via X
This higher-timeframe roadmap introduces several technical targets. An initial breakout from the accumulation zone could send Solana price towards the mid-range resistance around $165 to $180, which represents the first major liquidity block from earlier this year. If buyers maintain control through phase D, the next structural target emerges around $220 to $240, aligning with the top of the previous distribution area. A full Wyckoff completion typically indicates a more aggressive expansion, with the long-term upside projection ranging between $360 and $480.
Final Thoughts: Solana Technical Analysis
Solana’s current structure is defined by a tightening range between support and resistance, with price hovering near the $139 to $140 band. On the downside, immediate support sits at $135, followed by the more critical $130 to $127 zone. This lower band has produced several strong bounces and remains the key level that must hold to maintain the broader bullish setup.
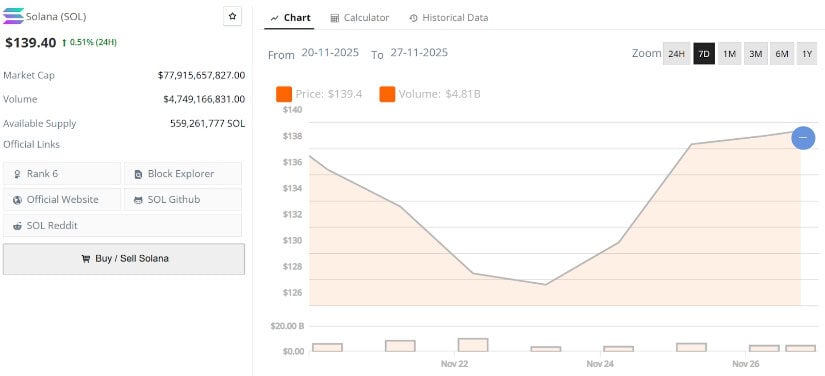
Solana current price is $137.46, down 2.48% in the last 24 hours. Source: Brave New Coin
On the upside, Solana price faces layered resistance. The first obstacle remains $141 to $142, a zone reinforced both technically and by on-chain supply concentration. Above this region, the next resistance band appears at $148 to $150, where multiple prior rejections were recorded. If Solana price clears this range, a more open path emerges towards $180 and then $200.


Written by : Editorial team of BIPNs
Main team of content of bipns.com. Any type of content should be approved by us.


Share this article: