The main tag of Crypto News Today Articles.
You can use the search box below to find what you need.
[wd_asp id=1]

20 11, 2025

Dogecoin Price Prediction: Dogecoin’s $0.08 Fortress: The Support Zone Shaping Its Next Big Move

By |2025-11-20T04:09:29+02:00November 20, 2025|Crypto News, News|0 Comments

The best support level of Dogecoin is at $0.08, with 27.4 bn coins being concentrated there. This is an indicator of good price stability and gets the currency ready to take the next big step.

Dogecoin is still unbelievably strong, with huge support at 0.08. Based on the current on-chain data, there are 27.4 billion coins of Dogecoin at this level, which is the largest support area of the cryptocurrency.

The cluster provides a reliable floor price that attracts steady buying interest and cushions against price volatility.

Dogecoin is pegged at $0.08 and offers a decent foundation on which subsequent price dynamics will be anchored.

According to market watchers on X like Ali Charts, this zone is important in the ongoing demand using heatmaps and technical analysis.

Source – X

Investors use this strong support level as a major cost base for making large purchases. This buildup provides a strategic foundation that frequently initiates price stabilization periods in retracements, which is at the core of the Dogecoin mid- to long-term prospectus.

You might also like: Dogecoin News: Grayscale Set to Debut Historic Dogecoin ETF Next Week

Strong Signal above Support in Market Dynamics.

At a current price of over $0.15, Dogecoin has been performing consistently strongly as it sits on the resistance levels above its critical support wall of $0.08.

In spite of the recent decrease in trading volumes, which is indicative of reduced speculative trading in the short term, the fundamental price structure remains intact.

The market cap of Dogecoin is approximately 24 bn, with its support zones containing more than 27 bn coins.

Price floors such as the $0.08 fortress are of great importance since the supply of Dogecoin grows with unlimited issuance.

This amount of accumulation minimizes the selling pressure in the market decline and increases the confidence of probable growth.

The coin price tends to retrace toward powerful support areas, and repeated spikes and dips reveal the $0.08 cluster as the anchor.

Strong Technical Foundations Point to Next Moves

The price movement of Dogecoin is exhibiting a strong technical position. Strong buying interest at $0.08 implies that buyers will mitigate sudden sell-offs and drive a steady increase toward resistance around $0.20 or higher if volume rises.

Broad on-chain data supports this, showing Dogecoin bouncing as it moves within established cost zones.

This hotspot of support serves as a catapult, holding the price cushioned far above it. The trend is indicating a balanced perspective with supply-demand forces centered at $0.08.

According to market watchers, the next significant price movement is the Dogecoin pivoting at this price. Traders use this pivot to predict further growth or stagnation.

Source link

20 11, 2025

ADA Extends Its Downtrend as Exchange Outflows Build

By |2025-11-20T02:08:29+02:00November 20, 2025|Crypto News, News|0 Comments

  • ADA struggles below $0.4689 as lower highs confirm persistent selling pressure.
  • Futures open interest remains high near $751M despite ongoing spot price decline.
  • Outflows dominate, signaling traders reduce exposure amid weak accumulation interest.

Cardano continues to face steady downward pressure as traders monitor weakening momentum across major timeframes. The market keeps pushing ADA toward new lows as volatility increases and buyers fail to reclaim important levels. The current structure shows a market driven by caution, with traders responding to each failed bounce by reducing exposure. 

Price Slides as ADA Struggles to Hold Support

ADA trades near $0.4689 after rejecting several recovery attempts on the mid-range oscillators. The 20-SMA stays above the market and acts as firm dynamic resistance. Moreover, lower highs continue to form across the 4-hour cha…

Read The Full Article Cardano Price Prediction: ADA Extends Its Downtrend as Exchange Outflows Build On Coin Edition.

Source link

20 11, 2025

XRP struggles near $2.00 as native staking gains focus

By |2025-11-20T00:07:16+02:00November 20, 2025|Crypto News, News|0 Comments

Ripple (XRP) is largely in bearish hands, trading at $2.12 at the time of writing on Wednesday. A bearish wave is stirring volatility in the broader cryptocurrency market amid a prolonged sell-off.

Since XRP hit a record high of $3.66 on July 18, the path of least resistance has generally been downward. Macroeconomic uncertainty, profit-taking, and the lack of prominent price catalysts are some of the factors weighing on the cross-border token.

If risk-off sentiment persists amid weak derivatives and spot markets, the current decline could extend below the critical $2.00 level. 

Ripple developers mull staking on the XRP Ledger

RippleX researcher J. Ayo Akinyele stated that the XRP Ledger has made significant progress over the years, from powering payments and enabling the settlement of real-world assets (RWAs) to supporting real-time liquidity across global markets.

Akinyele argued that the launch of the Canary XRP Exchange Traded Fund (ETF) last week is a sign that adoption is growing, backed by institutional demand. However, the protocol must first figure out how to generate staking rewards and distribute them fairly. The Head of Engineering at RippleX added that native staking on the XRP Ledger could be the next step.

David Schwartz, Ripple’s Chief Technology Officer (CTO), replied to Akinyele’s post in X, saying that he has been mulling over how XRP is used in Decentralised Finance (DeFi). 

“With programmability initiatives and smart contract discussions underway, it seemed like a good time for us to also discuss what other DeFi capabilities natively could look like,” Schwartz stated.

XRP trades under pressure amid low retail demand 

Retail demand for XRP has not picked up following the October 10 deleveraging event, which liquidated over $19 billion in crypto assets in a single day. 

CoinGlass data on the XRP derivatives market shows the futures Open Interest (OI) averaging $3.85 billion on Wednesday, slightly up from Tuesday’s $3.6 billion but significantly below the $4.17 billion recorded on November 1.

XRP Open Interest | Source: CoinGlass

A steady increase in OI is required to support XRP’s short-term recovery, indicating that investors have confidence in the token and the ecosystem and are willing to increase their risk exposure.

Meanwhile, XRP OI-Weighted Funding Rate has risen to 0.0090% on Wednesday from Tuesday’s 0.0005%, as traders increasingly pile into long positions. 

The cross-border remittance token must hold above $2.07-$2.10 short-term support to improve risk appetite. Otherwise, signs of further weakness may reinforce the bearish outlook.

XRP OI-Weighted Funding Rate | Source: CoinGlass

Technical outlook: XRP sellers tighten their grip

XRP teeters above support between $2.07 and $2.10 at the time of writing on Wednesday as bears tighten their grip. The Relative Strength Index (RSI) is at 37 and falling toward oversold territory on the daily chart, which asserts the bearish outlook.

Similarly, the Moving Average Convergence Divergence (MACD) indicator has maintained a sell signal since Sunday. The MACD line in blue remains below the red signal line, suggesting risk-averse action for investors.

XRP/USDT daily chart

A break below XRP’s immediate support at $2.07-$2.10 could validate an extended correction below the critical $2.00 level. The next key area to watch is $1.90, which was last tested in June.

Still, a trend reversal is possible from the current $2.07-$2.10 support if investors increase their exposure while anticipating a steady rebound toward the 50-day Exponential Moving Average (EMA) at $2.46.

Crypto ETF FAQs

An Exchange-Traded Fund (ETF) is an investment vehicle or an index that tracks the price of an underlying asset. ETFs can not only track a single asset, but a group of assets and sectors. For example, a Bitcoin ETF tracks Bitcoin’s price. ETF is a tool used by investors to gain exposure to a certain asset.

Yes. The first Bitcoin futures ETF in the US was approved by the US Securities & Exchange Commission in October 2021. A total of seven Bitcoin futures ETFs have been approved, with more than 20 still waiting for the regulator’s permission. The SEC says that the cryptocurrency industry is new and subject to manipulation, which is why it has been delaying crypto-related futures ETFs for the last few years.

Yes. The SEC approved in January 2024 the listing and trading of several Bitcoin spot Exchange-Traded Funds, opening the door to institutional capital and mainstream investors to trade the main crypto currency. The decision was hailed by the industry as a game changer.

The main advantage of crypto ETFs is the possibility of gaining exposure to a cryptocurrency without ownership, reducing the risk and cost of holding the asset. Other pros are a lower learning curve and higher security for investors since ETFs take charge of securing the underlying asset holdings. As for the main drawbacks, the main one is that as an investor you can’t have direct ownership of the asset, or, as they say in crypto, “not your keys, not your coins.” Other disadvantages are higher costs associated with holding crypto since ETFs charge fees for active management. Finally, even though investing in ETFs reduces the risk of holding an asset, price swings in the underlying cryptocurrency are likely to be reflected in the investment vehicle too.

Source link

19 11, 2025

Solana Price Prediction and Why Analysts Believe Bitcoin Hyper

By |2025-11-19T22:06:37+02:00November 19, 2025|Crypto News, News|0 Comments

Solana Price Prediction and Why Analysts Believe Bitcoin Hyper Could Capture SOL Momentum

The latest Solana price prediction has the crypto market watching closely as SOL attempts a recovery after a broad pullback. While traders look toward a potential move back to the $145 to $150 zone as sentiment stabilizes, Bitcoin Hyper (https://bitcoinhyper.com/) is quietly pulling attention with one of the strongest presale runs of the year.

With the Bitcoin Hyper presale now above $27.8M raised and accelerating daily, analysts argue that $HYPER could see explosive upside in Q4 because it mixes high-speed Bitcoin layer 2 utility with staking rewards and strong early investor demand.

Solana price prediction signals a rebound, but momentum is still unstable

Solana recently bounced from the $129 support area after a difficult month that pushed the price down roughly 22%. The current price hovers near $137 as traders focus on whether SOL can reclaim the $140 to $145 resistance zone that has repeatedly rejected attempts to break higher. The chart shows a higher low forming at the $129 zone, supported by improving RSI conditions that signal easing sell pressure. A clean break above $142 to $145 could open the door toward the next target around $150. However, even though the short-term Solana price prediction looks more positive, the momentum behind SOL remains fragile. Most near-term moves depend on news catalysts and liquidity rotation rather than strong on-chain demand. Without deeper staking incentives or new ecosystem inflows, rallies can fade quickly.

Bitcoin Hyper, in contrast, is gaining attention for a different reason. The project positions itself as a Bitcoin layer 2 network with fast transactions, low fees, and staking yields that currently reach above 40%. The combination of utility, presale traction, and narrative momentum has pushed more investors to watch $HYPER as a potential standout for Q4.

Bitcoin Hyper’s Utility-Driven Evolution Could Outshine Solana in Q4

Solana remains a major force in the market, but its price charts continue to swing with sharp volatility. As traders look for stability and high-growth potential, Bitcoin Hyper (https://bitcoinhyper.com/) is stepping into the spotlight as the meme token with real infrastructure behind it. Built as a Bitcoin layer-2 network, it delivers near-instant transactions, low fees, and a smoother trading experience that stands apart from typical meme-token offerings. The momentum behind Bitcoin Hyper is accelerating quickly. The presale has now exceeded $27.8M, and demand continues rising each day. With a presale entry near $0.0133 per HYPER, analysts argue that the combination of meme-driven attention and genuine layer-2 utility could give Bitcoin Hyper significant upside going into Q4.

A Token Designed for Long-Term Value and Scalable Utility

Bitcoin Hyper is not positioning itself as a short-cycle meme trend. The project uses a capped supply of 21 billion tokens, fully transparent tokenomics, and a roadmap centered on real-world scalability. The network aims to bring high-speed execution, low-latency settlements, and developer-friendly infrastructure directly into the Bitcoin ecosystem.

This utility layer is supported by several ecosystem features, including:

Gamified staking mechanics

NFT-enabled integrations

Community-driven governance

Real throughput for payments and app-level activity

Where classic meme coins rely purely on hype, Bitcoin Hyper pairs narrative momentum with infrastructure capable of sustaining long-term use. This approach is exactly what market analysts believe could differentiate HYPER (https://bitcoinhyper.com/) from other presale-era tokens.

Why Analysts Are Increasingly Watching Bitcoin Hyper

Solana’s charts show potential, but its momentum remains fragile. Most rallies depend on short-term catalysts or liquidity rotations, and recent pullbacks reflect that sensitivity. Bitcoin Hyper, however, is generating attention for a different reason.

Analysts point to three factors driving interest in HYPER:

High-speed Bitcoin layer-2 design – Faster transactions, predictable fees, and a unique focus on Bitcoin-settled activity.

High-yield staking rewards – Early staking returns outpace many competing meme-tokens and attract a more engaged holder base.

A meme-driven brand with real underlying utility – Investors get the cultural upside of a meme coin, combined with infrastructure that solves real problems.

That blend of narrative and function gives Bitcoin Hyper an excitement level that traditional meme tokens such as Dogecoin and PEPE no longer consistently deliver.

A Rare Early-Stage Window for High-Conviction Buyers

The Bitcoin Hyper presale is still open, but not indefinitely. Early participants can secure a low entry price, stake tokens for high returns, and position themselves ahead of a layer-2 rollout that aims to become one of the most utility-focused meme-token ecosystems in the market. With a rapidly growing community, a transparent development path, and a layer-2 foundation built for speed, Bitcoin Hyper represents one of the few early-stage meme-inspired projects that combine hype with tangible functionality. For investors evaluating the next wave of high-momentum opportunities, HYPER (https://bitcoinhyper.com/) is emerging as a serious contender for Q4.

Buchenweg, Karlsruhe, Germany

For more information about Bitcoin Hyper (HYPER) visit the links below:

Website: https://bitcoinhyper.com/

Whitepaper: https://bitcoinhyper.com/assets/documents/whitepaper.pdf

Telegram: https://t.me/btchyperz

Twitter/X: https://x.com/BTC_Hyper2

Disclosure: Crypto is a high-risk asset class. This article is provided for informational purposes and does not constitute investment advice.

CryptoTimes24 is a digital media and analytics platform dedicated to providing timely, accurate, and insightful information about the cryptocurrency and blockchain industry. The enterprise focuses on delivering high-quality news coverage, market analysis, project reviews, and educational resources for both investors and enthusiasts. By combining data-driven journalism with expert commentary, CryptoTimes24 aims to become a trusted global source for emerging trends in decentralized finance (DeFi), NFTs, Web3 technologies, and digital asset markets.

This release was published on openPR.

Source link

19 11, 2025

Bitcoin Trading Surge: BTCUSD Volume Spikes 300% Amid Market Excitement

By |2025-11-19T20:05:31+02:00November 19, 2025|Crypto News, News|0 Comments

Bitcoin trading has taken a sharp turn with a 300% surge in volume, captivating the attention of investors worldwide. As of November 19, the BTCUSD is priced at $90,235.38, reflecting a 2.03% drop. Despite this downturn, the surge in trading volume to 810 million indicates significant investor interest. This spike is driven by various market dynamics, inviting questions about future trends and price movements.

Understanding the Bitcoin Trading Surge

Factors Behind the 300% Increase

The recent 300% surge in Bitcoin trading volume marks a pivotal moment for the crypto market. Such a significant increase often signifies heightened investor engagement and potential shifts in market trends. Analysts point to a combination of factors influencing this activity, including improved trading platforms and increased institutional interest.

Market Dynamics and Investor Sentiment

Current market data shows BTCUSD’s price fluctuating between a high of $92,948 and a low of $89,955. Despite the current price drop, the trading volume increase suggests optimism among investors. The cryptocurrency’s Relative Strength Index (RSI) is at 30.82, indicating oversold conditions, which often precede potential price recoveries.

Technical Analysis and Forecasts

Current Technical Indicators

As we examine the technical indicators, the ADX value of 36.47 suggests a strong trend, albeit negative. The MACD stands at -4,665.64, indicating bearish momentum. However, some oscillators like the Stochastic %K at 7.32 hint at a possible upward reversal soon.

Future Price Predictions

The forecasts present mixed signals. Bitcoin’s monthly forecast is $100,096.72, suggesting potential growth. Long-term, a 7-year forecast predicts $187,776.60, reflecting optimism in Bitcoin’s market trajectory. Despite short-term volatility, long-term prospects remain bullish.

Investors’ Takeaways and Strategies

Balancing Risk and Opportunity

Despite a 2.03% drop in Bitcoin price, the increase in trading volume highlights ongoing investor interest. This presents a unique opportunity for strategic investors willing to embrace short-term volatility for long-term gains. Diversification remains crucial.

Investors should continually monitor market indicators like the Moving Average (MA) envelope slope at -0.66 and Bollinger Bands, showing significant price fluctuations. With Bitcoin’s volatility, staying updated is vital for making informed decisions.

A recent discussion on Twitter highlights growing sentiment among traders, indicating optimism about Bitcoin’s future.

Final Thoughts

The surge in Bitcoin trading volume underscores its resilience and ongoing relevance in the financial world. As BTCUSD sees a 2.03% price decrease, the striking increase in trading activity offers both opportunities and challenges for investors. While immediate technical indicators reflect mixed signals, the broader forecasts and historical performance suggest that Bitcoin continues to be a compelling asset for forward-thinking investors. Monitoring market conditions and technical data will be key strategies moving forward. For more insights, Meyka offers real-time analytics to guide your investment decisions.

FAQs

Why has Bitcoin trading volume surged by 300%?

The surge is driven by increased investor interest and improved trading platforms. This reflects market optimism despite short-term price drops in BTCUSD.

What are the current technical indicators for Bitcoin?

Current indicators show BTCUSD at $90,235.38 with a strong ADX trend of 36.47. The RSI at 30.82 suggests oversold conditions, hinting at potential recovery.

How should investors approach the current Bitcoin market?

Investors should focus on strategic diversification, closely monitor market trends, and utilize platforms like Meyka for real-time insights to navigate volatility effectively.

Disclaimer:

The content shared by Meyka AI PTY LTD is solely for research and informational purposes. 
Meyka is not a financial advisory service, and the information provided should not be considered investment or trading advice.


Source link

19 11, 2025

How Low Can XRP Go? Expert Predicts 55% XRP Price Slump to Just $1

By |2025-11-19T18:04:35+02:00November 19, 2025|Crypto News, News|0 Comments

XRP price has
broken below the critical $2.20 support level today (Wednesday), November 19,
2025, sliding with the broader cryptocurrency market in what technical analysts
are calling one of the most dangerous formations for XRP holders this year.

The
cryptocurrency currently trades at $2.14, down sharply from recent highs above
$3.60, as it struggles with a confirmed death cross pattern on the daily chart.

My
technical analysis shows XRP is fighting the $2.20-$2.30 support zone
identified at local lows, and although the price has clearly broken below $2.20
to the current $2.14 level, the market “is not a pharmacy,” meaning prices
don’t react perfectly to technical zones, especially in volatile crypto
markets.

Let’s check together why XRP price is falling today,
what are the current XRP price prediction and why it may fall to $1.25 or even
$1.

The dreaded
death
cross has officially formed on XRP’s daily chart
, with the 50-day
exponential moving average (EMA) crossing below the 200-day EMA, a potent
bearish signal that indicates medium-term selling has overwhelmed long-term
accumulation.

The death
cross formation is appearing not just on XRP
but across Bitcoin, Ethereum, and other major cryptocurrencies
on daily
timeframes, suggesting coordinated weakness throughout the crypto market.

How low can XRP price go? According to my technical analysis to $1.25. Source: Tradingview.com

Technical Levels for XRP

Support/Resistance Level

Price Zone

Technical Significance

Current Price

$2.14-$2.18

Below critical support zone

Broken Support

$2.20-$2.30

Former
support, now potential resistance

Psychological Support

$2.00

Round
number with high psychological impact

June 2025 Lows

$1.90

Next
major support if $2.00 breaks

April 2025 Lows

$1.61

Intermediate
support before ultimate target

Ultimate Bearish Target

$1.25

50% decline scenario, yearly minimum

Heavy Resistance Ceiling

$2.55-$2.63

Converged
moving averages creating barrier

Since early
November, long lower wicks have been forming on XRP’s candlesticks, slightly
extending the support zone and showing buyers attempting to defend these
levels.

However,
the clear break below $2.20 with the current price at $2.14 suggests bears are
gaining control and “want to push it lower,” as only a sustained move
below the round $2.00 level and June lows at $1.90 will confirm their deeper
bearish intentions.

How Low Can XRP Go? $1.25 Target in Focus

Based on my
technical analysis, XRP faces potential for
a devastating 50% decline toward the $1.25 level
, representing the
cryptocurrency’s yearly minimum and a zone last tested one year ago during the
October 10, 2024 deleveraging event. This bearish target aligns with the 100%
Fibonacci extension measured from July peaks to October lows and coincides with
critical support that provided a floor during previous market stress.

Master, a
crypto analyst followed by over 53,000 traders on Twitter, shares an even more
bearish outlook: “$XRP Top July 2025 now bear market most likely down to
$1 or so. when capitulation?” His prediction of $1.00 represents an
extreme capitulation scenario that would mark a 54% decline from current levels
and test support not seen since early 2024.

The
intermediate levels to watch include the psychological $2.00 barrier, June 2025
lows at $1.90, and April 2025 lows at $1.61—each representing potential pause
points on the path lower.

XRP Price Predictions:
Bearish vs Bullish Scenarios

Source/Analyst

Timeframe

Price Target

Scenario Type

Master (@MASTERBTCLTC)

Near-term

$1.00

Extreme bearish/capitulation

My Technical Analysis

Short-term

$1.25

50% decline bearish target

FastBull Analysis

Immediate

$2.20

Consolidation/pause level

Changelly

November 2025

$2.11-$2.19

Current range forecast

Changelly

December 2025

$2.15-$2.45

Recovery scenario

Coinpedia

End of 2025

$5.05

Bullish ETF approval case

Standard Chartered

3-year outlook

$8

Long-term bullish

The divergence
between bearish technical projections ($1.00-$1.25) and optimistic fundamental
forecasts ($5.05) reflects the extreme uncertainty currently gripping XRP
markets.

Why XRP Is Going Down?

Whale Selling and Market
Stress Override ETF Optimism

Despite the
successful launch of XRP ETFs, the cryptocurrency has plunged 11% as whale
selling and broader market stress overshadow early institutional demand.
“XRP slumps 11% despite ETF inflows as whale selling and market stress
overshadow early institutional demand,” reported Yahoo Finance,
highlighting the disconnect between positive fundamental developments and
negative price action.

Satraj
Bambra, CEO of Rails and Managing Partner at Round13 (running a $100M liquid
fund up 400% since April 2022), explained the persistent market weakness:
“October’s liquidation event was a major catalyst for Bitcoin ‘s dip below
$90K. It created a liquidity vacuum, and when markets are already weak, they
don’t need a fundamental reason to puke; they just need an opening. Macro
uncertainty adds weight, but the chain reaction began with October’s wipeout.
The dead bodies from that event are still floating up.”

Key Factors Driving XRP
Decline

  • Death cross technical breakdown: 50 EMA crossing below
    200 EMA confirms shift to bearish momentum across crypto
  • Whale distribution: Large holders selling
    tokens despite ETF launch, transferring to new investors
  • October liquidation aftermath: Liquidity vacuum with
    “dead bodies still floating up” from deleveraging event.
  • Altcoin underperformance: XRP hit particularly
    hard as Bitcoin dominance rises and liquidity evaporates
  • Supply-in-profit collapse: 58.5% decline leaves
    41.5% of tokens underwater, creating capitulation risk
  • Heavy resistance ceiling: Converged moving
    averages at $2.55-$2.63 capping any rally attempts
  • Broader crypto weakness: $1 trillion wiped from
    total crypto market cap, lowest since early July

Macro Headwinds and
Crypto-Specific Pressures

Niraj Pant,
co-founder of Ritual AI and former General Partner at Polychain (where he led
investment rounds in Offchain Labs, EigenLayer, and Polymarket), provided
comprehensive context on the macro and crypto-specific pressures:

“Macro:
We’ve seen a general tightening of liquidity with fears of an overextension in
AI capex alongside shakier economic data and a hawkish Fed, leading to risk-off
behavior in speculative tech stocks and crypto. Post-government shutdown
ending, we’ve (re)entered a dramatically heightened market environment with
more volatility expected.”

XRP Price Analysis, FAQ

Why is XRP falling today?

XRP is
falling due to a confirmed death cross formation (50 EMA crossing below 200
EMA), break below critical $2.20-$2.30 support, whale selling despite ETF
launch, aftermath of October liquidation event creating liquidity vacuum,
broader altcoin weakness with rising Bitcoin dominance, and 41.5% of XRP supply
now held at a loss triggering capitulation selling.

How low can XRP go?

Technical
analysis suggests XRP could decline to $1.25 (50% drop from recent highs),
which represents the yearly minimum and 100% Fibonacci extension from July
peaks to October lows. Intermediate support exists at $2.00 psychological level
and $1.90 June lows. Crypto analyst Master predicts extreme capitulation to
$1.00, while April 2025 lows at $1.61 provide another potential floor.

What is XRP price
prediction for 2025-2026?

Price
predictions vary dramatically. Bearish scenarios forecast $1.00-$1.25 near-term
targets based on death cross breakdown. Changelly projects $2.11-$2.45 range
through December 2025. Optimistic forecasts cite $5.05 by year-end driven by
ETF approvals and regulatory clarity. Standard Chartered analyst Geoffrey
Kendrick projects 73% annual growth over three years, while some bulls target
$10-$37 for the current cycle.

Is XRP in a bear market?

Yes, XRP
has entered bear market territory with a 13.88% monthly decline in November, the
largest since February 2025, and a confirmed death cross pattern on daily
charts. The cryptocurrency has fallen from highs of $2.70-$3.60 to current
levels around $2.14-$2.18, with 41.5% of supply now held at a loss. However,
year-over-year performance remains strong at +285.9%, demonstrating volatility
rather than sustained bear market.

Can XRP reach $5 in 2025?

While AI
forecasts and some analysts project $5.05 by end of 2025 driven by ETF
approvals, partnerships, and regulatory clarity, this requires a dramatic
reversal from current bearish technical structure. XRP would need to recover
140%+ from current $2.14 levels within approximately six weeks. Standard
Chartered’s 73% annual growth projection over three years suggests more
measured appreciation. The $5 scenario remains possible but requires
significant positive catalysts and reversal of death cross breakdown.


Source link

19 11, 2025

DOGE holds $0.15 amid OI stability

By |2025-11-19T16:03:06+02:00November 19, 2025|Crypto News, News|0 Comments

Dogecoin (DOGE) is extending its decline, trading at around $0.1587 at the time of writing on Wednesday. Since the October 10 flash crash, which liquidated over $19 billion in crypto assets in a single day, the leading meme coin with a market capitalisation of $24 billion has lost 37% of its value. 

The steady sell-off reflects bearish sentiment in the broader cryptocurrency market, driven by uncertainty ahead of the next Federal Reserve (Fed) monetary policy meeting in December and a lack of significant price catalysts in the crypto space.

Fed Chair Jerome Powell said during the October policy meeting that a December rate cut was not guaranteed, which spooked investors and fueled risk-off sentiment.

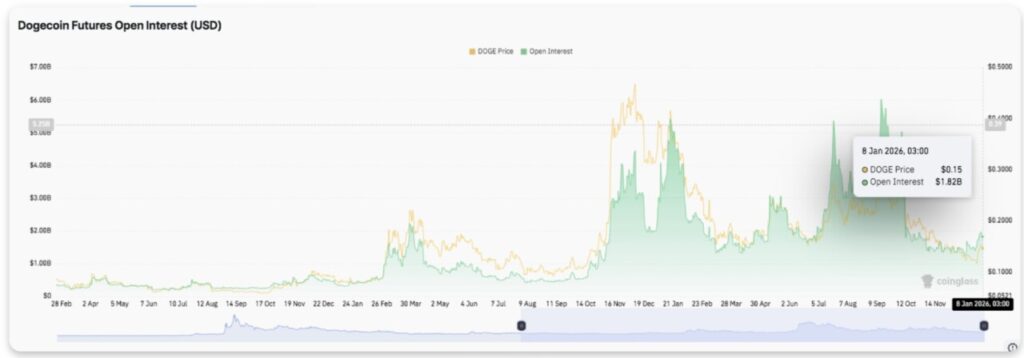
An analysis of Dogecoin’s derivatives market could provide insight into the next direction the meme coin may take, especially as futures Open Interest (OI) stabilizes.

Assessing Dogecoin’s bullish potential 

Dogecoin’s derivatives market is stabilizing, supported by futures OI rising to $1.66 billion on Wednesday. Following the massive deleveraging on October 10, DOGE’s OI dropped to $1.37 billion on November 7, highlighting a sticky risk-off.

Since OI represents the notional value of outstanding futures contracts, a steady increase suggests that investor interest in DOGE is growing. Traders are slowly regaining confidence in Dogecoin’s ability to sustain short-term recovery. As investors increase their risk exposure, the tail force on DOGE intensifies, increasing the probability of a steady recovery.

Dogecoin Open Interest | Source: CoinGlass

Dogecoin OI-Weighted Funding Rate has risen to 0.0076% on Wednesday from Tuesday’s -0.0083% , as traders increasingly pile into long positions. The meme coin must hold onto short-term gains above the $0.1500 support to steady this risk appetite. Otherwise, any sign of weakness may reinforce the bearish outlook.

Dogecoin OI-Weighted Funding Rate | Source: CoinGlass

Technical outlook: Dogecoin vulnerable amid bearish signals

Dogecoin’s recovery remains a pipe dream despite its derivatives market showing signs of stability. The Relative Strength Index (RSI) on the daily chart at 39 risks extending its decline toward oversold territory, potentially escalating the downtrend below $0.1500.

Dogecoin also sits below the 50-day Exponential Moving Average (EMA) at $0.1893, the 100-day EMA at $0.2024, and the 200-day EMA at $0.2090, all of which point to a weak technical structure.

The Money Flow Index (MFI) indicator holds below a descending trendline on the same daily chart, suggesting that money is flowing out of DOGE, which would make recovery an uphill task.

DOGE/USDT daily chart

A break below the immediate support at $0.1500 could push Dogecoin toward $0.1424, a level tested in June. Still, a recovery could occur from the current level if investors increase exposure, supported by a relatively stable derivatives market.

Open Interest, funding rate FAQs

Source link

19 11, 2025

ADA Fails to Clear $1 While Bitcoin

By |2025-11-19T14:00:28+02:00November 19, 2025|Crypto News, News|0 Comments

Cardano Price Prediction

Cardano price prediction talk is heating up again as ADA pushes toward the $1 zone. The hype that used to pump Cardano headlines has cooled off, and traders are starting to play it safer. A lot of people are now scanning the market for the next big crypto, something faster, fresher, and offering better payout potential. That spotlight is shifting toward Bitcoin Hyper (https://bitcoinhyper.com/), a high-speed, payments-focused project built for real utility with low fees and instant style transfers. It blends strong tech with meme-level momentum, which is why more ADA holders are giving it a serious look. Here is where ADA stands right now and why Bitcoin Hyper is pulling in more attention going into 2025.

Cardano Price Outlook: Will ADA Finally Break the $1 Barrier?

The price of Cardano (ADA) is back under the spotlight as it flirts with the $1 threshold. ADA is currently trading around $0.46, remaining firmly below the mark as buying interest falters and resistance remains entrenched. Technical indicators reflect the hesitation. The RSI hovers near 50, signaling a lack of conviction among traders. Meanwhile, ADA is still down over 80% from its all-time high, even after multiple minor rebounds. Market sentiment appears to be shifting. The buzz around Cardano updates and ecosystem developments has cooled, and some traders are now looking beyond ADA for higher speed and higher reward opportunities. That attention is turning to Bitcoin Hyper (HYPER), a project promising fast throughput, low fees, and strong upside potential. If ADA cannot clear $1 soon, this could accelerate capital rotation into newer targets such as Bitcoin Hyper, especially among holders seeking fresh narratives and higher momentum.

Bitcoin Hyper: Fast payments, powerful staking and a next generation Bitcoin layer 2 vision

Bitcoin Hyper (https://bitcoinhyper.com/) is a next-generation Bitcoin layer 2 project built for speed, cheap transactions, and real staking rewards. Unlike traditional meme tokens or slow legacy chains, it offers a high reward system for early adopters and a utility-driven ecosystem designed to power the next wave of Bitcoin-based applications. Early participants get significantly higher staking yields that gradually reduce as more users join, giving first movers a real advantage. Transfers on Bitcoin Hyper are nearly instant and cost a fraction of Bitcoin layer 1 fees, making HYPER a fast and efficient option for traders. The presale has already crossed more than $27M raised, showing strong traction among investors.

Users can buy and stake HYPER directly during the presale, with high-yield reward tiers offering exceptional incentives. The project also plans to roll out gamified staking, NFTs, and cross-chain integrations as the ecosystem expands.

Bitcoin Hyper rewards investors with speed, staking, and utility

Bitcoin Hyper keeps its community active with real use incentives and high throughput performance. Traders who follow Cardano news and ADA price updates are noticing the contrast. While ADA focuses on long term gradual upgrades, Bitcoin Hyper delivers instant rewards, rapid confirmation times, and far lower costs. Its high reward staking system offers extremely strong APY levels for early HYPER holders. Rewards scale down over time as more participants join, keeping the system balanced.

For presale investors, Bitcoin Hyper (https://bitcoinhyper.com/) combines fast payments, high rewards, and a functional layer 2 foundation in one ecosystem. Early adopters can stake, trade, and access high yield opportunities on a chain built for real utility. This is not just another meme coin, Bitcoin Hyper provides speed, staking, and a complete framework for one of the strongest crypto presale opportunities in the current market. Even long time ADA holders are watching how HYPER stacks up against older alt coins as momentum shifts toward faster and more rewarding projects.

Conclusion

The latest Cardano price outlook shows ADA still stuck below $1, and that slowdown is pushing traders to scout faster and more rewarding plays. Bitcoin Hyper is getting that attention with its high-speed layer 2 design, low fees, and a presale that keeps gaining traction. Early buyers can still join the HYPER presale (https://bitcoinhyper.com/) at the current stage and start earning staking rewards immediately. The next price tier is approaching, which is why many investors are locking in positions before the increase. The presale has already crossed more than $27M, signaling strong demand and real momentum behind the project. Investors who stake HYPER early can capture higher yields and secure their allocation before the next stage moves up.

Buchenweg 15, Karlsruhe, Germany

For more information about Bitcoin Hyper (HYPER) visit the links below:

Website: https://bitcoinhyper.com/

Whitepaper: https://bitcoinhyper.com/assets/documents/whitepaper.pdf

Telegram: https://t.me/btchyperz

Twitter/X: https://x.com/BTC_Hyper2

Disclosure: Crypto is a high-risk asset class. This article is provided for informational purposes and does not constitute investment advice.

CryptoTimes24 is a digital media and analytics platform dedicated to providing timely, accurate, and insightful information about the cryptocurrency and blockchain industry. The enterprise focuses on delivering high-quality news coverage, market analysis, project reviews, and educational resources for both investors and enthusiasts. By combining data-driven journalism with expert commentary, CryptoTimes24 aims to become a trusted global source for emerging trends in decentralized finance (DeFi), NFTs, Web3 technologies, and digital asset markets.

This release was published on openPR.

Source link

19 11, 2025

XRP Price Prediction: The Critical Period that Determines the Next Direction

By |2025-11-19T11:59:31+02:00November 19, 2025|Crypto News, News|0 Comments

Jakarta, Pintu News – Ripple is currently at a tipping point, with the price trying to stabilize in an important technical zone after several weeks of controlled declines. The token is trading at around $2.16, where it continues to test the 0.382 Fibonacci region. This level has become an important reference point for traders watching the next move of the decision, as the market structure weakens and momentum slows down.

Downward Trend Persistence

XRP continues to follow a clear pattern of lower highs and lower lows on the 4-hour chart. The price is below the 9 EMA and below the Supertrend, which signals continued selling pressure. This suggests that there is still a dominant selling force in the market, which could affect the next price movement.

Source: Coinedition

Open interest for XRP futures has risen sharply throughout 2025. Open interest grew from under $1 billion in early October to a peak of over $6 billion as volatility increased. The leveraged positions returning to the market indicate significant strength, which could influence future price dynamics.

Read also: 10 Layer-1 Crypto that Potentially Reach ATH in 2026

Inflow and Outflow Data Shows Weak Accumulation

The capital flow data shows consistent outputs throughout 2025. Outflows between $30 million and $150 million appear frequently, indicating continued distribution by large holders. This could be an indicator that there is a tendency to sell rather than buy among large holders, which could affect price stability.

XRP Price Prediction: The Critical Period that Determines the Next Direction
Source: Coinedition

XRP’s near-term outlook depends on whether buyers can hold the $2.16-$2.17 support zone long enough to build momentum towards the $2.25-$2.33 region. Technical compression and increasing leverage both suggest that high volatility is likely in the upcoming sessions.

FAQ

What makes the Ripple XRP (XRP) price in the critical phase in November 2025?

The XRP price is hovering around $2.16 and continues to test the Fibonacci level of 0.382, which became an important technical area after several weeks of decline. This level determines whether the trend structure can hold or weaken further.

Who is dominating XRP’s current market activity?

Selling pressure is still dominant, reflected in the price position below EMA 9 and Supertrend. Distribution by large holders throughout 2025 also reinforces the pressure.

When does the increase in XRP open interest occur throughout 2025?

Open interest increased from early October 2025, growing from under $1 billion to over $6 billion by November. This rise coincided with increased volatility in the market.

Where are XRP’s key support zones that market participants are watching?

The critical support zone is in the $2.16-$2.17 range, which is the focus in determining whether prices can maintain short-term stability.

Why do capital flows show a distribution in 2025?

Outflows between $30 million and $150 million indicate a sell-off by large holders during 2025. This indicates weak accumulation and consequent price pressure.

That’s the latest information about crypto. Follow us on Google News to get the latest crypto news about crypto projects and blockchain technology. Also, learn crypto from scratch with complete discussion through Pintu Academy and stay up-to-date with the latest crypto market such as bitcoin price today, xrp coin price today, dogecoin and other crypto asset prices through Pintu Market.

Enjoy an easy and secure crypto trading experience by downloading Pintu crypto app through Google Play Store or App Store now. Also, get a web trading experience with various advanced trading tools such as pro charting, various types of order types, and portfolio tracker only at Pintu Pro.


*Disclaimer

This content aims to enrich readers’ information. Pintu collects this information from various relevant sources and is not influenced by outside parties. Note that an asset’s past performance does not determine its projected future performance. Trading crypto carries high risk and volatility, always do your own research and use cold hard cash before investing. All activities of buying and selling bitcoin and other crypto asset investments are the responsibility of the reader.

Reference

Source link

19 11, 2025

Why could Canary Capital and Fidelity’s Solana ETF launches help SOL recover?

By |2025-11-19T09:58:44+02:00November 19, 2025|Crypto News, News|0 Comments

Solana (SOL) price trades around $140 at the time of writing on Wednesday after rebounding from a key support level the previous day. Canary Capital and Fidelity announced the launch of their spot Solana Exchange Traded Funds (ETFs), SOLC and FSOL, on Tuesday, lifting market sentiment amid growing institutional interest. The technical outlook suggests further upside if SOL holds above the weekly support level at $128.68.

Institutional demand rises as multiple asset managers launch Solana ETFs

Canary Capital announced the launch of its spot Solana ETF, SOLC, on Tuesday, coinciding with Fidelity’s debut of the FSOL Solana ETF on the same day. 

Fidelity becomes the fourth asset manager to roll out an SOL ETF and the first from the firm to feature staking. Moreover, Bitwise, which launched its product in late October, and Grayscale, whose fund also includes a staking component. 

This succession of launches underscores accelerating institutional interest in Solana-based investment products, which projects a bullish outlook for Solana and its native token in the long term.

Solana Price Forecast: SOL momentum indicators hint at fading bearish strength

Solana price faced rejection at the daily level of $168.79 on November 11 and declined 22% over the next 6 days. On Tuesday, it recovered more than 7% after retesting the weekly support at $128.68. At the time of writing on Wednesday, it hovers around $139.71.

If the weekly support at $128.68 continues to hold, it could extend the recovery toward the next resistance at $160.

The Relative Strength Index (RSI) on the daily chart is 35, rebounding from the oversold territory, suggesting bearish momentum may be slowing and a potential short-term rebound could emerge.

SOL/USDT daily chart 

On the other hand, if SOL closes below $128.68, it could extend the decline toward the next daily support at $118.10.


Source link

Go to Top