The main tag of Crypto News Today Articles.
You can use the search box below to find what you need.
[wd_asp id=1]

23 07, 2025

China’s DeepSeek AI Predicts the Price of XRP, Dogecoin and Cardano by the End of 2025

By |2025-07-23T09:37:53+03:00July 23, 2025|Crypto News, News|0 Comments

DeepSeek, China’s leading publicly available AI, anticipates that numerous prominent altcoins will achieve new all-time highs in the second half of 2025, spurred by Bitcoin’s exceptional upward trajectory.

Last Monday, Bitcoin reached an unprecedented peak of $122,838, setting a new record. Analysts suggest that if this momentum sustains, it could accelerate broader acceptance of cryptocurrencies worldwide.

This impressive rally has reignited optimism across the crypto space, with many speculating that the forthcoming bull run could dwarf the historic surge witnessed in 2021, driving key altcoins to uncharted price levels.

Below are the digital currencies DeepSeek AI expects to have strong upside potential by Christmas.

XRP (Ripple): DeepSeek AI Conservatively Predicts Potential for Easy Doubling in Five Months

According to DeepSeek AI, Ripple’s XRP could rise to $7 by late 2025, marking an easy doubling from its current price of approximately $3.52.

This bullish outlook stems from XRP’s explosive rally this year. On July 18, it recorded a fresh all-time high at $3.65, surpassing its previous 2018 peak of $3.40, with upward momentum still evident.

Institutional adoption, regulatory clarity, and speculation about a possible XRP spot ETF are also boosting investor confidence, potentially unlocking massive inflows from both retail and institutional players.

XRP continues to shine as a rapid, cost-efficient, and regulation-friendly solution for global payments. In 2024, the United Nations Capital Development Fund (UNCDF) recognised XRP for enabling instant cross-border transfers without reliance on traditional banks.

A pivotal court decision in 2023 determined that XRP’s retail sales do not qualify as securities transactions, undermining the SEC’s prior aggressive approach towards Ripple and other crypto altcoins.

In March, Ripple’s CEO Brad Garlinghouse announced that their legal battle with the SEC had officially ended, removing a major barrier and strengthening investor sentiment around XRP and the wider crypto market.

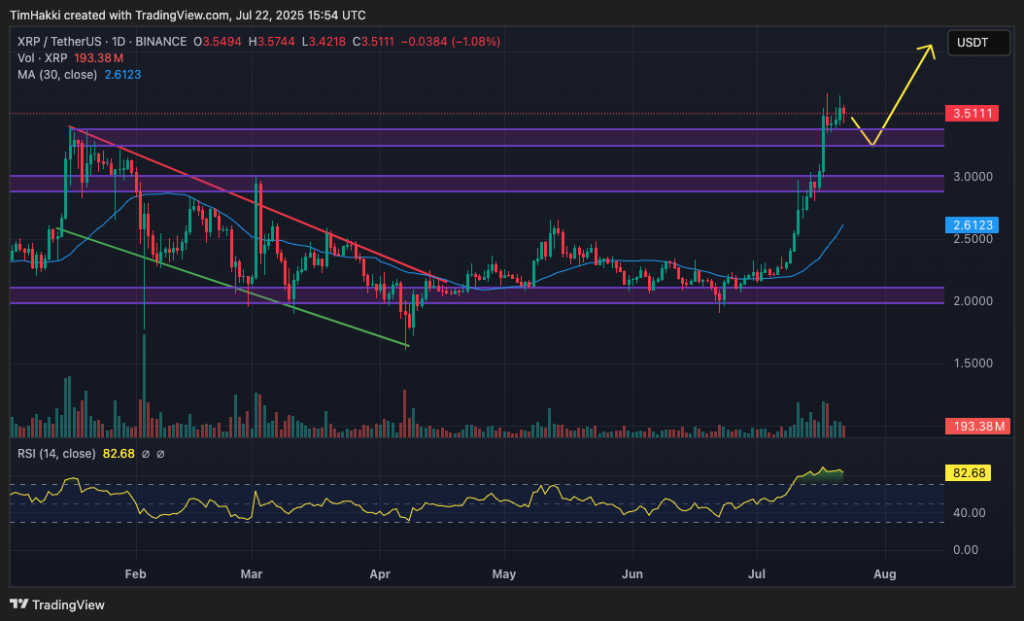
At present, XRP is hovering beneath the $3.60 resistance zone. A clear break above this level could make DeepSeek’s conservative $7 year-end projection achievable.
However, rival AI ChatGPT believes XRP could easily triple DeepSeek’s projections based on its performance thus far this year. Such a high target requires a major catalyst, such as favourable US regulatory reforms would be required. Under the Trump administration, clearer legislation could ignite a bull market, eclipsing even the 2021 gold rush.

Over the past 12 months, XRP has surged by 480%, outpacing Bitcoin’s 78% growth during the same period.

Dogecoin ($DOGE): DeepSeek AI Predicts This Meme Coin Pioneer is Set for Breakout

Dogecoin ($DOGE), originally created as a parody in 2013, has grown into a crypto giant with a market cap exceeding $40 billion, backed by its passionate community and rising utility.

Generally mirroring Bitcoin’s price movements, DOGE combines meme-driven hype with enduring market presence.

Currently trading at $0.2669, Dogecoin has gained 40% in the seven days and 80% over the last thirty. Its RSI reading of 80 suggests a short-term correction is incoming as traders cash in on this upward price action. But fear not, such a move would allow it to consolidate before its next upward move.

Chart analysis indicates a descending wedge pattern formed from November to April, typically a precursor to a bullish breakout.

DeepSeek AI projects that DOGE could climb as high as $1 in an extended bull market, translating to a potential 4X return from its current value.

On the adoption front, Dogecoin continues to gain mainstream traction. Tesla accepts DOGE payments for selected items, and payment platforms like PayPal and Revolut now integrate DOGE transactions, strengthening its real-world use cases.

Cardano ($ADA): DeepSeek AI Predicts This Sustainable Blockchain to 11x

Cardano ($ADA) surged 20% in the last seven days as a result of consistent demand. It recently attracted attention from United States President Donald Trump, who hinted at including ADA in a Strategic Crypto Reserve via his Truth Social platform.

Although his proposal mainly involved government Bitcoin purchases, Cardano acquisitions would occur only through seized assets. Nonetheless, its mention underscores Cardano’s significance in the crypto industry.

Founded by Ethereum co-founder Charles Hoskinson, Cardano is known for its academically rigorous development, scalability, and eco-friendly framework.

With a market capitalisation of $31.9 billion, ADA remains a strong Ethereum contender and is gaining ground on other high-growth platforms like Solana.

DeepSeek AI predicts that ADA could reach $10 by the end of 2025, more than eleven times its current price of $0.8823.

From a technical standpoint, ADA has been consolidating within a falling wedge since late 2024. A breakout above its $1.10 resistance level could spark a rally towards $1.50 by autumn.

Even without a full-blown bull market, which is what it would take to leap up to $10, achieving DeepSeek’s conservative $5 target by New Year would comfortably surpass ADA’s previous record high of $3.09.

TOKEN6900: New Meme Coin Targeting 1000x Returns

While DeepSeek AI anticipates substantial growth from top altcoins, their substantial market caps may limit extreme gains.

For traders seeking exponential returns, a new wave of meme coins is emerging with extraordinary profit potential.

One such token is TOKEN6900 (T6900), an ERC-20 meme coin that began its presale last week.

So far, TOKEN6900 has secured over $989,510 from investors, reflecting strong early demand and promising prospects post-listing.

Unlike other meme coins that pivot towards utility, TOKEN6900 embraces its purely hype-based identity, leveraging irony, aggressive marketing, and FOMO to drive growth.

The project’s website boldly states: “It’s Not Built On Fundamentals. It’s Built On Delusion, Irony, And The Collective Hallucination Of Terminally Online Traders.”

TOKEN6900 references SPX6900, another meme token rooted in absurdist humour reminiscent of the late-90s tech bubble.

Its total supply is set at 930,993,091 tokens – precisely one more than SPX6900’s presale supply, reinforcing its satirical branding approach.

This strategy appears effective, as demonstrated by rapid fundraising milestones. Although TOKEN6900 lacks utility, staking features provide additional income opportunities alongside speculative trading gains.

Interested buyers can participate in the presale through the official website at the current price of $0.006575.

With prices slated to increase later today, early participation may secure the best entry price for those aiming to capitalise on its growth.

Keep up to date with the project by following its official X and Instagram accounts

The post China’s DeepSeek AI Predicts the Price of XRP, Dogecoin and Cardano by the End of 2025 appeared first on Cryptonews.

Source link

23 07, 2025

Claver Forecasts XRP Surge to $1,500–$2,000 by 2026 on 57,000% Gain as Reverse Carry Trade Unwinds and Regulations Shift

By |2025-07-23T07:36:56+03:00July 23, 2025|Crypto News, News|0 Comments

Jake Claver, CEO of Digital Ascension Group, has proposed a bold price forecast for XRP, suggesting the cryptocurrency could surge to $1,500–$2,000 by early 2026. His analysis hinges on macroeconomic shifts, regulatory developments, and structural changes in the global financial system. Claver outlined these predictions during an interview on The Good Morning Crypto show, emphasizing how factors such as the unwinding of reverse carry trades and increased scrutiny of stablecoins could drive demand for digital assets like XRP.

A key component of Claver’s reasoning involves the potential reversal of the reverse carry trade—a strategy where low-interest-rate currencies are borrowed to invest in higher-yield assets. He argues that a shift in liquidity favoring digital assets could accelerate adoption of tokens like XRP. Additionally, he highlighted regulatory scrutiny of Tether, a major stablecoin, as a potential catalyst for market instability. Claver speculated that a joint investigation involving the SEC, CFTC, and Department of Justice—possibly spurred by the recent GENIUS Act—could expose vulnerabilities in stablecoin systems, prompting investors to seek alternatives with greater transparency.

Claver also referenced broader geopolitical risks, including rising oil prices linked to Middle East tensions, which he views as a stress test for traditional financial systems. He suggested such instability could push capital toward alternative assets, further amplifying XRP’s appeal. Another angle explored was the potential impact of unexpected revelations in the Jeffrey Epstein case, which he implied could indirectly affect investor confidence in crypto firms. While he did not explicitly connect these dots, the narrative underscores his emphasis on unpredictable macroeconomic triggers.

From a practical perspective, Claver highlighted XRP’s role in addressing settlement inefficiencies in traditional finance. Unlike stock trades, which take one business day to settle, XRP-based transactions can complete in 20–40 minutes. He cited Project ION, a blockchain settlement platform developed by R3 and DTCC, as an example of infrastructure where XRP could act as a neutral bridge asset. This use case, he argued, positions XRP to gain traction in cross-platform financial operations during periods when traditional markets are closed.

Claver’s $2,000 price target, however, remains highly ambitious. At current levels near $3.45, XRP would need to rise over 57,000% to reach that threshold. Such a move would result in a market capitalization exceeding $120 trillion—far surpassing the global M2 money supply. For context, the current global gold market is valued at roughly $9 trillion. While the feasibility of these projections is debated, Claver’s analysis has sparked discussion about the potential for extreme price volatility in a rapidly evolving market.

Under his scenario, even a small XRP holding—such as 1,000 tokens currently valued at $3,450—could grow to $1.5–$2 million by 2026. This outcome depends on the convergence of multiple speculative factors, including regulatory upheaval, liquidity shifts, and geopolitical shocks. Critics argue that such predictions rely on unverified assumptions and overlook the inherent volatility of crypto markets. Yet, Claver’s framework underscores the growing intersection of macroeconomic theory and digital asset speculation.

While the likelihood of reaching $2,000 remains contentious, the prediction reflects a broader trend of analysts leveraging macroeconomic narratives to justify aggressive crypto valuations. Claver’s perspective, though unconventional, aligns with a narrative that views digital assets as potential safe havens in times of systemic financial stress. As with all such forecasts, investors are advised to conduct independent research and assess risks carefully before making decisions based on speculative scenarios.

This content is informational and should not be considered financial advice. The views expressed herein may include the author’s personal opinions and do not represent any institutional position. Readers are urged to exercise caution and conduct thorough research before engaging in investment activities.

Source link

23 07, 2025

Solana Price Prediction: SOL Reclaims $200 as Market Eyes a Move Towards $220 to $270

By |2025-07-23T05:35:57+03:00July 23, 2025|Crypto News, News|0 Comments

Solana has reclaimed the spotlight, breaking above $200 and overtaking BNB in market cap, as price eyes a potential move toward new all-time highs.

Solana, after taking out BNB in market cap and clearing the $200 mark, is now setting the tone for the broader altcoin market. This isn’t just another price spike; it’s a move backed by strong technicals and a surge in on-chain activity.

Solana Overtakes BNB in Market Cap

In a major development that’s likely to ripple through the broader altcoin market, Solana has officially surpassed Binance Coin (BNB) in total market capitalization. According to the latest snapshot from SolanaFloor, SOL now holds a market cap of $107.58 billion, just ahead of BNB’s $106.24 billion.

Solana surpasses BNB in market cap, signaling growing dominance among Layer-1 blockchains. Source: SolanaFloor via X

This milestone also reflects how Solana has quietly become one of the most active and widely adopted Layer-1 networks in the space. As capital continues to shift toward chains that combine speed with scalability, this market cap move may be less about hype, and more about fundamentals catching up.

Solana Price Structure Eyes Retest of All-Time Highs

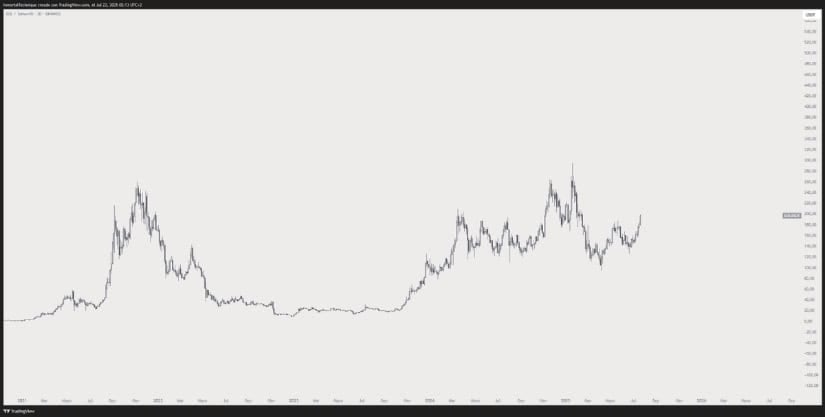
Following its reclaim of the 5th market cap position, Solana is now turning heads again with a price structure that looks increasingly primed for a retest of its all-time highs. The long-term chart shared by Inmortal shows SOL grinding upward, forming a broad ascending base that mirrors the type of accumulation phase often seen before major expansions.

Solana Price Prediction: SOL Reclaims 0 as Market Eyes a Move Towards 0 to 0

Solana forms broad ascending base as price structure targets potential retest of 2021 all-time highs. Source: Inmortal via X

What stands out here is the symmetry between the 2021 run and the current buildup. However, this time the foundation seems stronger, both in terms of market structure and network usage.

From a technical perspective, the $200 zone appears to be the current area of gravity, with price steadily grinding higher after multiple clean retests of key demand levels over the last few months. If SOL can maintain this momentum and hold above the $175 to $180 region, the path towards new all-time highs opens up quickly.

Solana Technical Outlook Points Toward $220–$250 Range

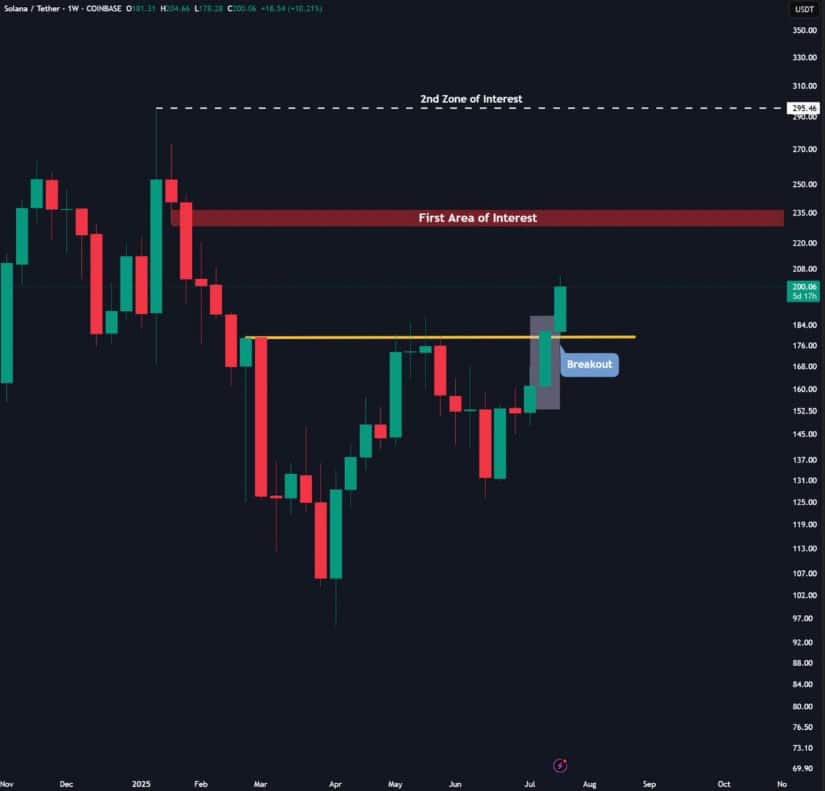
Building on its strong market cap momentum and price structure, Solana is now flashing a clean technical breakout on the weekly chart. As shown by Cas Abbé, SOL has just broken above a key resistance level near $180, reclaiming it with follow-through.

Solana Technical Outlook Points Toward $220–$250 Range

Solana reclaims key resistance near $180, opening technical path toward the $220–$250 target zone. Source: Cas Abbé via X

This breakout unlocks the next major target zone around $220, a level that also coincides with the first major resistance block. If this continues, Solana doesn’t just aim for the $220 level; it has potential to accelerate into the $250 to $270 range before any potential signs of pause.

Solana Liquidations Spike as Price Surges Past $200

Adding more weight to the recent breakout, Solana just triggered over $48 million in short liquidations as price tapped $204, its highest level in months. According to SolanaFloor, the majority of these liquidations came from on-chain sources, even outpacing centralized exchanges (CEXs), showing how aggressive short positioning had gotten during this move up.

Solana Liquidations Spike as Price Surges Past $200

Solana triggers $48M in liquidations as price hits $204. Source: SolanaFloor via X

These liquidation spikes could serve as a momentum driver for Solana. Notably, the single largest liquidation was over $1 million at the exact $204 level. With momentum now flipping bullish, any such liquidations above remain a major price target.

Solana’s Supply Thins Out Beyond $190

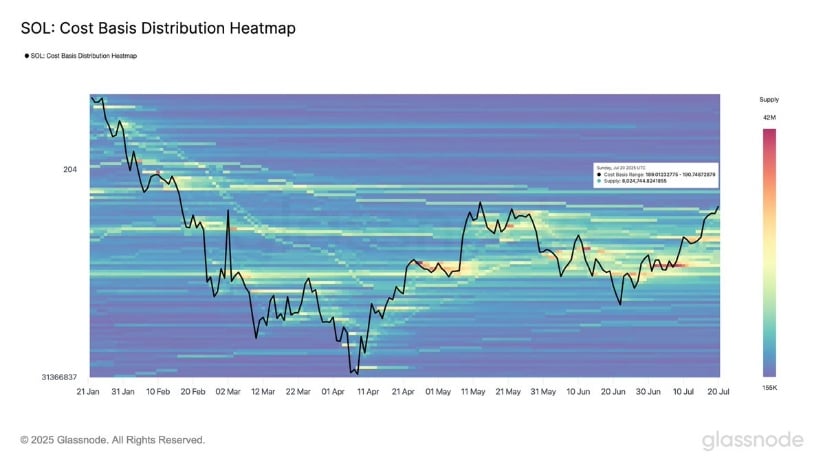
While Solana’s break above $190 may seem like just another technical step, on-chain data suggests it could carry more weight than it appears. According to Glassnode, this level marked a zone where over 8 million SOL had previously been accumulated, creating a dense band of overhead resistance. But now that price is clearing it, the structure shifts in Solana’s favor. What was once a wall of supply may now be thinning out fast.

Solana's Supply Thins Out Beyond $190

Solana breaks through $190 supply zone, clearing over 8M SOL in resistance and opening room for accelerated price movement. Source: Glassnode via X

Above $190, the overall supply starts to thin out in those higher ranges. This shift in structure could allow price to move faster if demand continues.

Final Thoughts

Solana isn’t just reclaiming its spot among the top assets; it’s quietly shifting the narrative around what Layer-1 chains can achieve this cycle. The way supply has thinned out above $190, combined with the recent surge in liquidations, suggests that SOL may now have the momentum and structure to push toward $220 and possibly beyond.


Source link

23 07, 2025

SPX, DXY, BTC, ETH, XRP, BNB, SOL, DOGE, ADA, HYPE — TradingView News

By |2025-07-23T03:34:48+03:00July 23, 2025|Crypto News, News|0 Comments

Key points:

  • Bitcoin is facing selling near $120,000, but the bears have failed to pull the price below $115,000, indicating that buyers remain in command.

  • Select major altcoins continue to charge higher, signaling the arrival of an altseason

Bitcoin BTCUSD continues to face selling near $120,000, but a positive sign is that the bulls have not allowed the price to dip below $115,000 in the past few days. That suggests the bulls are buying every minor dip and have kept up the pressure.

The spot BTC exchange-traded funds registered a net outflow of $131.35 million on Monday, but that comes after 12 consecutive days of about $6.6 billion in inflows, according to SoSoValue data. That indicates the buyers are not hurrying to book profits as they anticipate the up move to continue.

It’s not only BTC that is attracting buyers. CoinShares reported on Monday that Ether ETHUSD exchange-traded products recorded $2.12 billion in inflows, roughly double its previous $1.2 billion record.

Will BTC break out of the overhead resistance and resume its uptrend? Could altcoins continue moving higher? Let’s analyze the charts of the top 10 cryptocurrencies to find out. 

S&P 500 Index price prediction

The S&P 500 Index (SPX) turned up from the 20-day exponential moving average (6,218) on Wednesday, indicating buying on dips.

The upsloping moving averages and the relative strength index (RSI) near the overbought zone indicate that bulls remain in control. Buyers will try to push the price toward 6,500, which is likely to offer stiff resistance.

Sellers will have to pull the price below the 6,147 support to weaken the bullish momentum. The index could then slide to the 50-day simple moving average (6,054), which is a critical support to watch out for. A break below the 50-day SMA suggests the index may have topped out in the near term.

US Dollar Index price prediction

The recovery in the US Dollar Index (DXY) stalled at the 50-day SMA ($98.56), indicating selling on rallies.

The bears have strengthened their position by pulling the price below the 20-day EMA ($97.94). That clears the path for a fall to 97.17 and then to the critical 96.37 level.

This negative view will be invalidated in the near term if the price turns up sharply and breaks above the 50-day SMA. That suggests the formation of a higher low and enhances the prospects of a rally to 100.54. There is minor resistance at 99.42, but it is likely to be crossed.

Bitcoin price prediction

Buyers have not allowed the price to dip below $115,000 but are struggling to propel the price above $120,000.

The upsloping 20-day EMA ($115,289) and the RSI in the positive zone signal that the path of least resistance is to the upside. If buyers kick the price above $123,218, the BTCUSDT pair could pick up momentum and surge to $135,729 and, after that, to the pattern target of $150,000.

Sellers will have to yank the price below the $110,530 support to tilt the advantage in their favor. That could accelerate selling and pull the pair to $100,000.

Ether price prediction

Ether rose above the $3,745 resistance on Sunday, but the bulls could not sustain the breakout.

The price turned down below $3,745, indicating that the higher levels are attracting sellers. The ETHUSDT pair could pull back to the 38.2% Fibonacci retracement level of $3,494 and then to the 50% retracement level of $3,381. If the price rebounds off the support zone, the bulls will again try to catapult the pair to $4,094.

On the other hand, a break below $3,381 could sink the pair to the 20-day EMA ($3,191). That may delay the resumption of the up move.

XRP price prediction

XRP XRPUSD soared above the $3.40 resistance on Thursday, and the bulls have successfully maintained the price above the breakout level. That suggests the buyers are trying to flip the $3.40 level into support.

If the price breaks above $3.66, the XRPUSDT pair could resume the uptrend. The pair may surge to $4 and, after that, to the target objective of $4.86.

Although the trend remains up, the overbought level on the RSI increases the risk of a correction or consolidation in the near term. If the price dips and closes below $3.40, the pair could tumble to the 20-day EMA ($2.96). This is a crucial level to watch out for because a break below the 20-day EMA suggests that the breakout above $3.40 may have been a bull trap.

BNB price prediction

BNB BNBUSD is witnessing a tough battle between the buyers and the sellers near the $761 level.

If the price closes below $761, the bears will try to tug the BNBUSDT pair to $732. A solid bounce off $732 signals demand at lower levels. The bulls will then make another attempt to drive the pair above the $761 to $794 resistance zone. If they succeed, the pair could resume the uptrend toward $900.

Conversely, a break below $732 could sink the pair to the 20-day EMA ($707). Buyers will have to fiercely defend the 20-day EMA if they want to retain the advantage.

Solana price prediction

Solana SOLUSD skyrocketed above the $185 overhead resistance on Monday, and the bulls are trying to strengthen their position by pushing the price above the $209 resistance.

A word of caution for the bulls is that the RSI has risen deep into the overbought territory. That suggests a minor correction or consolidation in the near term. If the price finds support at $185, it indicates that the bulls are buying the dips. That improves the prospects of a break above $209. The SOLUSDT pair may climb to $220 and later to $240.

Contrary to this assumption, if the price turns down and breaks below $185, it signals profit-booking by short-term traders. The pair may then dip to the 20-day EMA ($170). 

Dogecoin price prediction

Dogecoin’s DOGEUSD range-bound action resolved to the upside with a break above the $0.26 resistance on Sunday.

The bears are trying to pull the price back below $0.26. If they manage to do that, the aggressive bulls may get trapped. The DOGEUSDT pair could then dip to the 20-day EMA ($0.21), which is likely to attract buyers.

Contrarily, if the price rebounds off $0.26, it suggests that the bulls have flipped the level into support. There is minor resistance at $0.29, but it is likely to be crossed. The pair may then march northward toward $0.35.

Cardano price prediction

Cardano (ADA) broke above the $0.86 overhead resistance on Monday, but the bulls are facing selling at higher levels.

The bears are trying to pull the price back below $0.86. If they do that, the ADAUSDT pair could descend to the 20-day EMA ($0.74). This is an essential level for the bulls to defend because a break below the 20-day EMA could deepen the correction to the 50-day SMA ($0.65).

Conversely, if the price rebounds off the 20-day EMA, the bulls will try to drive the pair above the $0.94 resistance. If they succeed, the pair could resume its up move to $1.02 and then to $1.17.

Hyperliquid price prediction

Hyperliquid (HYPE) rebounded off the 20-day EMA ($43.77) on Sunday, but the bulls could not sustain the higher levels.

That indicates profit-booking on rallies. The bears are trying to pull the price below the 20-day EMA. If they manage to do that, the HYPE/USDT pair could plunge to the support line of the ascending channel.

Instead, if the price turns up from the current level and rises above $48, it signals aggressive buying on dips. That increases the possibility of a rally to the resistance of the ascending channel near $58.

This article does not contain investment advice or recommendations. Every investment and trading move involves risk, and readers should conduct their own research when making a decision.

Source link

23 07, 2025

Bitcoin Cash Price Prediction as Uptrend Continues – How Quickly Can BCH Hit $1,000? 

By |2025-07-23T01:34:10+03:00July 23, 2025|Crypto News, News|0 Comments

A bullish Bitcoin Cash price prediction is gaining traction as BCH continues to print higher lows, fueled by a fresh wave of retail liquidity – an early sign that a broader uptrend may be taking shape.

While the altcoin is down 2.85% today, it’s still up 6% over the past week, pointing to strong underlying momentum.

The market warming catalyst now takes the forefront, with pro-crypto regulatory momentum unlocking sidelined capital for risk-on assets and easing the Geopolitical and macroeconomic FUD narrative.

With the GENIUS Act still under consideration in Congress and the CLARITY Act expected to follow in October, bullish catalysts now extend well beyond “Crypto Week” setting the stage for continued upside.

Can Bitcoin Cash Keep Growing?

Bitcoin Cash does not directly benefit from the GENIUS Act without a native stablecoin in its ecosystem. Instead, it gains from the act as a broader market-warming catalyst.

Its core value proposition as a payment solution positions BCH well to benefit from the CLARITY Act. With clearer regulatory guidelines, BCH could see momentum as a viable option for U.S. merchant adoption.

Until then, it continues to ride the momentum of the wider market, with the altcoin season index rising from 20 to 53 since the start of the month—still shy of the 75 considered a full altseason.

Altcoin Season Index. Source: Coinglass.

Retail investors are re-entering the market with renewed appetite for alternatives to Bitcoin, positioning Bitcoin Cash for further growth.

Bitcoin Cash Price Analysis: How Soon Can $1000 Come?

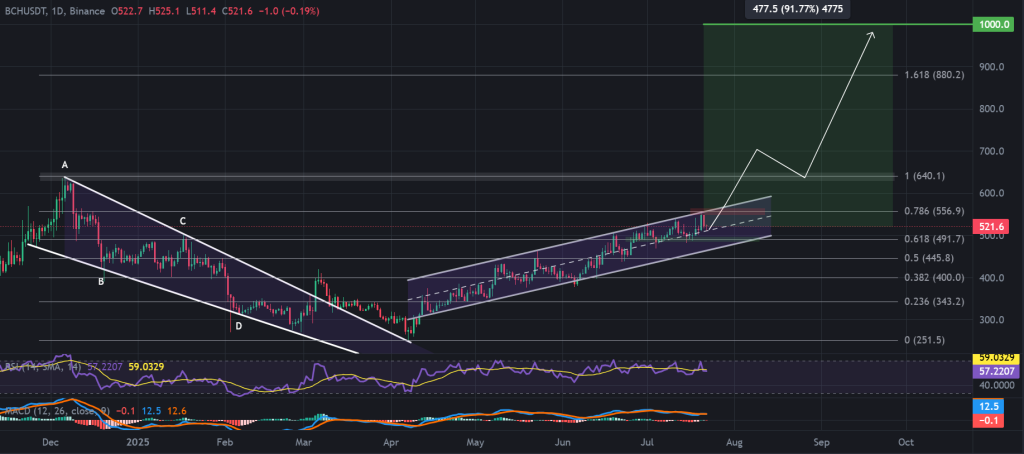
With altcoin season gearing up, the ascending channel forming since the mid-April market bottom may finally have the momentum it needs to reach a breakout.

Bitcoin Cash price 4-hour chart, ascending channel breakout nears. Source: TradingView, Binance.
BCH / USDT 4-hour chart, ascending channel breakout nears. Source: TradingView, Binance.

The Bitcoin Cash price currently trades within a consolidation zone between strong support at $490 and stiff resistance at $555, capping its latest upward move.

However, a consistent pattern of higher lows since mid-July suggests growing bullish momentum, setting BCH on track to retest resistance with stronger footing.

The RSI sets up the next higher low, now near the neutral 50 level after its most recent rejection saw buy pressure exhausted, breaching into oversold territory at 74.

The MACD line also shows early signs of a reversal as its histogram shows a slowdown, opening the doors for a crossover back above the signal line ahead of a new swing high.

A breakout above $555 remains the last barrier for a channel breakout. If successful, the next key resistance is the December 2024 high around $640.

If $640 flips to support, the push could go on toward its $720 all-time high, and potentially enter price discovery near $1,000, especially if momentum builds ahead of the anticipated CLARITY Act in October.

This milestone would represent a 90% upside from current levels.

Bitcoin Could Have the Edge, With Some Help

Those who jumped to Bitcoin Cash over the original may be forced to reconsider as the Bitcoin ecosystem finally addresses its most significant limitation: scalability.

Slow transactions, high fees, and limited programmability have held it back from competing with EVM and Solana networks – until now.

And this shift starts with Bitcoin Hyper ($HYPER), Bitcoin’s first real-time Layer 2 that brings Solana-level speed and smart contracts directly to the Bitcoin ecosystem.

Powered by the Solana Virtual Machine (SVM) and anchored by a decentralized Canonical Bridge, it enables fast, cheap, and composable dApps while remaining secured by Bitcoin.

With over $4 million raised in its ongoing presale, investors are already rallying behind $HYPER, potentially credited to its high 231% APY on staking that rewards early investors.

You can keep up with Bitcoin Hyper on X and Telegram, or join the presale on the Bitcoin Hyper website.

The post Bitcoin Cash Price Prediction as Uptrend Continues – How Quickly Can BCH Hit $1,000?  appeared first on Cryptonews.

Source link

22 07, 2025

Is Cardano Price to $1 Finally Possible?

By |2025-07-22T23:33:08+03:00July 22, 2025|Crypto News, News|0 Comments

Cardano

ADA
$0.87


24h volatility:
4.3%


Market cap:
$31.37 B


Vol. 24h:
$1.70 B


has recently experienced notable price gains, further extending its bullish outlook.

Within the last four weeks, the ADA price has seen a rally of more than 60%. The Cardano open interest (OI) has reached a record high. This signals improved sentiment for ADA and could pave the way for further price increases.

Technical Analysis Says ADA Could Extend Bull Run

The ADA price was trading at $0.8725, down 1.39% over the last 24 hours at the time of writing. Despite the dip in price, it is worth noting that the coin has managed to sustain its bullish outlook in the mid-term.

On July 21, ADA’s price jumped past $0.92, marking a four-month high. DeFiLlama data shows that Total Value Locked (TVL) on Cardano surged past $412 million on Monday.

ADA’s open interest has climbed to a record high, while technical indicators point to a potential bull run. The weekly RSI stands at 58, slightly above the neutral 50, signaling growing bullish momentum.

Cardano Weekly Chart | Source: TradingView

Some indicators show an increasing likelihood that ADA will revisit the $1 psychological level in the short term. As of June 14, Futures’ OI in ADA at exchanges was at $1.18 billion.

From there, it rose to $1.66 billion on Monday, marking a new daily all-time high (ATH).

An increasing OI usually indicates that new or additional money is entering the market. It could also suggest new buying, a sentiment that could fuel the current ADA price rally.

The Cardano chain had recently recorded a surge in traders’ interest and liquidity. This event is believed to be a catalyst for the platform’s bullish outlook.

According to Token Terminal data, ADA Chain’s weekly token trading volume increased from $8.12 billion in the second week of July to $10.30 billion just last week. This marks the highest level that the Cardano platform has seen since mid-March.

With a positive liquidity boost, the chances of retesting the $1 mark in the coming weeks is high.

The TOKEN6900 Presale Just Got More Interesting

As ADA price action cools, all eyes are turning to TOKEN6900, one of the best crypto presales heating up the market. This bold new project is creating serious buzz with a value proposition that defies expectations.

TOKEN6900 tracks liquidity, GDP, oil reserves, and corporate earnings in a way that stands out from the crowd. It is not just another token following the same old roadmap.

There is no traditional utility here. As the project puts it, “If you buy TOKEN6900 expecting utility, congratulations, you’re the utility.” This is not just a presale. It is a wild ride, and it is gaining momentum fast.

Current Presale Stats

Current Price: $0.006675

Amount Raised So Far: $977K

Ticker: TOKEN6900

Hard Cap: $5 million

End Price: $0.007125

TOKEN6900 brings bold tokenomics to the table. Forty percent is fueling aggressive marketing, five percent powers staking rewards, ten percent goes to liquidity, with more set aside for developer incentives and core coding development. This project is built to move fast and loud.

If you’re interested, now’s the time to act. The token price changes in just one day. Until then, you can still grab TOKEN6900 using crypto or even a credit card. Don’t sleep on it.

The post Is Cardano Price to $1 Finally Possible? appeared first on Coinspeaker.

Source link

22 07, 2025

One Analyst Is Forecasting $45 As Institutions Continue To Buy XRP

By |2025-07-22T21:32:06+03:00July 22, 2025|Crypto News, News|0 Comments

One Analyst Is Forecasting  As Institutions Continue To Buy XRP

XRP is making headlines again, and not just because of price action. Institutional interest is growing, whales are quietly accumulating, and analysts are starting to throw out bold numbers, including a potential $45 target. 

Meanwhile, a new wave of early-stage crypto investments is stealing some attention. As the XRP price consolidates, PayFi alternatives like Remittix (RTX) are emerging with real-world use cases and presale momentum. 

XRP Price Forecast: Is $45 Really On The Table?

The XRP price is currently trading around $0.72, holding key support near the 200-day moving average. Momentum has been sluggish, but on-chain data reveals that whales scooped up more than 150 million XRP in recent days.

Source: TradingView

A respected technical analyst from Crypto Insight Channel recently predicted an eventual move toward $45 XRP price, based on historical Fibonacci extensions, past cycle behaviour, and a potential SEC settlement boost.

While most analysts are still eyeing $3 to $5 as a realistic target, some long-term holders are starting to buy into the $45 forecast, especially as the wider market shows signs of heating up again.

XRP investment products also saw fresh inflows last week, showing that fund managers and serious traders aren’t just sticking with Bitcoin and Ethereum,  they’re quietly loading up on XRP too.

XRP Growth Is Steady, But Newcomers Like Remittix Are Moving Faster

While XRP has strong fundamentals and a maturing investor base, newer tokens are capturing attention with high-growth crypto performance and concrete use cases.

One of the standout projects is Remittix (RTX), a crypto-to-FIAT payment platform designed for fast, cross-border transactions. It’s not a meme coin, and it’s not hype-driven. It’s a crypto with real utility targeting a $19T global payments market, and that’s why some investors are rotating from old giants like XRP into high-upside alternatives like RTX.

Why Remittix Is Being Called ‘XRP 2.0:

  • Direct crypto-to-bank transfers in 30+ countries
  • $250,000 Remittix Giveaway is live for early adopters
  • Audited by CertiK with global payout rails already integrated
  • Built for mass adoption and not just speculation

Remittix (RTX) has already raised over $16.7 million in its presale and is backed by working infrastructure. It supports over 40 cryptocurrencies and 30 FIAT currencies, making it a standout DeFi project in 2025. For many investors, it fits all the key narratives: best crypto presale 2025, low gas fee crypto, and next big altcoin 2025.

Old Players Hold Steady, New Projects Explode

XRP has proven it can weather regulation, price crashes, and market fatigue. The fundamentals are solid, and the $45 prediction, while aggressive, reflects the potential if institutional adoption accelerates.

But while the XRP price climbs slowly, Remittix is racing ahead. With explosive presale growth, a live product on the horizon, and a massive global use case, RTX is becoming the PayFi token to watch.

Discover the future of PayFi with Remittix by checking out their presale here:

Website: https://remittix.io/ 
Socials: https://linktr.ee/remittix
$250K Giveaway:https://gleam.io/competitions/nz84L-250000-remittix-giveaway

Source link

22 07, 2025

XRP Price Prediction for July 23

By |2025-07-22T19:30:57+03:00July 22, 2025|Crypto News, News|0 Comments

After rallying over 80% in the past two weeks, XRP price is showing signs of short-term exhaustion. XRP price today is trading near $3.45, down nearly 3% on the day, as bulls lose grip near the upper boundary of a major supply zone. The token is now testing crucial structural support with indicators suggesting mixed momentum.

What’s Happening With XRP’s Price?

XRP price prediction (Source: TradingView)

XRP’s intraday structure shows a clear breakdown below a short-term ascending trendline visible on the 1-hour chart. The move follows a double rejection near $3.66, which aligns closely with the top of the red supply zone marked on the daily chart. Price has now fallen back into the previous consolidation band between $3.35 and $3.58.

RSI on the 1-hour chart has dropped to 38.94, suggesting weakening bullish pressure, while MACD shows a fading bullish crossover with histogram bars sliding toward negative territory. The rejection also invalidated the rising channel, and price is now testing the base of a horizontal range.

XRP price prediction (Source: TradingView)

The 4-hour chart confirms this with XRP trading below the 20 EMA ($3.4690) and just above t…

The post XRP Price Prediction for July 23 appeared first on Coin Edition.

Source link

22 07, 2025

Ethereum Surges Past $3,700: What Happens Next?

By |2025-07-22T17:30:17+03:00July 22, 2025|Crypto News, News|0 Comments

Ethereum (ETH) price is making headlines again as it smashes through resistance levels with explosive momentum. The current price action shows ETH hovering around $3,731 with aggressive bullish sentiment across the board. With the Relative Strength Index (RSI) deep in the overbought zone and candles closing higher on the Heikin Ashi chart, the question now is—can Ethereum price break $4,000 this week, or is a correction on the horizon? Let’s dive deep into the chart to uncover what’s next.

Ethereum Price Prediction: Why is ETH Price Surging Today?

ETH/USD Daily Chart- TradingView

Ethereum’s breakout is backed by strong bullish structure seen on the daily chart. The Heikin Ashi candles show consistent upward momentum with no visible upper shadows in the last 6 sessions—a powerful sign of trend strength. The recent Ethereum price movement from the $2,800 range to over $3,700 has been swift and fueled by momentum traders and institutional accumulation.

Is Ethereum Overbought? RSI Says Yes

The RSI currently reads 86.13, which is well above the traditional overbought threshold of 70. This signals two key points:

That said, RSI can remain overbought during strong bull markets—like it did in 2021—so traders must combine this with price action analysis rather than treat it as a standalone sell signal.

Key Fibonacci Levels and Resistance Zones

Ethereum price has blasted through multiple Fibonacci retracement zones:

  • 61.8% Fib (Approx. $3,200) – breached
  • 78.6% Fib (Approx. $3,500) – flipped into support
  • Next key level: $3,950 – $4,000 zone

This $4,000 level is not just a psychological resistance but also aligns with the Fibonacci extension and prior ATH rejection zones. If bulls can push ETH price beyond this mark, we could see rapid acceleration toward $4,200.

Ethereum Price Prediction: How High Can ETH Price Go?

Let’s estimate the next move using the most recent leg:

  • Previous swing low: $2,400
  • Current high: $3,799
  • Range = $3,799 – $2,400 = $1,399

Assuming a breakout continuation above $3,800:

  • Target 1 (100% extension) = $3,800 + $1,399 = $5,199
  • Target 2 (61.8% extension) = $3,800 + ($1,399 × 0.618) = $4,664

However, the $4,000 mark remains the most immediate hurdle to watch for this week.

Will Ethereum Correct Before Going Higher?

Possibly. The chart shows ETH price has advanced nearly 33% in less than 3 weeks. Combined with the overbought RSI, this increases the probability of either:

A pullback to support near $3,500 – $3,600

Or a sideways consolidation that resets RSI before the next move

If the Ethereum price holds above $3,500, bulls retain full control. A drop below $3,200 would invalidate the bullish structure and open doors to $2,800 again.

Can ETH Price Hit $4,000?

Yes—Ethereum price can hit $4,000 this week, based on current price momentum and lack of strong resistance until that zone. However, traders should prepare for short-term volatility. A wick above $4,000 followed by rejection is a real possibility, especially given current RSI extremes.

Summary

  • Current ETH Price: $3,731
  • Immediate Target: $4,000
  • Support Zone: $3,500 – $3,600
  • Next Bullish Target: $4,664 – $5,200 (extension levels)
  • RSI Warning: Overbought at 86.13

Ethereum price is on a rocket trajectory. The only question is: Will it pause for breath or continue the vertical rally?

Looking to Buy ETH? Try OKX

OKX is a top choice to buy ETH. With low trading fees, extensive token listings, and an intuitive interface, it’s a preferred platform for many crypto traders across Europe.

Special Promotion – Limited Time

Until September 14, 2025, OKX is hosting an exclusive McLaren F1 Team giveaway:

–> Receive a complimentary McLaren F1 Team cap<–

Enter to win a VIP trackside experience in Zandvoort (Aug 29–31)

This offer is open to all new European users who haven’t yet traded on OKX. Don’t wait – claim your reward today!

$ETH, $Ethereum, $ETHPrice, $EthereumPrice

Source link

22 07, 2025

dogecoin $1 trillion target: Dogecoin to hit $1 trillion? This analyst says it’s set to soar 2,600%

By |2025-07-22T15:29:12+03:00July 22, 2025|Crypto News, News|0 Comments

Is Dogecoin (DOGE) about to go parabolic? A popular crypto analyst known as Crypto Kaleo believes the meme coin could skyrocket by 2,600%, potentially reaching a $1 trillion market cap and trading at $6.94 per DOGE. This bold prediction is turning heads across the crypto space.

But how realistic is this moonshot?

What sparked the Dogecoin price rally?

Over the past 30 days, Dogecoin has been on a bullish run. Between June 22 and July 22, 2025, DOGE surged from around $0.15 to $0.27, marking a +77% monthly gain. A few key price moments include:

  • July 18: DOGE jumped 8% from ~$0.218 to ~$0.236
  • July 20: Another 13% spike, touching ~$0.274
  • July 22: DOGE tested $0.29 resistance but quickly pulled back to $0.26–$0.27 range

This rise has revived retail and institutional interest, despite ongoing volatility.

What’s driving Dogecoin’s momentum right now?

Big-money bets and whale activity

In a major move, Bit Origin invested $500 million into Dogecoin, acquiring 40 million coins near the $0.24 level. However, even with corporate backing, DOGE remains volatile—sliding back after hitting local highs.

Technical indicators support short-term strength

  • 50-day Moving Average: Trending bullish since mid-July
  • 200-day MA: Flat to slightly bearish
  • RSI (Relative Strength Index): Currently overbought, signaling a possible cool-off or sideways action

While momentum is in DOGE’s favor, resistance near $0.29–$0.30 could test investor patience in the short term.

What does Crypto Kaleo predict for DOGE?

Kaleo, a well-followed pseudonymous trader on X (formerly Twitter), says Dogecoin is gearing up for an “imminent God candle”—a dramatic upward spike. His long-term projection: DOGE could repeat its historic 10% market cap ratio to Bitcoin, assuming Bitcoin hits a $10 trillion cap (~$500,000 per BTC). That math leads him to a $1 trillion DOGE valuation, or roughly $6.94 per coin.

Short-term view: A decisive breakout above $0.26–$0.30 could lead to rapid upside, likely toward $0.40–$0.45.

What does AI say about DOGE’s short-term path?

According to Grok AI, Dogecoin has formed a bullish technical structure. The algorithm projects an ideal sell zone between $0.32 and $0.45, which translates to a 20–70% upside if current momentum continues.

This aligns with manual technical readings and volume spikes seen in recent days.

Is a $1 trillion Dogecoin realistic?

Perspective Details
Historical Ratio DOGE once reached ~10% of Bitcoin’s market cap in past bull cycles.
Math adds up A $1 trillion DOGE cap = ~$6.94 per coin = 2,600% from current levels.
Reality check DOGE has no hard cap, minimal utility, and remains driven by sentiment.
Market challenge Reaching $1T would require massive retail + institutional buy-in.

In short: it’s possible in theory, but very difficult under current fundamentals.

Dogecoin price prediction: Short, mid, and long term

Timeframe Scenario Target Price
1–6 weeks Short-term breakout continues $0.32–$0.45
3–6 months Adoption + crypto rally extends run $0.50–$1.00
1–2 years (peak) Bitcoin at $500k, DOGE hits 10% of BTC market cap $6.00–$7.00

What risks should DOGE investors consider?

  1. Short-term overbought: RSI is flashing caution signs near $0.27–$0.29.
  2. Whale exits: Large holders could take profits near $0.30+, causing price dips.
  3. Lack of fundamentals: Unlike ETH or BTC, DOGE has limited development and use cases.
  4. Supply inflation: No supply cap, meaning DOGE’s tokenomics may limit upside.

Is Dogecoin a millionaire-maker or moon-meme?

  • Short-term: Gains of 20–70% are realistic, especially if DOGE clears $0.30 with volume.
  • Mid-term: Breaking $1 needs more adoption, partnerships, and less meme-dependency.
  • Long-term: Hitting $6.94 would be historic—but highly speculative.

Kaleo’s $1 trillion call is ambitious, but not impossible in a full-blown crypto supercycle. For now, most investors would be wise to target the $0.45–$1.00 range unless DOGE starts showing real-world utility.

FAQs on Dogecoin price prediction

Q1: Can Dogecoin really reach a $1 trillion market cap?
Yes, but it’s highly speculative and depends on a massive crypto market rally.

Q2: What is Crypto Kaleo’s Dogecoin price prediction?
He sees DOGE surging to $6.94, a 2,600% gain, if Bitcoin hits $500K.

Q3: Will Dogecoin keep bouncing around $0.26–$0.30 today?
Likely yes—DOGE often trades between resistance near $0.30 and support around $0.26 during short-term volatility.

Q4: Can trading signals help predict Dogecoin’s price today?
Yes, tools like RSI (overbought/oversold) and 50‑day moving average trends offer clues on potential short-term moves.

Source link

Go to Top