The main tag of Crypto News Today Articles.
You can use the search box below to find what you need.
[wd_asp id=1]

15 07, 2025

Solana Stalls at $165 During Pump.Fun $5.6B Launch

By |2025-07-15T15:55:49+03:00July 15, 2025|Crypto News, News|0 Comments

Solana

SOL
$164.1


24h volatility:
0.6%


Market cap:
$88.00 B


Vol. 24h:
$14.43 B


price traded sideways near $163 on Monday, July 14, stalling below the $165 resistance despite positive sentiment within the broader altcoin markets.

While Bitcoin

BTC
$120 047


24h volatility:
0.9%


Market cap:
$2.39 T


Vol. 24h:
$67.78 B


hit new all-time highs and triggered double-digit breakouts across altcoins like Ethereum

ETH
$3 008


24h volatility:
0.3%


Market cap:
$363.10 B


Vol. 24h:
$40.12 B


, Ripple

XRP
$2.95


24h volatility:
3.1%


Market cap:
$174.47 B


Vol. 24h:
$10.83 B


, and Sui

SUI
$3.85


24h volatility:
9.6%


Market cap:
$13.29 B


Vol. 24h:
$1.00 B


, with each climbing past $3,000, $3, and $4 respectively, Solana has returned just 9.2% over the past week.

Notably, this underperformance comes even as sentiment surrounding the Solana ecosystem remains positive.

The slowdown in SOL price momentum coincided with the high-profile token launch of Pump.Fun, a memecoin generator platform built on Solana.

After raising $500 million during its weekend ICO across major CEXs, PUMP went live for trading on July 14 with a $5.6 billion fully diluted valuation, opening at $0.0056 and briefly peaking at $0.0065.

However, demand overwhelmed several platforms. Kraken and Bybit faced severe user backlash due to technical failures during the presale. Both exchanges pledged compensation, Kraken through secondary market purchases and Bybit via fee rebates.

This chaotic rollout may have diverted liquidity and attention from SOL itself. First, investors may have rotated capital into PUMP, dampening near-term demand for SOL.

Second, the controversy surrounding exchange access likely dampened investor confidence especially with Solana’s infamous history of costly network outages during periods of peak market activity in recent years.

Against this backdrop, SOL may remain capped below $170 in the short term until the uncertainty surrounding the Pump.Fun token launch clears.

Solana Price Prediction: Bulls Eye $179 as Key Resistance Holds

Solana’s price remains trapped below the $165 ceiling despite a broader altcoin rally. The chart shows that SOL tested the $170 resistance twice within 48 hours but failed to break higher, suggesting strong seller presence at that level. However, price action continues to hold above the red support zone at $153, which now acts as a bullish pivot.

Solana price prediction | SOLUSDT

If buyers reclaim $165 on a daily close, the next upside target lies at $179, which aligns with the upper Donchian channel. The RSI hovers near 63, leaving room for another leg up before conditions turn overheated.

Volume remains neutral, indicating consolidation rather than capitulation. A breakdown below $153 would invalidate this bullish setup and expose SOL to potential retracement towards the $144 support. For now, consolidation above $160 suggests bulls are preparing for another breakout attempt.

Solaxy Presale Gains Traction as Solana Ecosystem Heats Up

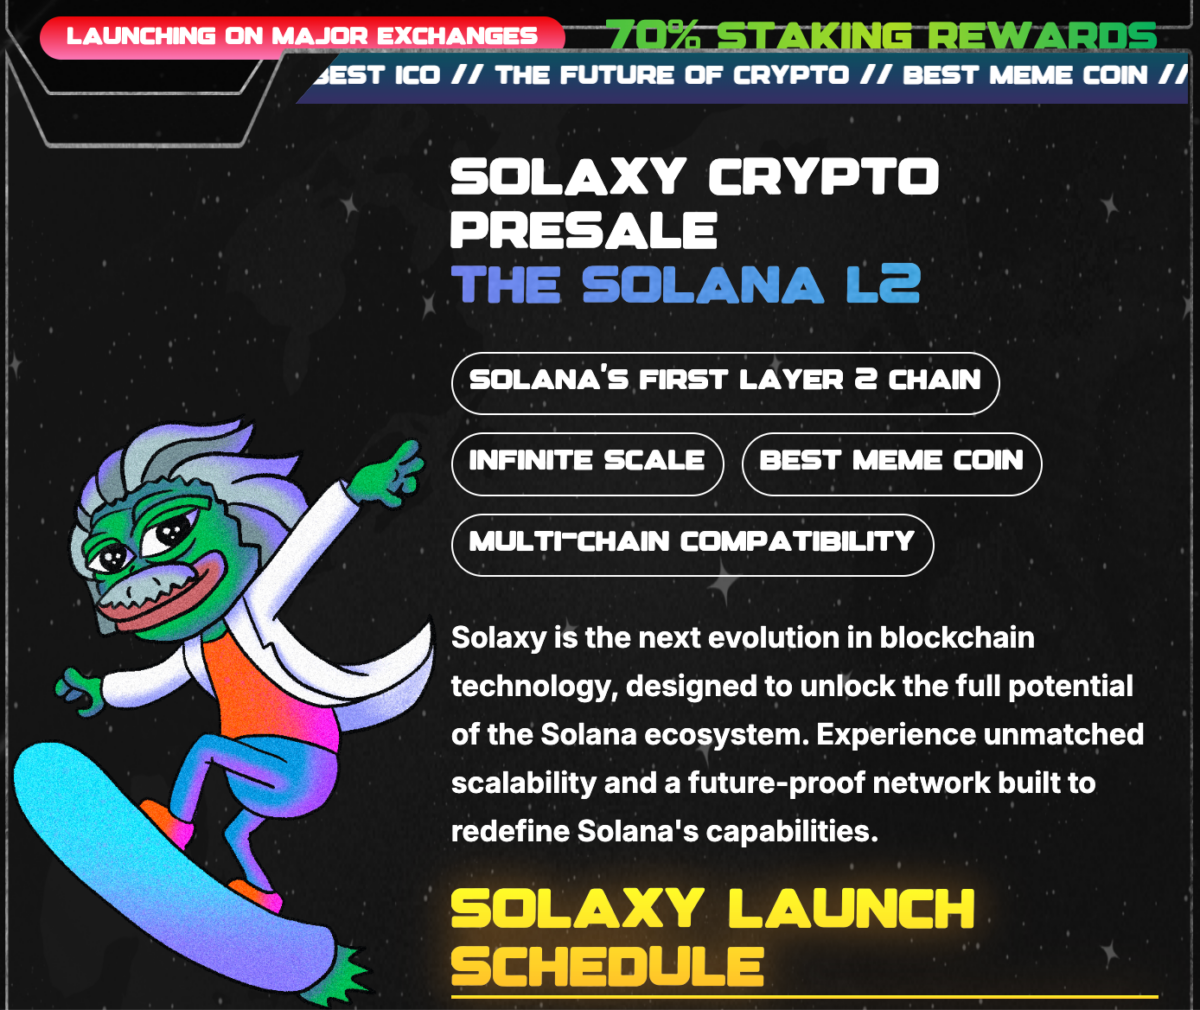
As Solana projects like Pump.Fun dominate market headlines, infrastructure plays are seeing renewed attention. Now live in presale, Solaxy ($SOLX), Solana’s first Layer-2 chain, Solaxy aims to power the next generation of Solana-native applications, from DeFi to meme tokens.
Solaxy Presale

Solaxy Presale

With staking rewards up to 71%, early SOLX buyers gain high-yield exposure to one of 2025’s most anticipated launches. As SOL attempts to clear $165, capital rotating into Solana ecosystem infrastructure could accelerate. The Solaxy token contract is live, and staking has already begun, visit the official Solaxy website to join.

The post SOL Price Analysis: Solana Stalls at $165 During Pump.Fun $5.6B Launch appeared first on Coinspeaker.


Source link

15 07, 2025

Is a Massive Rally About to Begin?

By |2025-07-15T13:54:51+03:00July 15, 2025|Crypto News, News|0 Comments

BNB, the native token of the Binance ecosystem, has been showing renewed strength in recent weeks, catching the attention of traders and investors alike. After consolidating for months in a sideways range, BNB has finally broken above key levels and is now testing major resistance near $690–$700. With the broader crypto market stabilizing and altcoins beginning to regain momentum, many are asking the same question: Is BNB gearing up for a major breakout? In this article, we dive deep into the daily chart structure, key indicators like RSI, Fibonacci projections, and short-term support and resistance zones to provide a data-driven price prediction for BNB in July 2025.

BNB Price Prediction: What’s Happening with BNB Right Now?

BNB/USD Daily Chart- TradingView

BNB price is currently trading around $681.60 after experiencing a sharp rejection near $690, as seen in today’s Heikin Ashi daily chart. While the price shows strong recent bullish momentum, the red candle forming today suggests hesitation from buyers near the upper resistance zone. This might be a short-term pullback rather than a trend reversal.

On the Relative Strength Index (RSI), the reading stands at 61.16, indicating healthy bullish territory—but not yet overbought. This is a critical observation because BNB still has room to move higher before hitting major resistance zones.

Where Is the Resistance and Can BNB Break Through?

Zooming into the Fibonacci retracement levels drawn from the recent swing low around $500 to the high near $720, the price appears to be consolidating between the 0.618 retracement level (~$675) and resistance around $700–$710.

The $700–$710 area is acting as a psychological and technical resistance. If BNB decisively breaks this level on strong volume, the next upside target is around $750, a major extension zone from recent Fibonacci projections.

To calculate the Fibonacci extension:

  • Swing Low: $500
  • Swing High: $720
  • 1.618 extension target = $500 + 1.618 * ($720 – $500) = $500 + 1.618 * $220 = $855.96

While $855 seems too ambitious for July, it reinforces the longer-term bullish thesis if $750 is broken this month.

Is This Just a Pullback or the Start of a Reversal?

Today’s red Heikin Ashi candle after several strong green candles could signal a minor correction, not a trend change. Heikin Ashi smooths out price noise, so red candles after a run-up often suggest consolidation rather than an immediate drop. Furthermore, the price is still comfortably above the recent support at $677, which corresponds to the 0.618 Fib level.

If BNB price holds this level, the structure remains bullish. A break below $675, however, could lead to a quick test of the $650 zone.

What Is RSI Telling Us About BNB’s Strength?

The RSI (14) sitting at 61.16 is significant. It shows that the asset is in bullish momentum but is not yet overbought. RSI over 70 typically signals a market top is near. BNB price still has breathing room to run up before exhausting buying pressure.

If RSI climbs toward 75, we may anticipate a short-term top between $735–$750, which aligns with previous price action resistance from April 2024.

BNB Price Prediction for July 2025

If current momentum continues and BNB price breaks above $700 with volume confirmation, the next price targets are:

  • Short-term: $710 (minor resistance), $735 (measured move target), and
  • Mid-term: $750–$765 (psychological + extension resistance)

BNB needs to hold the $675 support in the next 48–72 hours to keep this bullish setup intact. If $675 is lost, downside targets shift to $650 and potentially $620.

Can BNB Hit $750?

Yes, but with conditions. A break and hold above $700 this week could propel BNB price to $735–$750 by the end of July. This move would be supported by continued RSI strength, bullish momentum seen on Heikin Ashi candles, and the ongoing formation of higher highs and higher lows. However, a breakdown below $675 would invalidate this bullish view.

Looking to Buy BNB? Try OKX

OKX is a top choice to buy BNB. With low trading fees, extensive token listings, and an intuitive interface, it’s a preferred platform for many crypto traders across Europe.

Special Promotion – Limited Time

Until September 14, 2025, OKX is hosting an exclusive McLaren F1 Team giveaway:

–> Receive a complimentary McLaren F1 Team cap<–

Enter to win a VIP trackside experience in Zandvoort (Aug 29–31)

This offer is open to all new European users who haven’t yet traded on OKX. Don’t wait – claim your reward today!

$BNB, $BNBPrice

Source link

15 07, 2025

Dogecoin Price Prediction: Can DOGE Hit $1 as JetBolt Continues to Amaze

By |2025-07-15T11:54:02+03:00July 15, 2025|Crypto News, News|0 Comments

With Bitcoin and Ethereum posting sharp gains, traders are eyeing fresh opportunities across the market with fan favorite Dogecoin and trailblazing newcomer JetBolt. On one hand, Dogecoin (DOGE) is riding renewed meme coin enthusiasm, with analysts like Ali Martinez highlighting $0.19 as a crucial level to defend. 

On the other hand, JetBolt (JBOLT) is capturing headlines with its jaw-dropping 358 million presale revenue. This utility-focused altcoin features zero-gas transfers, near-instant finality, and an engagement-based staking protocol; making JetBolt one of the more exciting presales to watch right now.

Can’t get enough of Dogecoin? Curious why JetBolt is garnering so much attention with the crypto market’s comeback? In this detailed piece, we’ll uncover the key events shaping Dogecoin and JetBolt’s narratives. 

Expert Says Dogecoin Bulls Need To Defend $0.19 Price Before Next Breakout

Meme coin favorite Dogecoin (DOGE) is testing the patience of bulls and skeptics alike as it holds tight above the $0.20 handle. Over the weekend, DOGE’s price bounced back after briefly flirting with a dip below $0.19—a level Ali Martinez recently flagged as pivotal support for the next leg higher. 

TradingView chart showing Dogecoin’s current support level is at $19

His latest chart shows how defending this zone keeps the door open for Dogecoin to retest the $0.23–$0.25 range if buying pressure holds up.

What’s keeping traders glued to this playful coin isn’t just nostalgia for memes; it’s the persistence of retail flows and whale wallets that haven’t stopped accumulating since last month. 

According to on-chain data, mid-sized DOGE holders have quietly added over 200 million coins since June, hinting at a silent vote of confidence.

For now, traders eye the $0.19 line like a tripwire. If it holds, Dogecoin’s community might just find more tailwind for another playful surprise rally.

JetBolt Rides Market Optimism with Zero-Gas Transfers and Instant Utility

As the crypto market roars back to life alongside Bitcoin’s relentless climb, JetBolt (JBOLT) is taking advantage of this wave of optimism with its own momentum that’s hard to ignore. 

While most presale tokens make buyers wait for real utility, JetBolt flips that tired script by putting powerful tools in users’ hands early on.

JetBolt offers zero-gas transfers and near-instant finality, eliminating the friction and cost present even among traditional blockchain platforms. Within JetBolt, transactions settle fast without incurring typical gas fees, making JBOLT tokens practical for daily use.

Beyond this, JetBolt’s Alpha Boxes remain a standout attribute for early buyers. These tiered bundles reward presale purchasers with up to 25% extra tokens, adding a fun draw before the next price increase hits at presale. 

Taken together, these features—gasless transfers, instant finality, presale perks, and AI—form the backbone of JetBolt’s edge.

Dogecoin Price Prediction: Can DOGE Hit  as JetBolt Continues to Amaze

Final Thoughts: Dogecoin and JetBolt in Focus

As Dogecoin’s loyal army watches for the next move above $0.20, all eyes are on whether bulls can turn Martinez’s key support level into a fresh launchpad for more gains. 

Meanwhile, JetBolt’s feature-rich presale—from near-instant transactions to AI-powered utility— positions it as one of the compelling choices for crypto enthusiasts. With more than 358 million tokens sold, JetBolt shows the world that clear use cases matter at the end of the day. 

Learn more about JetBolt’s innovative utility and exciting presale perks by visiting jetbolt.io

This article does not constitute financial or trading advice. Cryptocurrencies are highly volatile assets, and past performance does not guarantee future results. Always conduct your own due diligence and never spend more than you can afford to lose.

Source link

15 07, 2025

Cardano Flashes Major Buy Signal—$1.90 Target Unleashed

By |2025-07-15T09:52:07+03:00July 15, 2025|Crypto News, News|0 Comments

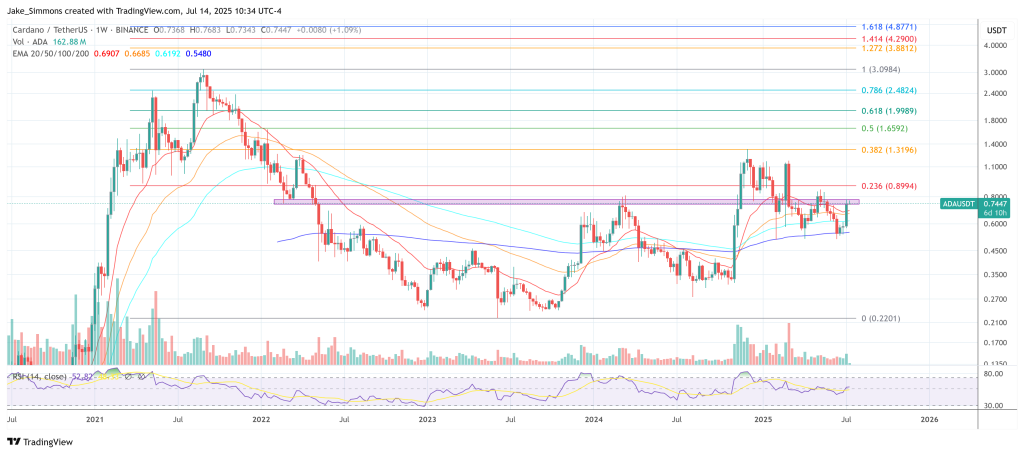
Crypto analyst Investing Broz has spotlighted Cardano (ADA) as one of the most promising altcoins currently breaking out amid a shifting macro landscape and rising Bitcoin valuations. In his latest video update, the analyst identified ADA’s recent technical breakout as a clear sign of bullish momentum, forecasting a price target of $1.90 in the coming weeks if momentum holds.

Cardano Bull Run Is Back On

Investing Broz began the segment by reiterating the broader context: Bitcoin’s explosive rally above the $120,000 mark has reignited speculation around the arrival of altseason. “This is just one more egg in the basket of potentially altcoin season coming very soon,” he noted, citing Bitcoin dominance breaking below a critical support level and altcoins “going berserk.”

Among the altcoins leading the charge, Cardano stood out. The analyst confirmed that he purchased ADA in the past 24 hours, identifying the move as more than just opportunistic. The trigger? A confirmed breakout above a long-standing resistance level that ADA hadn’t pierced since March 1. “This is a major win for Cardano holders who are trading it,” he said, explaining that a falling wedge pattern had been developing for weeks and now signaled a shift in trend.

Investing Broz’s trading group had initially positioned long at $0.54, with a modest target of $0.80. But as he emphasized, “Cardano is not just breaking above the smaller resistance level—we’re breaking above a resistance level we haven’t been back above since March.” That March breakout, he reminded viewers, was spurred by a now-infamous Donald Trump tweet listing altcoins deemed suitable for a proposed American crypto reserve. While that spike proved short-lived, the current breakout is, in his view, fundamentally and technically sound.

To calculate a realistic upside scenario, he applied the traditional breakout target technique by measuring the height of the formation and projecting it forward. “This would give you a Cardano price prediction of $1.90,” he stated, while also noting that such a target might be ambitious for a summer timeframe. Still, “it’s absolutely doable and definitely something you guys should be keeping an eye on.”

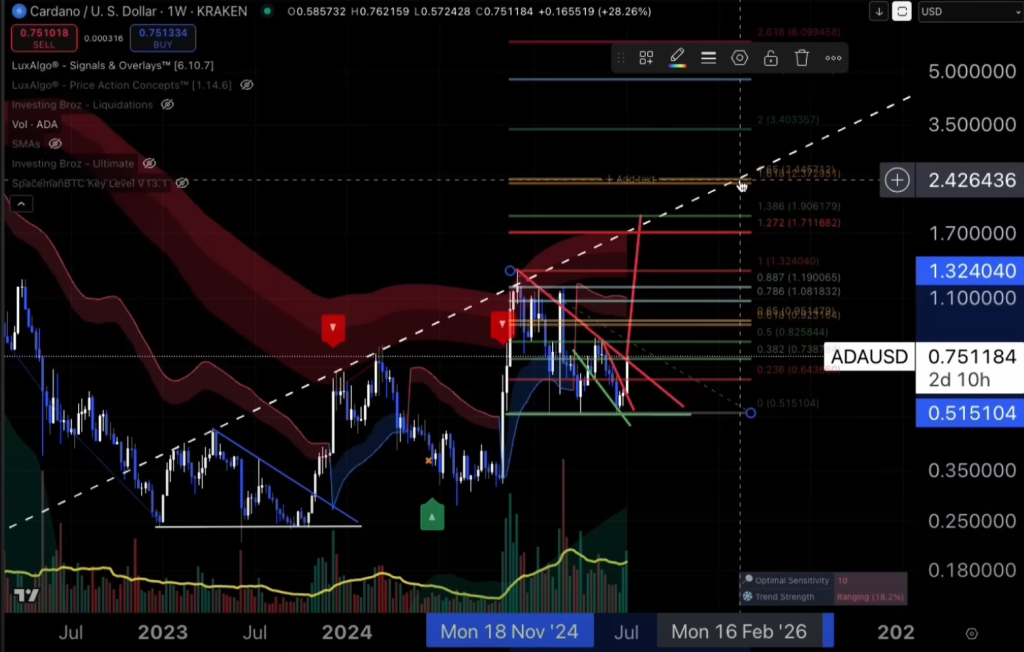
The analyst reinforced his bullish outlook using confirmation from the LuxAlgo indicator suite, which flashed a weekly buy signal—featuring a green reversal, bullish momentum, and positive money flow. Based on this, he offered a more immediate price range between $1.00 and $1.80. “I don’t think we’re going to stop at $1.80, but I think it’s a target to keep an eye on if you’re looking for a trade,” he said. Beyond that, a golden pocket Fibonacci extension points to a key level of $2.42 by year’s end.

Cardano price analysis

However, Investing Broz was quick to clarify that these are not his full-cycle targets for ADA. “This is not my long-term bullish price prediction for this bull market,” he emphasized. “This is simply tradable movements that I still think can happen over the next couple of weeks.” His earlier predictions suggested ADA could hit $7 to $10 by the cycle top—possibly extending into 2026 or even 2027.

Throughout the segment, he stressed the importance of knowing when to take profit. “Every bull market has volatility. Cardano… is going to have volatile movements where they rally and then pull back,” he advised. For short-term traders, targets around $1.80 to $2.40 may present ideal levels to secure gains or even explore short positions if momentum wanes.

While ADA is not the only altcoin the analyst is tracking—Ono and HAR were also highlighted for similar

breakout behavior—Cardano’s confluence of technical strength, historical resistance flip, and volume surge make it a standout in the current environment. As the analyst concluded, “There’s still time… this is a major breakout, and if you’re a trader, this is what you wait for.”

Cardano, for now, has flashed its signal. Whether it makes good on the $1.90 target may depend not only on its own momentum, but on the broader timing of altseason’s long-awaited arrival. At press time, ADA stood at $0.7447.

Cardano price

Source link

14 07, 2025

Ripple (XRP) Surges 12% as Altcoins Rally with Bitcoin’s Climb

By |2025-07-14T15:08:40+03:00July 14, 2025|Crypto News, News|0 Comments

Ripple (XRP) and Sui (SUI) have both experienced significant price surges, approaching their all-time highs. The altcoins are making substantial moves as Bitcoin (BTC) continues its climb, indicating a potential shift in market dynamics. The Total2 index, which tracks all cryptocurrencies excluding BTC, has shown strong support at the $1.01 trillion level and has recently broken through the $1.27 trillion resistance level, turning it into support. This suggests a bullish trend for altcoins, with the next significant resistance level at $1.47 trillion.

Ripple (XRP) is on a trajectory to surpass its all-time high, with a 50% price increase over the past four weeks. The cryptocurrency has recently tagged the $3.00 horizontal resistance level and is poised to reach its all-time high of $3.40. Technical indicators such as the RSI and Stochastic RSI suggest there is still room for further upside, with the 1.618 Fibonacci level at $4.50 as a potential target.

Sui (SUI) is also nearing its last major horizontal resistance level, with a potential breakout that could drive the price back to its all-time high of $5.37. The Fibonacci extension levels for SUI’s move from $5.39 to $1.70 indicate that the cryptocurrency could reach $7.63 and potentially beyond during the rest of this bull market. The open interest in SUI has increased, reflecting traders’ bullish sentiment and optimism about its future prospects.

Ripple (XRP) has seen a notable increase in price, trading at $2.95 at the time of writing on Monday, up from $2.80 and observing a 5.52% increase in the last 24 hours. The surge in XRP’s price is supported by strong institutional volume, which has helped the cryptocurrency break through the $2.84 resistance level. XRP’s recent surge has propelled it past USDT in market rankings, driven by renewed interest from institutional investors and strategic advancements by Ripple. The latest XRP price prediction has analysts anticipating an explosive breakout, with some expecting a charge to $10. XRP is currently trading at $2.78, up 12%.

Top analysts are forecasting a potential surge for XRP between $3 and $6 before the year ends, highlighting it as one of the best cryptocurrencies to buy now. The surge in XRP’s price is also supported by a 9% increase in the last 48 hours, driven by renewed interest from institutional investors and strategic advancements by Ripple. The cryptocurrency’s price could continue to rise in the coming days, as analysts remain bullish on its future prospects.

Source link

14 07, 2025

Binance Coin (BNB) Price Prediction for July 10

By |2025-07-14T13:07:36+03:00July 14, 2025|Crypto News, News|0 Comments

The situation on the market remains the same as most of the coins are in the green zone, according to CoinMarketCap.

Top coins by CoinMarketCap

BNB/USD

The rate of Binance Coin (BNB) has risne by 1.2% over the last day.

Article image
Image by TradingView

On the hourly chart, the price of BNB is in the middle of the narrow channel, between the support of $668,45 and the resistance of $673,21. 

You Might Also Like

Title news

As most of the daily ATR has been passed, there are low chances of seeing sharp moves by tomorrow.

Article image
Image by TradingView

On the longer time frame, the rate of the native exchange coin has bounced off the resistance of $674. If the daily bar closes far from that mark and with a long wick, there is a chance of witnessing a correction to the $665 zone.

Article image
Image by TradingView

From the midterm point of view, one should focus on the weekly candle closure in terms of the $673.43 level. If it happens around it or above, the accumulated energy might be enough for an ongoing upward move to the $700 area.

BNB is trading at $671.10 at press time.

Source link

14 07, 2025

Elon Musk’s AI Chatbot Grok Predicts XRP Price Surge to $400

By |2025-07-14T11:06:45+03:00July 14, 2025|Crypto News, News|0 Comments

Elon Musk’s advanced AI chatbot, Grok, has recently sparked significant interest in the cryptocurrency community by forecasting ambitious price targets for XRP. These projections, ranging from $10 to an astonishing $400, are based on hypothetical scenarios where the U.S. money supply rapidly increases and Ripple’s payment network outperforms the traditionally dominant SWIFT. Since the beginning of the year, Grok’s predictions have generated considerable excitement in the ever-evolving cryptocurrency landscape.

Grok envisions a future where XRP plays a central role in global financial transactions, potentially managing trillions of dollars daily. This scenario is fueled by high inflation leading to a depreciation of the dollar and banks seeking the efficiencies offered by Ripple’s framework. Within this context, Grok identifies a potential stabilization of XRP’s value between $100 and $200. However, the AI model also acknowledges that the chances of such a dramatic escalation are limited.

If XRP’s network usage expands significantly, Grok foresees sustained demand for the coin. With regulatory clarity supporting unified banking systems, XRP prices might hit an optimistic $350-$400. However, a more measured perspective suggests XRP’s value may climb to the $10-$15 range from 2025 to 2027. This more conservative prediction considers factors like growing institutional interest, Ripple’s service expansion, and the progressive clarity of crypto regulations. According to Grok, easing regulatory constraints could elevate transaction volumes progressively.

In reaction to these forecasts, XRP saw a 6% uptick, approaching the $3 resistance benchmark. Analysts indicate that breaking this threshold—unattained since March—might shift the focus to a $5 objective. Current volume metrics reveal that the upward momentum remains strong, hinting the climb might continue.

Key takeaways from Grok’s predictions include: XRP could potentially stabilize between $100–$200 if it becomes a leading global currency. Under optimistic circumstances, XRP might hit $350-$400, although chances are slim. A realistic growth projection estimates XRP reaching $10-$15 in the next few years. Recent activity suggests strong momentum with the potential to surpass the $3 resistance level.

The buzz generated by these forecasts highlights the growing influence of AI in financial prediction markets, as well as the persistent volatility and dynamism of the cryptocurrency sphere. XRP’s future is thus painted with a wide brush, encompassing both bold aspirations and tempered expectations.

Ripple’s XRP has seen a surge in interest, driven by bullish forecasts and strategic developments. The cryptocurrency recently broke past the $2.60 mark and is now eyeing the $3.00 threshold, fueled by growing optimism among investors. This bullish momentum has led analysts to speculate whether XRP could realistically reach $15 by the end of 2025, although this figure is based on analyst forecasts and not guaranteed.

The recent developments surrounding Ripple have further bolstered investor confidence. The company’s request for a banking license and the Securities and Exchange Commission (SEC) dropping its case against Ripple have been cited as key drivers behind the price surge. Analysts are now setting their sights on targets of $3.25 and even $4.35 by the end of the month, reflecting the positive sentiment in the market. Additionally, XRP is currently trading at $2.17, with some analysts predicting a potential rally to $2.48 and eventually $5.00. These forecasts are based on the current market conditions and the strategic moves made by Ripple.

The integration of artificial intelligence (AI) with cryptocurrency has also been a topic of interest. Coinbase CEO Brian Armstrong has made a significant prediction regarding the potential of AI in the crypto space, suggesting that it could unlock substantial value. This prediction has added to the excitement surrounding XRP, as the cryptocurrency is seen as a potential beneficiary of AI advancements. The combination of strategic developments and AI integration has created a favorable environment for XRP, with investors and analysts alike expressing optimism about its future prospects.

Source link

14 07, 2025

Cardano Price Prediction: ADA Positioned for Squeeze as Key Shorts Face Pressure at $0.74

By |2025-07-14T09:05:38+03:00July 14, 2025|Crypto News, News|0 Comments

Cardano is pressing against a key resistance zone near $0.74, with rising momentum and whale activity hinting at a potential breakout toward $0.90.

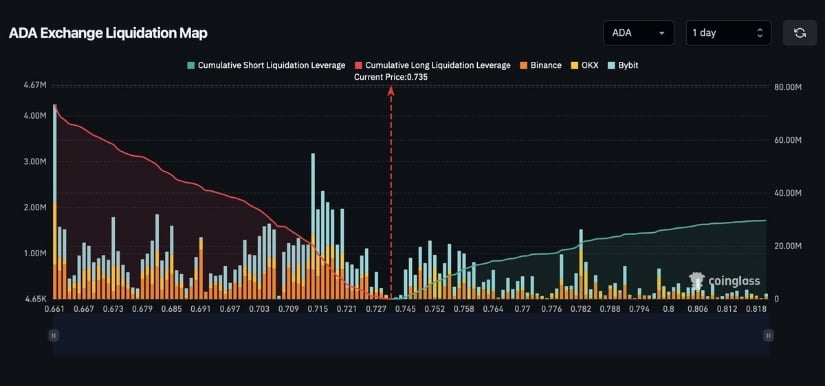
Cardano is gaining momentum as it pushes toward the key $0.74 level, where over $60 million in shorts are at risk. With fresh upside pressure building and whales quietly stepping in, a breakout here could trigger a sharp move toward $0.90 and set the stage for a much larger rally.

Cardano Breaks Out of Downtrend, Eyes $1.20 Upside Range

After months of being pinned inside a steep descending channel, Cardano (ADA) is finally starting to show signs of breaking free. As shared by a famous chartist, Ali Martinez, the price has pushed through a key trendline that’s been capping upside since March, signaling a possible structure shift from bearish compression to bullish expansion. The breakout levels were around the $0.70 to $0.705 zone, and price action is now pressing higher with momentum on its side.

Cardano breaks out of a multi-month downtrend, reclaiming key levels with momentum building above $0.70. Source: Ali Martinez via X

Technically, this opens the door to a potential rally toward the $0.90 to $1.20 range, levels that haven’t been seen since early Q1. If ADA can flip this breakout zone into support over the next few sessions, that confluence of trend reversal and breakout continuation could fuel a mid-term move.

Cardano Price Approaches $0.74 Trigger Zone With $60M in Shorts on the Line

The breakout above $0.74 on Cardano’s chart is starting to carry more weight than just a trendline reclaim. According to TapTools, over $60 million in ADA short positions are stacked at $0.74 level, and they’re now at risk of liquidations.

Cardano Price Prediction: ADA Positioned for Squeeze as Key Shorts Face Pressure at alt=

Over $60M in ADA shorts are stacked at $0.74, creating a potential liquidation squeeze. Source: TapTools via X

That kind of liquidation zone can act as fuel for accelerated price action, especially when the broader setup is already leaning bullish. With the price hovering around $0.735, it’s inching dangerously close to the liquidation threshold.

If ADA can push just a little higher and trigger that wave of forced exits, the resulting momentum could push the Cardano price toward the $0.80 to $0.90 range very quickly.

Whales Step In Aggressively as Momentum Builds

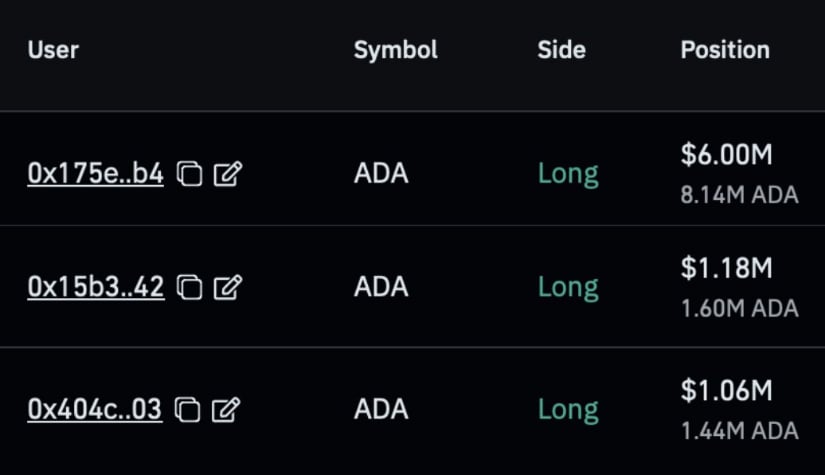
While retail traders keep their eyes on the $0.74 liquidation zone, some larger players appear to be making their move ahead of time. On-chain data from TapTools shows several whale wallets opening fresh long positions on Cardano, with allocations ranging from $1 million to a substantial $6 million.

Whales Step In Aggressively as Momentum Builds

Whale wallets accumulate $1M–$6M in ADA ahead of key resistance break. Source: TapTools via X

This influx of capital lines up well with ADA’s broader technical setup. Price has reclaimed key trendlines, liquidation pressure is mounting above, and now the presence of whales adds a layer of conviction. If these positions were timed in anticipation of a squeeze or trend extension, Cardano may see acceleration once the $0.74 barrier is breached.

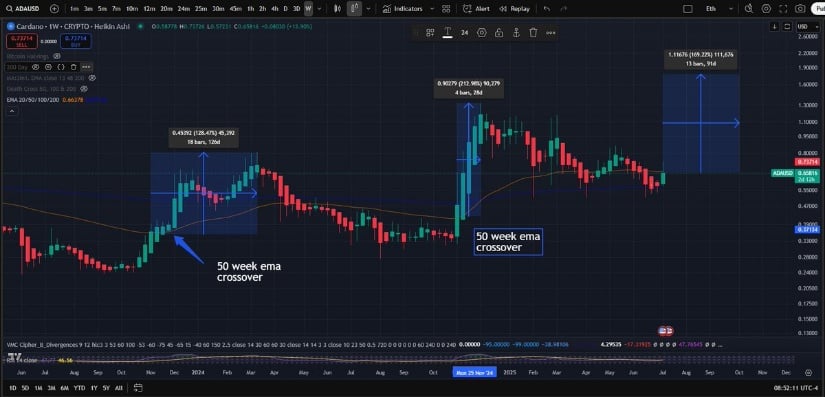
Cardano Price Prediction: ADA Eyes $1.77 Once 50-Week EMA Breaks

Cardano Price is now retesting its 50-week exponential moving average (EMA), a technical level that has historically marked the start of major rallies. According to the chart shared by Deezy, the last two times ADA broke above this, it rallied 212% and 128%, averaging a gain of about 170%. If history repeats, this could place ADA somewhere around the $1.75 mark in the coming months.

Cardano Price Prediction: ADA Eyes $1.77 Once 50-Week EMA Breaks

Cardano retests its 50-week EMA, a level that previously triggered +100% rallies. Source: Deezy via X

While fractals do have their limitations but the 50-week EMA is often seen as a major inflection point for long-term trend shifts. With ADA currently hovering near $0.732 and holding momentum after reclaiming previous resistance zones, this EMA retest could act as the next key breakout trigger.

Cardano Short-Term Outlook

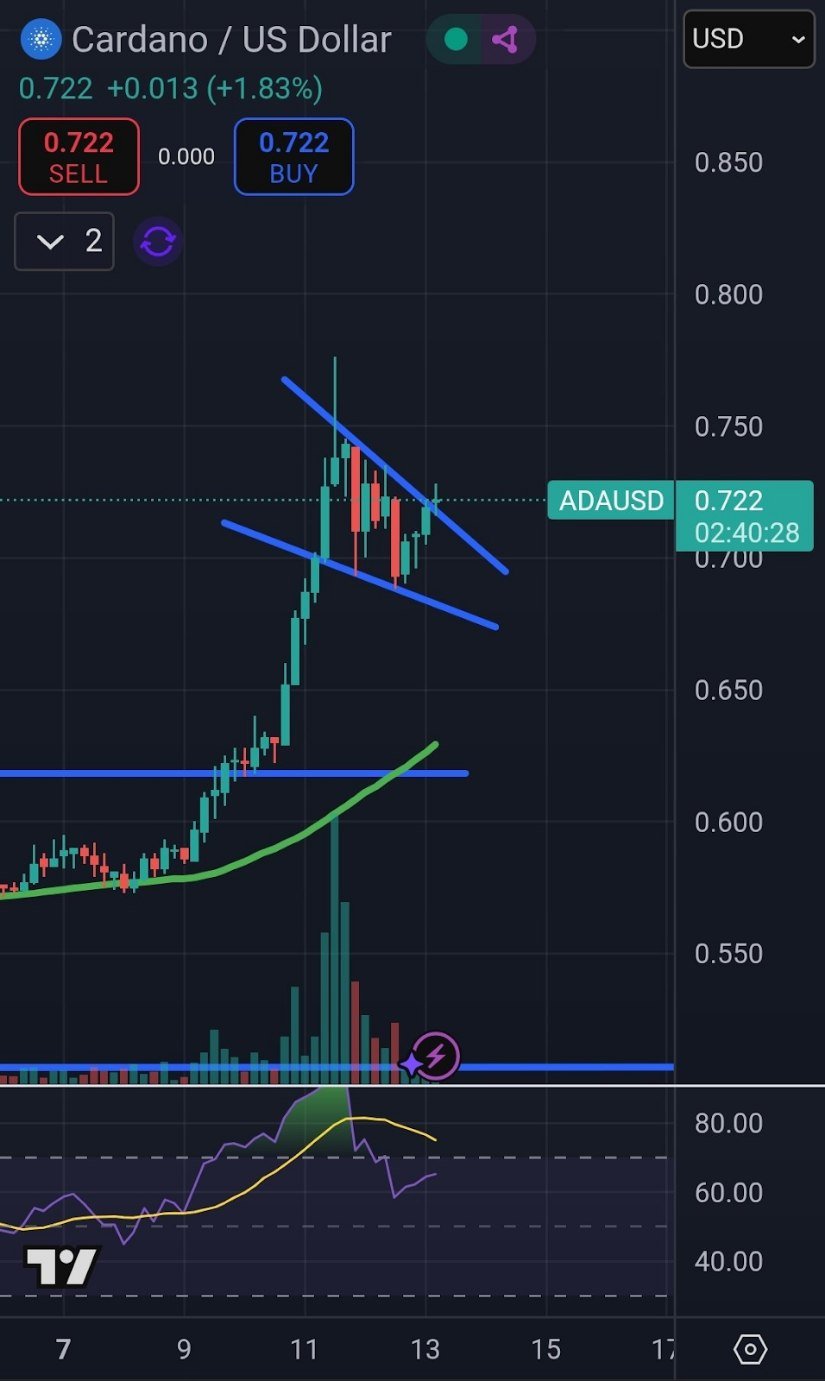
Cardano is now showing signs of forming a bullish flag on the 4H chart, a continuation pattern that usually follows a strong price move. The current consolidation sits between $0.70 and $0.74, with a breakout potentially targeting the $0.95 to $1.00 range. As shared by Av_Sebastian, price action has tightened inside the flag, suggesting low weekend volume may be delaying a move until early next week.

Cardano Short-Term Outlook

Cardano forms a bullish flag on the 4H chart, with a breakout above $0.74 eyeing a short-term move toward $1.00. Source: Av_Sebastian via X

This flag formation comes just as ADA recently flipped the $0.70 zone into support. If buyers step in and push ADA past the upper flag boundary, it would align with the broader bullish trend. Meanwhile, this breakout could act as a short-term catalyst on the way to that $1.77 longer-term target.

Final Thoughts

Cardano’s setup right now looks like one of the cleanest in the market, with a bullish flag on the 4H and strong breakout structure on the daily. The $0.74 level is the trigger ADA is watching, and if it breaks, a sharp move toward $0.90 or higher becomes likely. With momentum building and the 50-week EMA retest in play, ADA is shaping up to be one of the more promising large-cap plays heading into the next leg of the cycle.


Source link

14 07, 2025

Ripple Price News: XRP Bulls Target $50 in Long-Term Rally Backed by Rare Candle Formation

By |2025-07-14T05:03:22+03:00July 14, 2025|Crypto News, News|0 Comments

XRP is capturing market attention once again, with analysts and investors zeroing in on a rare technical signal and a fresh surge in momentum.

The combination of price action, historical patterns, and growing institutional interest is fueling speculation that the XRP price could be on track for a major breakout—with targets as high as $50.

XRP Price Climbs Amid Market Rebound

The XRP price today sits around $2.84, marking over 5% gain in the past 24 hours. The token recently touched $2.90—its highest level since March—before retreating slightly. Over the past week, XRP has gained more than 23%, signaling renewed bullish momentum in the market.

Ripple (XRP) was trading at around $2.849, up 5.64% in the last 24 hours at press time. Source: XRP Liquid Index (XRPLX) via Brave New Coin

Although the broader crypto landscape is still awaiting a confirmed “altcoin season,” XRP has managed to outperform many peers. Out of the top 100 non-stablecoin assets, only 28 have outpaced Bitcoin over the last 90 days. Despite that, XRP’s performance stands out, driven by technical indicators and long-term bullish sentiment.

Rare Candle Formation Signals Long-Term Bullish Potential

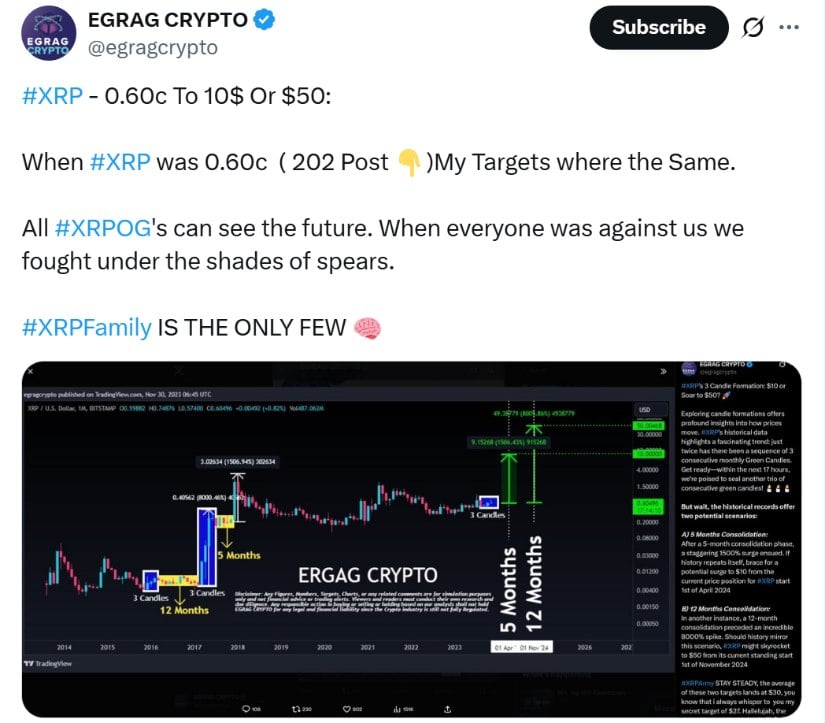
One of the most compelling catalysts behind the latest XRP price prediction is a rare three-candle formation on the monthly chart. Market analyst EGRAG Crypto, who initially identified the pattern back in late 2023, believes this structure could precede a dramatic price rally.

Ripple Price News: XRP Bulls Target  in Long-Term Rally Backed by Rare Candle Formation

XRP has maintained long-term targets of $10 and $50 since the $0.60 level, reflecting strong conviction among early XRP supporters. Source: EGRAG CRYPTO via X

This formation consists of three consecutive bullish monthly candles, which historically have been followed by consolidation phases and then explosive gains. The first such instance in XRP’s history led to an 8,000% rally in 2017. The second instance resulted in a 1,506% surge by January 2018.

According to EGRAG, the latest pattern—confirmed in late 2023—suggested a period of 12-month consolidation, which has now concluded. He projects that this could lead to a breakout that potentially pushes XRP to $50, with more moderate targets around $10 and $27 also in play.

“XRP OGs have stayed consistent with their targets, even when the market was against them,” EGRAG noted, reaffirming his belief in the long-term bullish structure.

Analysts Eye $4 in the Short Term

While long-term projections remain ambitious, near-term traders are watching $4 as the next key resistance level. Crypto educator Edoardo Farina stated that seeing XRP above $4 “as early as this week” wouldn’t be surprising. That would mark a 50% increase from current levels and surpass XRP’s all-time high of $3.85 from January 2018.

Analysts Eye $4 in the Short Term

XRP could surge past $4 unexpectedly this week, catching many off guard. Source: Edo Farina via X

The move could be fueled by a rapid influx of buying pressure, particularly if investor sentiment shifts from cautious optimism to full-blown FOMO.

Institutional Developments Support the Bull Case

Recent developments on the institutional front further support the bullish ripple price prediction. Ripple Labs has expanded its partnerships, notably teaming up with BNY Mellon to provide custody services for its RLUSD stablecoin, which now ranks among the top 10 by market cap. This partnership aims to attract institutional players seeking exposure to the XRP Ledger and its ecosystem.

Moreover, XRP-based ETFs are beginning to take shape. Futures products from ProShares and others launched in July, and the SEC is currently reviewing over 10 spot-XRP ETF applications. If even one of these gets approved, analysts believe it could significantly boost both demand and price.

Market Outlook: Bullish But Cautious

Despite growing momentum, XRP is not without risks. The ongoing Ripple vs. SEC lawsuit continues to cast uncertainty over the token’s regulatory future. Although several rulings have favored Ripple, any unexpected legal twist could introduce volatility.

Market Outlook: Bullish But Cautious

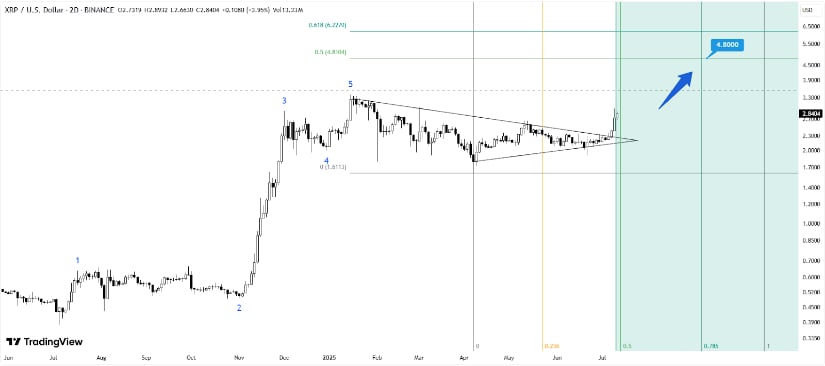
XRP has completed a Wave 4 Elliott formation and entered Wave 5, with a potential target of $5–$6, though caution is advised due to possible short-lived momentum. Source: mptrading74675 on TradingView

Still, technical indicators remain bullish. The Fear & Greed Index is firmly in “Greed” territory at 74, and XRP has posted 18 green days in the last 30, with average swings of nearly 7%.

Short-term XRP predictions suggest a modest dip to around $2.75 by August 12, though this may be part of a healthy correction within a larger upward trend.

Final Thoughts: Will XRP Go Up to $50?

With bullish technical patterns, strong weekly performance, and increasing institutional interest, XRP coin price is gaining momentum both in the short and long term. The combination of historical candle formations, ETF developments, and Ripple’s expanding ecosystem are aligning in a way that has many traders optimistic.

While a 1,966% rally to $50 may sound ambitious, past XRP cycles have delivered similar returns under the right conditions. Whether XRP hits $4 this week or $50 down the line, the XRP crypto market appears to be entering a pivotal phase.

For now, investors are watching closely, as XRP news today continues to dominate headlines across both retail and institutional circles.

Source link

14 07, 2025

Dogecoin’s Bull Run Begins?

By |2025-07-14T03:01:34+03:00July 14, 2025|Crypto News, News|0 Comments

Dogecoin price has reignited bullish momentum, pushing past key resistances and sparking renewed interest among traders and investors. The latest daily chart reveals a classic setup that could lead to a breakout rally if the momentum sustains. Let’s break down the technicals and what they mean for DOGE price in the short term.

Dogecoin Price Prediction: Is DOGE Price Breaking Out of Its Accumulation Zone?

DOGE/USD Daily Chart- TradingView

Dogecoin price recent rally to $0.2018 marks a significant shift from the long consolidation phase it hovered in throughout June. After weeks of flat price action near the $0.15–$0.17 range, DOGE has now surged above its psychological resistance at $0.20, a level not seen since early May. The breakout from this horizontal resistance indicates a possible end to the accumulation zone and the beginning of a markup phase.

This DOGE price action is supported by a Heikin Ashi candle pattern showing strong green candles with little to no lower wicks — a sign of sustained buying pressure.

What Does the RSI Say About Overbought Conditions?

The Relative Strength Index (RSI 14) is currently hovering at 70.01, placing Dogecoin right on the edge of the overbought threshold. Historically, DOGE price has shown impulsive movements once it crosses the 70 mark, often pushing further before cooling off. However, traders should be cautious here — while overbought RSI isn’t an immediate reversal signal, it often precedes short-term corrections or sideways consolidations.

That said, the RSI curve is steep and rising, which means momentum is still building. When RSI trends upward above 50 with price following higher highs, it often signifies a healthy bullish phase.

Can Fibonacci Levels Predict DOGE Price Next Target?

The chart also shows Fibonacci extension levels calculated from the recent swing low ($0.147) to swing high ($0.208). Based on this:

  • 0.236 level (~$0.20) has just been tested and lightly breached.
  • 0.382 level (~$0.22) will act as the next minor resistance.
  • 0.618 level (~$0.25) stands as a more significant target if bullish momentum sustains.

Dogecoin Price target projection using Fibonacci Extension:

Let’s apply the Fibonacci 1.618 extension method from the swing low to swing high:

  • Extension target = Low + (1.618 × (High − Low))
  • = $0.147 + (1.618 × ($0.208 − $0.147))
  • = $0.147 + (1.618 × 0.061) ≈ $0.147 + 0.0986 ≈ $0.245

This calculation aligns with the 0.618 retracement zone on the chart — giving $0.245–$0.25 as a realistic upside target in the near term.

Will DOGE Price Hold Above $0.20 or Fakeout?

The $0.20 level has been a major psychological barrier. Now that Dogecoin price is trading above it, the next 1–2 daily closes will be crucial. If DOGE price holds above $0.20, this will confirm the breakout. However, if it falls back below with high volume, it may trigger a bull trap and short-term correction back to $0.18–$0.185.

Key support zones to watch:

  • Immediate support: $0.192
  • Stronger support: $0.185
  • Psychological and swing low support: $0.17

Failure to hold $0.192 may force DOGE to retest its prior consolidation range.

Dogecoin Price Prediction: What’s Next for Dogecoin in July?

If the RSI sustains over 70 for a few sessions and price action holds above $0.20, DOGE price could make a run toward the $0.22–$0.25 range. The bullish volume, candle structure, and trend strength currently support that view.

However, traders should watch for the following confirmation before entering or doubling down:

  • At least two daily closes above $0.202
  • RSI maintaining 65–75 range with MACD crossover (not shown here but relevant)

Assuming the current trend continues and Bitcoin doesn’t reverse sharply, Dogecoin price could test $0.22 in the next 5–7 days and $0.25 before the end of July.

Dogecoin price is showing strong breakout characteristics after weeks of accumulation. With technical indicators like RSI and Fibonacci extensions aligning, the probability of DOGE price reaching $0.22–$0.25 is increasing. However, a failure to hold above $0.20 could lead to a retest of $0.185. The coming days will be pivotal in deciding if this breakout sustains or fades.

Looking to Buy DOGE? Try OKX

OKX is a top choice to buy DOGE. With low trading fees, extensive token listings, and an intuitive interface, it’s a preferred platform for many crypto traders across Europe.

Special Promotion – Limited Time

Until September 14, 2025, OKX is hosting an exclusive McLaren F1 Team giveaway:

–> Receive a complimentary McLaren F1 Team cap<–

Enter to win a VIP trackside experience in Zandvoort (Aug 29–31)

This offer is open to all new European users who haven’t yet traded on OKX. Don’t wait – claim your reward today!

$DOGE, $Dogecoin, $DOGEPrice, $DogecoinPrice

Source link

Go to Top