Bitcoin (BTC) price surged
past $93,000 on Monday, January 5, 2026, marking the fifth consecutive session
of gains across major cryptocurrencies. Ethereum climbed to $3,162, XRP tested
$2.14, and Dogecoin rallied following a breakout from its bearish channel.
The total
crypto market capitalization climbed above $3.01 trillion, driven by stronger
investor sentiment, slowing ETF outflows, and renewed interest from
institutional players. This early-2026 momentum shows a stark reversal from the
disappointing fourth-quarter performance that saw excessive leverage unwound
and sentiment reset.
Why are cryptocurrencies rising today? What are the
latest price forecasts, and what does technical analysis show for the BTC/USDT,
XRP/USDT, ETH/USDT, and DOGE/USDT charts? This article takes a closer look.
Year-Ahead Positioning
Drives Rally
“Cryptocurrency
markets are in the green as investors add digital gold to their portfolios amid
positioning for the year ahead,” explains Petr Kozyakov, Co-Founder and
CEO at Mercuryo. The payment infrastructure leader notes that Bitcoin’s push
past $92,000 has led the market higher alongside gains in Ethereum and Solana.
Kozyakov
highlights a notable shift in market dynamics: “A shift in mood across the
digital token space has been underlined by a resurgence in interest in the meme
coin sector, with Shiba Inu and Pepe making a loud entry to 2026.” Beyond meme coin speculation, the cryptocurrency industry is experiencing a broader transformation as market structure reform and legislative architecture take precedence over pure price action, with stablecoin capitalization hitting $312.63 billion in December 2025.
Despite the
severe drop in sentiment during the final months of 2025, he emphasizes that
“fundamentals in the sector remain strong as the underlying infrastructure
evolves with assets such as stablecoins continuing to attract increasing levels
of liquidity.”
Joel
Kruger, crypto strategist at LMAX, provides important context for the recovery.
“The crypto market delivered an undeniably disappointing fourth-quarter
performance,” he acknowledges, noting frustration given that Bitcoin and
ETH had already reached fresh record highs earlier in 2025 alongside
significant regulatory and adoption progress.
However,
Kruger views the pullback constructively: “The weaker headline performance
can also be viewed as a healthy reset. The pullback helped unwind overleveraged
positions and clear excess froth, a necessary process that often improves
market structure and supports more sustainable upside over time.”
It’s also certainly relevant what’s happening in Venezuela and Donald Trump’s “war on oil.” But what do the charts say?
Bitcoin Price Tests
Critical $93,000 Resistance
Bitcoin
briefly touched $93,000 on Monday, with Yahoo Finance data showing an intraday
high of $93,155 and closing at $92,798. The world’s largest cryptocurrency is
trading at its highest level in nearly one month, up over 2% in the last 24
hours. However, my technical analysis reveals Bitcoin remains trapped in a
nearly two-month consolidation between $84,000 and $94,000.
Why Bitcoin
price is going up today? Source: Tradingview.com
Key Bitcoin Technical
Levels
|
Support Zones
|
Resistance Zones
|
|
$88,000 (major downside invalidation)
|
$94,800-$95,500 (descending trendline)
|
|
$90,000-$92,000
|
$100,000 (200 EMA, bull confirmation)
|
|
$84,000-$87,000 (consolidation floor)
|
$103,000 (trend separator)
|
|
$74,000 (bear target, 161.8% Fibo)
|
$126,000 (October ATH)
|
The price
action shows Bitcoin testing the upper boundary of its range, defined by the
50-day moving average and 100% Fibonacci extension near $92,000-$94,000. On the
daily chart, Bitcoin continues moving in an increasingly narrowing wedge
pattern, with the lower boundary rising since mid-December from around $80,500.
“BTC
has been respecting a descending trendline for weeks. Price recently tested
this trendline near 94,800 and showed a reaction,” observes Areeb Khan
from Traders’ Hub. He identifies several key technical observations:
Khan’s Technical Breakdown:
- Long-term downtrend resistance
still active
- Price holding above recent
higher lows
- RSI near mid-zone (50) with
room for expansion, no extreme yet
Khan
provides specific levels to monitor: “Resistance: 94,800-95,500. Support:
92,000 going down to 90,000. Major downside invalidation below 88,000.” He
warns that “a clean breakout and hold above the trendline could shift
short-term structure bullish. Rejection here keeps BTC in a range-to-bearish
continuation setup.”
Despite the
bullish momentum, Bitcoin remains below its 200-day exponential moving average,
which resides above $103,000 and represents the separator between uptrend and
downtrend. My
bearish scenario targets $74,000, representing 2025 yearly lows last tested
in April and confirmed by the 161.8% Fibonacci extension.
If you like my work, please also check previous crypto analyses and follow me on X:
Ethereum Tests Key $3,200
Fibonacci Level
Ethereum (ETH) gained 0.7% on
Monday to reach $3,168, with CoinGecko data showing current trading at $3,162.
The second-largest cryptocurrency is testing its fifth consecutive rising
session and three-week highs, breaking above its 50-day exponential moving
average for the first time in nearly a month. Below is how I see it.
Why Ethereum
price is going up today? Source: Tradingview.com
Ethereum’s Technical Position:
- Current
price: $3,168 (+0.7% Monday)
- Immediate resistance: $3,200 (50% Fibonacci
retracement, early November lows)
- Major resistance zone: $3,350-$3,400 (untouched
since correction began)
- Support range: $2,650-$2,800
(November-December lows, 61.8% Fibonacci)
- Death cross status: Active since late
November (50 MA below 200 MA)
The price
has stopped at local resistance around the 50% Fibonacci retracement level near
$3,200, which coincides with resistance formed by local lows from early
November. This represents a critical juncture, as Ethereum briefly traded close
to $3,010 at the start of 2026 before accelerating higher.
However,
medium-term technical factors remain bearish. Both
moving averages formed a death cross pattern in late November, and the
price continues moving below the 200-day EMA. The main resistance zone between
$3,350 and $3,400 remains untouched, representing a formidable barrier for
bulls.
Ethereum is
consolidating between this upper resistance zone and support defined by
November-December lows in the $2,650-$2,800 range, reinforced by the 61.8%
Fibonacci retracement.
In a
sideways movement, price can move both up and down, but the overall my chart
structure suggesting continuation of declines targets June lows at $2,200 and
ultimately 2025 yearly minimums around $1,400 last tested in April.
XRP Breaks Bearish
Channel, Tests $2.14
XRP is trading at $2.14,
marking its fifth consecutive rising session and the highest value since early
December. The cryptocurrency gained over 2% during Monday’s session, with
intraday highs testing $2.16 before pulling back slightly.
Why XRP
price is going up today? Source: Tradingview.com
The
positive development for XRP is its breakout from the bearish regression
channel drawn from July highs, which had been tested multiple times from both
below and above. This dynamic breakout saw the price distance itself
significantly from the channel, providing technical confirmation that selling
pressure may be exhausting.
XRP Critical Levels for
Breakout Confirmation
|
Level
|
Significance
|
Status
|
|
$2.35
|
200 EMA (ultimate confirmation)
|
Not reached
|
|
$2.20-$2.30
|
Resistance zone (breakout confirmation)
|
Testing
|
|
$2.14
|
Current price
|
Fifth rising session
|
|
$1.80-$1.83
|
Consolidation support
|
Holding
|
|
$1.61
|
April minimums (bear target)
|
Risk level
|
|
$1.25
|
November
2024 lows (deep bear target)
|
Extreme scenario
|
However,
caution is warranted. A similar breakout was observed in early October, but the
price subsequently returned to the channel range. The ultimate confirmation of
the breakout requires XRP to return above the resistance zone between $2.20 and
$2.30, and most importantly above the 200 EMA at $2.35.
XRP remains
in a trend structure similar to Bitcoin and Ethereum, moving below the 200 EMA
(downtrend) and in a consolidation drawn since late November at medium-term
lows.
Until the
breakout is confirmed, the possibility remains of a return to the lower
consolidation boundary with support at $1.80-$1.83.
If you want to trade Bitcoin, XRP and others, check out the 5 best CFD crypto brokers in 2026.
Dogecoin Rallies But Faces
Resistance at $0.15
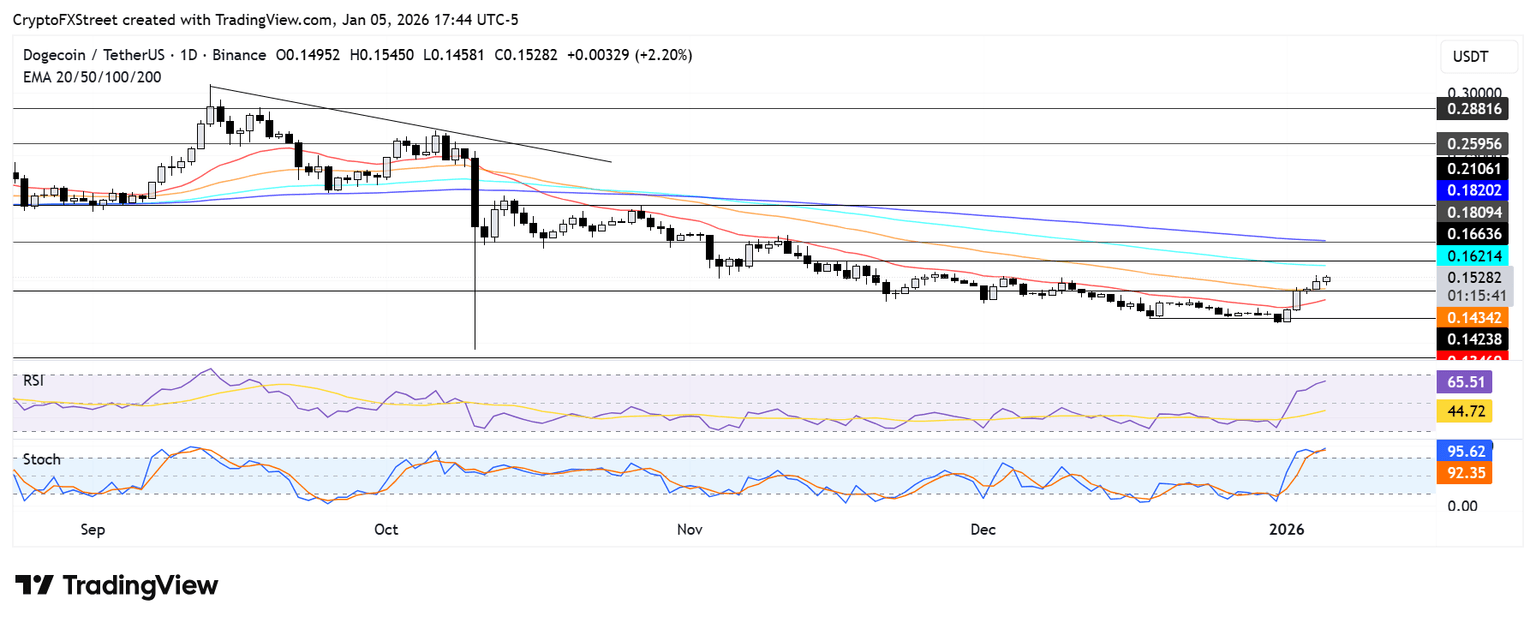
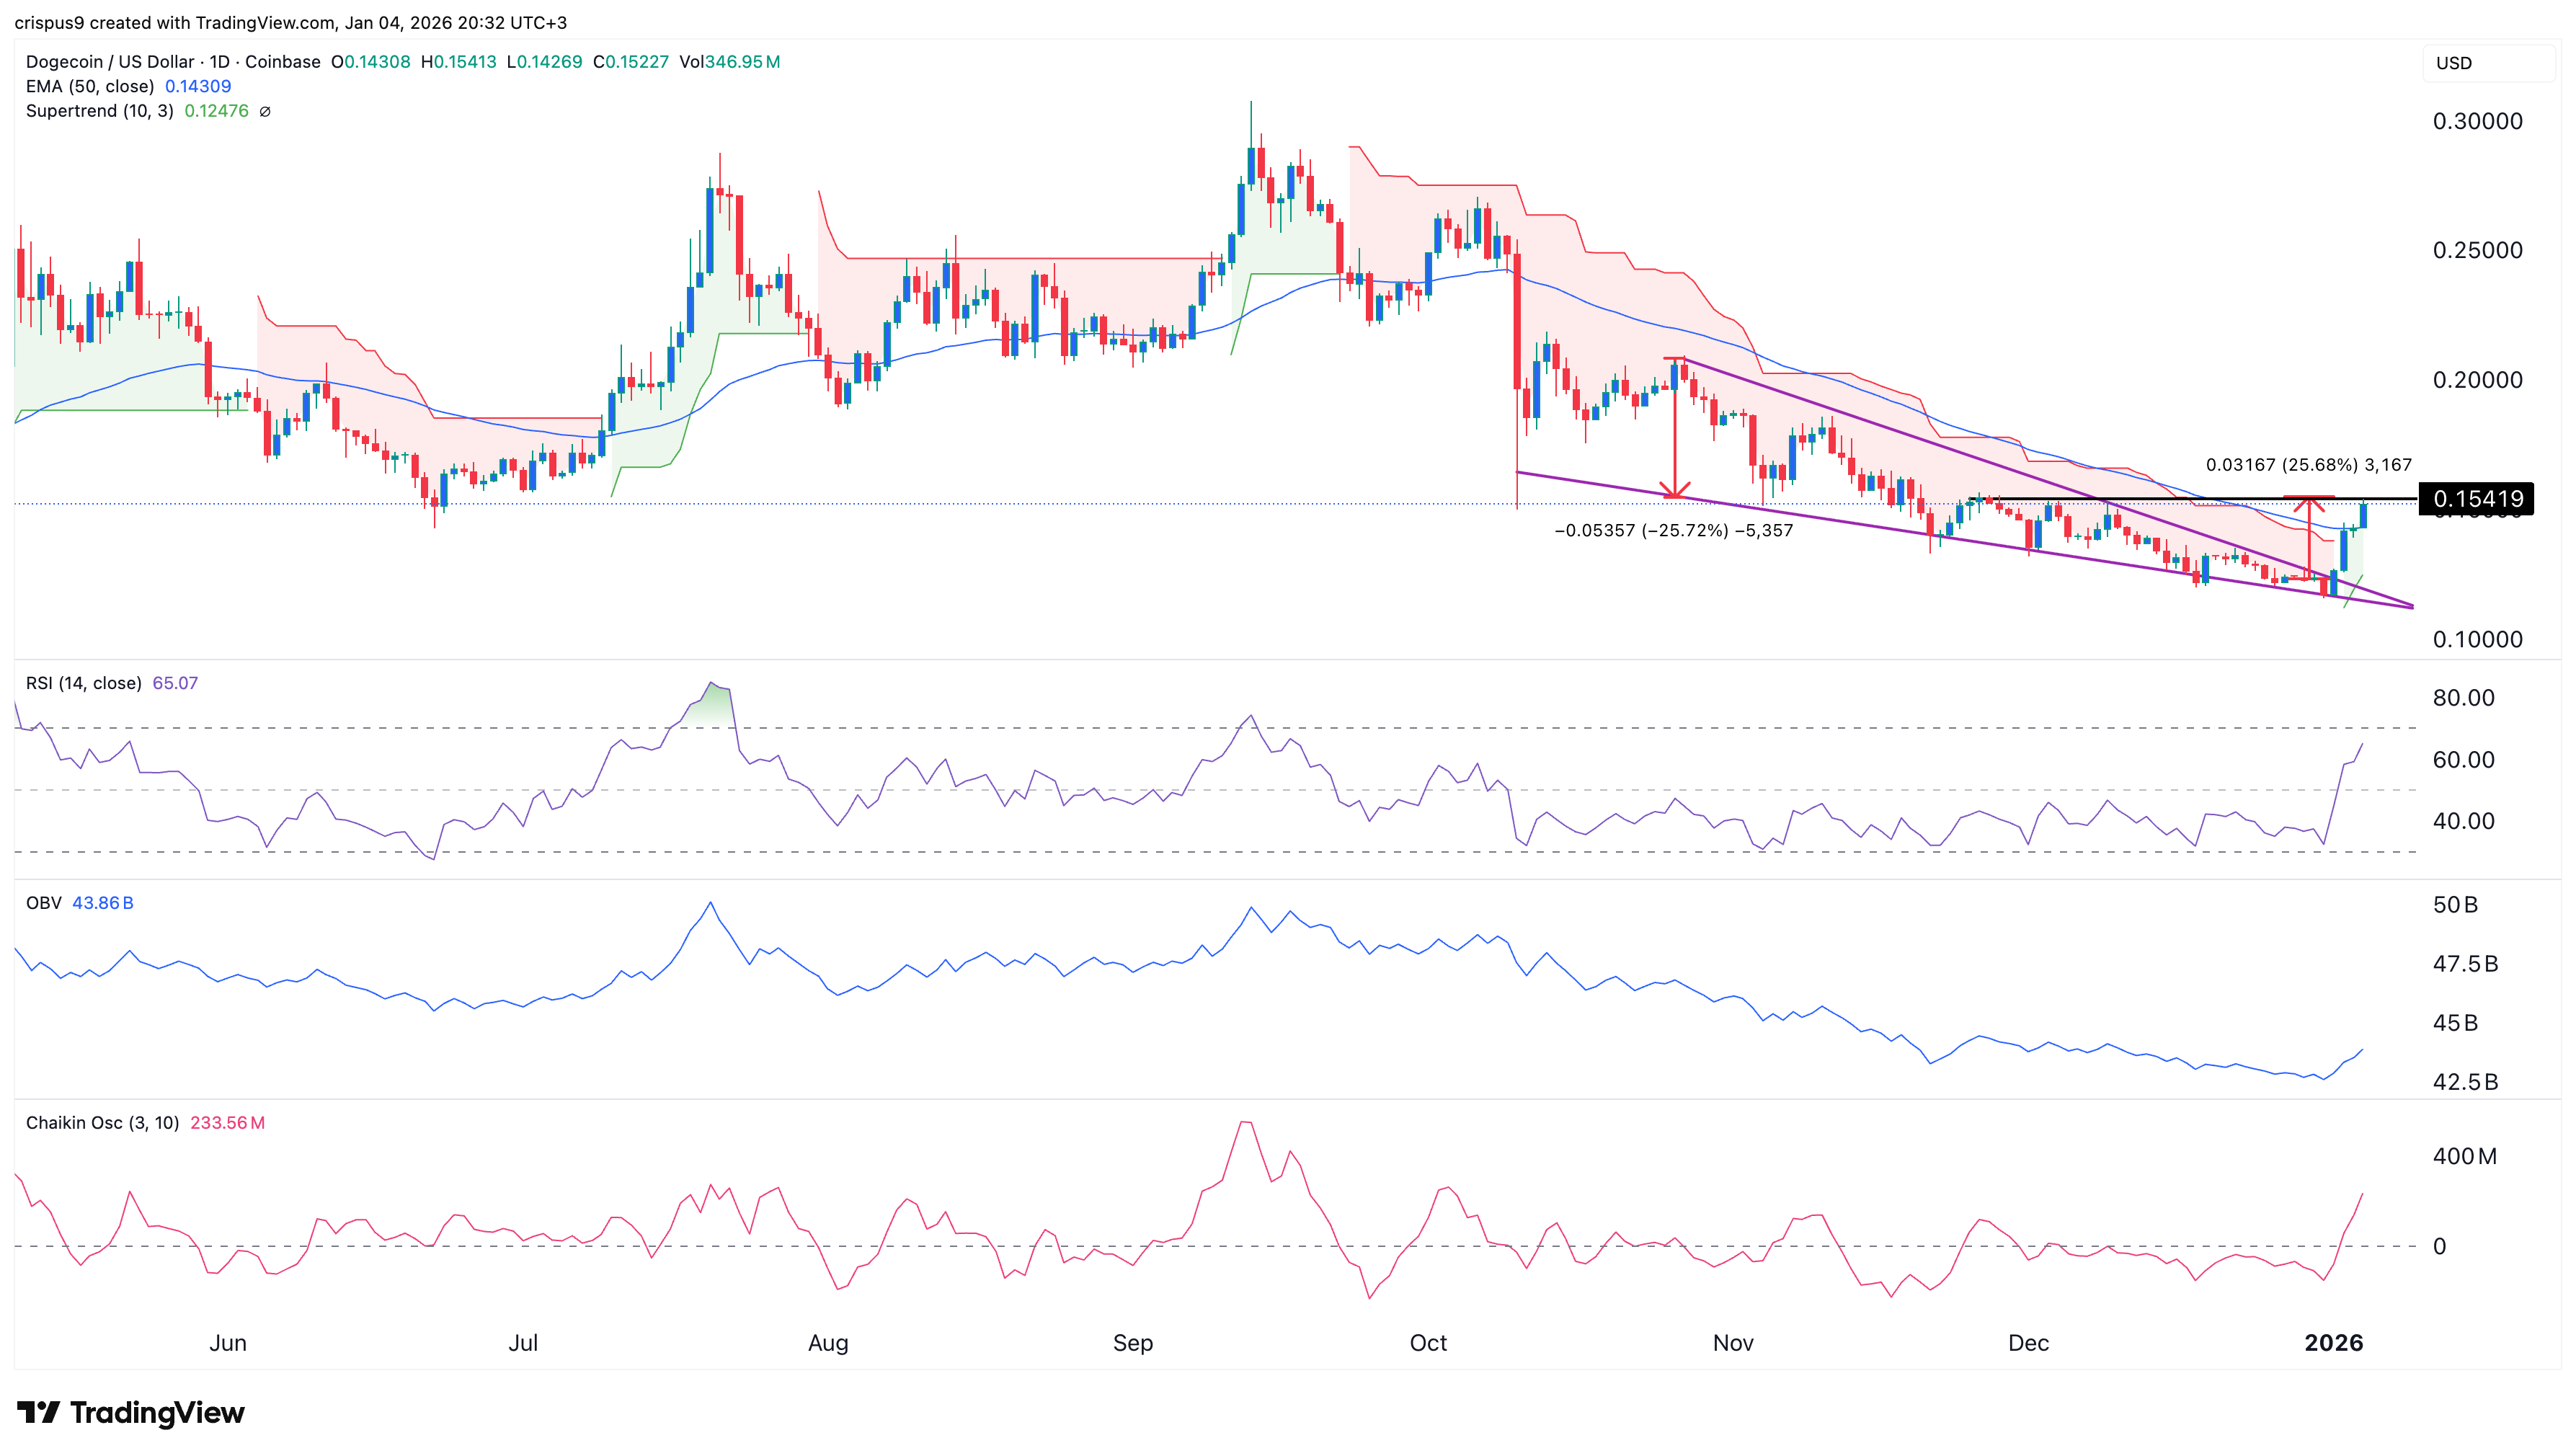
Dogecoin (DOGE) experienced
four consecutive days of gains, testing the highest level since late November
before pulling back 1.2% to $0.1477 at the time of writing.
The meme
coin has stopped at the upper boundary of its current consolidation at the
lowest levels since October 2024.
Why Dogecoin
price is going up today? Source: Tradingview.com
Dogecoin Technical Structure:
- ✓ Broke bearish regression
channel from October (positive development)
- ✓ Four consecutive rising
sessions (momentum building)
- ✗ Death cross pattern intact (bearish
structure)
- ✗ Large distance to 200 EMA (downtrend
confirmed)
- ? Testing consolidation ceiling
at $0.15 (decision point)
This
resistance level coincides with the 50 EMA and minimums from June, April, and
March 2025. The lower consolidation boundary is defined by lows from the turn
of 2025/2026 around $0.11-$0.12.
The meme
coin resurgence extends beyond Dogecoin. Market data shows renewed interest in
Shiba Inu and Pepe, with the broader meme coin sector experiencing a
retail-driven rally in early 2026 after languishing through much of 2025.
If current
resistance at $0.15 holds, my favored scenario is a downward movement and
retest of the $0.11 area, or
even $0.10 representing 2025 yearly minimums from the October flash crash.
FAQ: Crypto Price
Questions
Why is crypto going up
today?
Crypto is
surging due to year-ahead portfolio positioning, Q4 2025 sentiment reset
completion (deleveraging and excess froth clearing), meme coin sector
resurgence, strong fundamentals in infrastructure evolution, and stablecoin
liquidity growth. Kozyakov from Mercuryo notes investors are adding
“digital gold” to portfolios amid 2026 positioning. Bitcoin,
Ethereum, XRP and Dogecoin all posted fifth consecutive rising sessions on
January 5, 2026.
Why is Bitcoin surging for
the fifth straight session?
Bitcoin
tested $93,155 intraday, representing one-month highs, as traders positioned
for 2026 amid improved sentiment. The rally tests critical resistance at
$94,800-$95,000 where descending trendline and 50 MA converge, according to
Areeb Khan from Traders’ Hub. Joel Kruger identifies sustained hold above
$95,000 as key technical signal for broader uptrend resumption toward record
highs.
Why is Ethereum testing
resistance at $3,200?
Ethereum’s
fifth rising session brought price to $3,168, testing 50% Fibonacci retracement
at $3,200 after breaking above 50 EMA for first time in nearly a month.
However, death cross remains active since late November, and major resistance
zone at $3,350-$3,400 stays untouched.
Why is XRP price surging
above $2?
XRP gained
over 2% to test $2.16 intraday (fifth consecutive rising session), reaching
highest levels since early December after breaking bearish regression channel
from July highs. However, confirmation requires sustained move above
$2.20-$2.30 resistance and 200 EMA at $2.35, as similar October breakout proved
false.
Why is Dogecoin rallying
after breakout?
Dogecoin
broke bearish regression channel dynamically, testing $0.1477 at upper
consolidation boundary representing late November highs. Mercuryo’s Kozyakov
notes meme coin sector experiencing resurgence with Shiba Inu and Pepe leading
2026 entry. However, resistance at $0.15 (50 EMA) remains untested with risk of
return to $0.11-$0.12 support zone.
Is the crypto bear market
over?
Technical
analysis shows Bitcoin, Ethereum and XRP still in consolidation below 200 EMAs
with death crosses active for Bitcoin and Ethereum since late November. Kruger
from LMAX characterizes the Q4 pullback as a “healthy reset” that
unwound overleveraged positions and improved market structure, but sustained
breakouts above key resistance levels are needed for trend reversal
confirmation.
Source link


 SOURCE: X


