Solana (SOL) is known as one of the fastest and most efficient blockchains, powering DeFi, NFTs, gaming, and other Web3 apps since its 2020 launch. In this post, we’ll explore Solana (SOL) price prediction for 2025–2030 and the key factors — from network upgrades to market trends — that could shape its future growth.
What Is SOL?
Solana is a high-performance blockchain platform designed for lightning-fast transactions, scalability, and low fees.
Launched in 2020, Solana Solana utilizes PoH (Proof of History) to support PoS (Proof of Stake) to achieve high transaction speeds and efficiency that allows the network to process thousands of transactions per second, making it one of the fastest blockchains in the industry.
The blockchain has become a popular choice for decentralized applications (dApps), NFTs, DeFi, and Web3 projects, attracting a growing community of developers and investors thanks to its speed, efficiency, and active ecosystem.
SOL Price Prediction: How Do VentureBurn Experts Analyze It?
VentureBurn analysts combine fundamental and technical factors when forecasting SOL’s price. The forecasts are based on statistics, historical price patterns, and a variety of technical indicators, including RSI, MACD, support and resistance, trendlines, Fibonacci levels, and momentum.
Trained AI models and manual reviews are also used to enhance prediction accuracy. This information is provided for informational purposes only and does not constitute financial advice — always do your own research (DYOR).
The research notes that expectations of a Fed rate cut and a stronger risk-on sentiment are channeling more capital into the crypto market.
>>> Read more: Aster (Aster) Price Prediction 2025, 2026 to 2030
Current Market Background

The Federal Reserve cut its key interest rate by 0.25% on September 17 and is expected to make two more cuts by year-end. The move has lifted market sentiment, as lower rates tend to boost liquidity and risk appetite — a positive signal for assets like SOL and the broader crypto market.
With around $7.6 trillion sitting in money market funds, investors are watching closely. As yields on cash fall, some of this capital could flow into digital assets, fueling rallies and higher volatility across Bitcoin and altcoins.
However, risks remain. President Trump’s decision to impose a 100% tariff on Chinese imports starting November 1 threatens to disrupt global trade and push up inflation.
Markets have already shown signs of stress, with sharp equity declines and rising crypto volatility. As geopolitical tensions escalate, traders should brace for a bumpy ride — balancing optimism from rate cuts with caution over trade uncertainty.
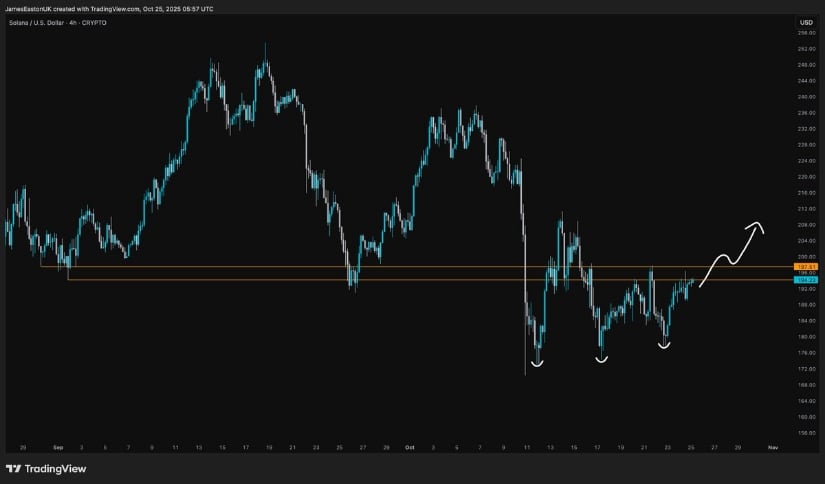
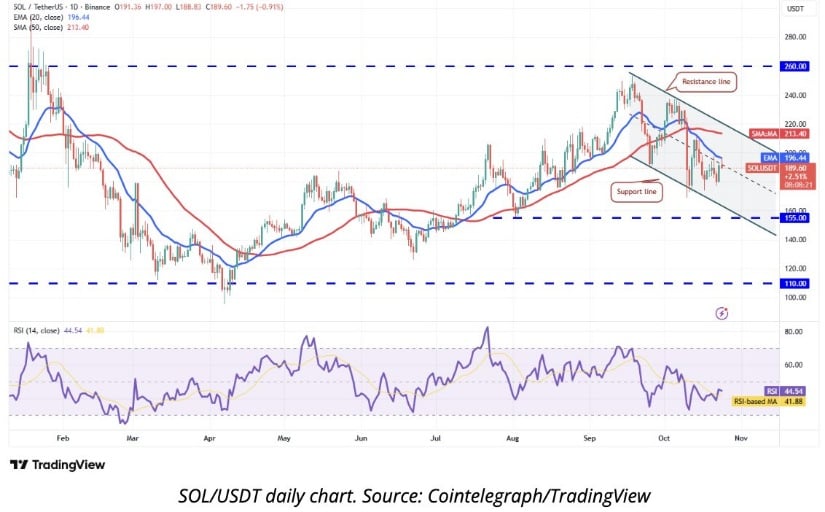
SOL Technical Analysis

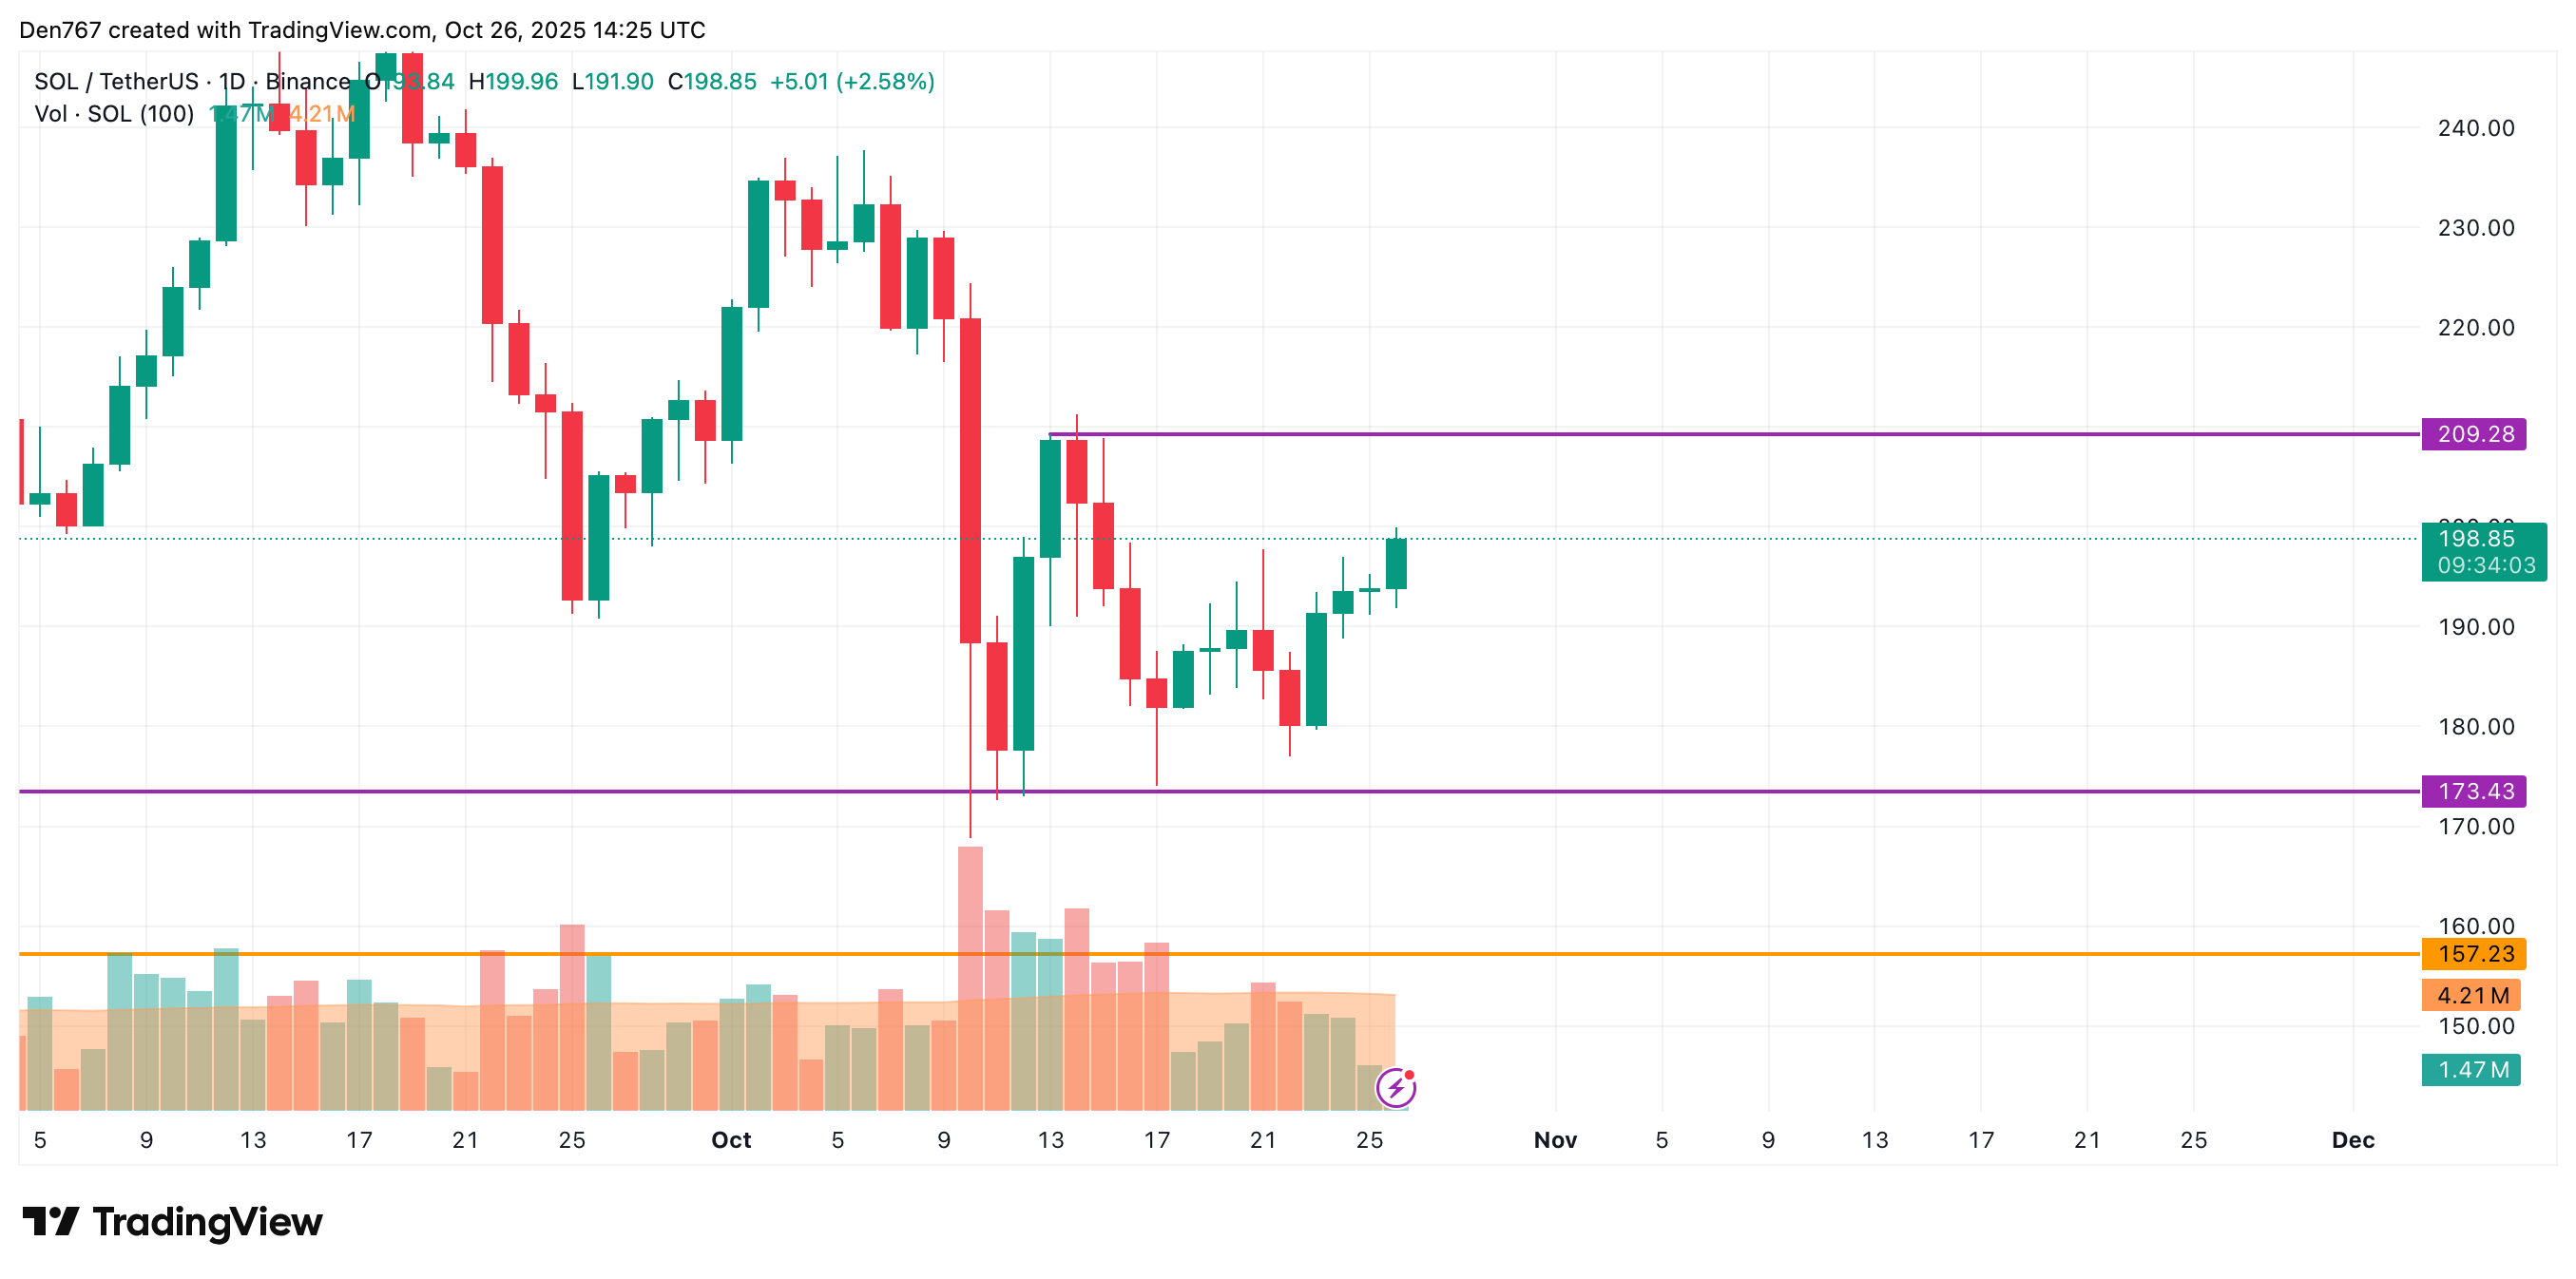
Solana has been falling for a while, but recently it found strong support around $170–$180. The price bounced up from this area and is now moving sideways near $190. If Solana can move above the downward trendline (the white line), it may start going higher, possibly towards $220 and $260.
The chart suggests that buyers are starting to get stronger, but if the price drops below the support zone, the trend could turn negative again. This setup shows a possible change from a falling market to a rising one, as long as support holds.
Key Price Levels
Support Levels
- 170–$175: This is the first strong support zone. Price has bounced here several times recently, showing there are many buyers willing to step in if SOL drops to this area. If price holds above this zone, it creates a solid base for future upward moves.
- $157–$160: If price breaks below the first support, this lower range could act as the next “floor.” It marks the last area where buyers previously stopped the price from falling further. Losing this level could lead to more downside pressure.
Resistance Levels
- $205–$210: This is the nearest resistance above current price. It’s a zone where sellers have appeared before, causing price to pull back. SOL will need to break and hold above this area to confirm a new bullish trend and attract more buyers.
- $250: If SOL rallies past the first resistance, $250 will likely be the next big challenge. This level has acted as a major top in the past, and many traders may take profits here, causing some selling pressure.
What to watch closely
When investing in SOL, there are a few key factors to keep an eye on. The Federal Reserve’s rate cuts usually boost liquidity and push investors toward higher-risk assets like cryptocurrencies.
Geopolitical factors such as trade tensions or tariff policies can also affect market sentiment and cause short-term volatility.
From a technical view, pay attention to the key support zones at $170–$175 and $157–$160, as these areas could stop price drops and trigger buying interest. It’s also worth tracking the overall trend and trading volume to gauge market strength.
Lastly, fundamentals matter — network upgrades, community engagement, ecosystem growth, and new partnerships all play a big role in SOL’s long-term potential.
>>> Read more: XRP (XRP) Price Prediction 2025, 2026 to 2030
SOL Price Prediction 2025
| Time |
Expected Price |
Potential ROI |
| November 2025 |
$218.0000000 |
12.99% |
| December 2025 |
$248.0000000 |
28.54% |
SOL Price Prediction 2026
| Time |
Expected Price |
Potential ROI |
| Q1 2026 |
$279.0000000 |
44.61% |
| Q2 2026 |
$292.0000000 |
51.35% |
| Q3 2026 |
$331.0000000 |
71.56% |
| Q4 2026 |
$350.0000000 |
81.41% |
SOL Price Prediction 2027
| Time |
Expected Price |
Potential ROI |
| Q1 2027 |
$336.0000000 |
74.16% |
| Q2 2027 |
$370.0000000 |
91.78% |
| Q3 2027 |
$401.0000000 |
107.85% |
| Q4 2027 |
$398.0000000 |
106.29% |
SOL Price Prediction 2028
| Time |
Expected Price |
Potential ROI |
| Q1 2028 |
$420.0000000 |
117.70% |
| Q2 2028 |
$451.0000000 |
133.76% |
| Q3 2028 |
$464.0000000 |
140.50% |
| Q4 2028 |
$460.0000000 |
138.43% |
SOL Price Prediction For Years 2025, 2026, 2027, 2028, 2029, and 2030
| Year |
Expected Price |
Potential ROI |
| 2025 |
$248.0000000 |
28.54% |
| 2026 |
$350.0000000 |
81.41% |
| 2027 |
$398.0000000 |
106.29% |
| 2028 |
$460.0000000 |
138.43% |
| 2029 |
$501.0000000 |
159.68% |
| 2030 |
$555.0000000 |
187.67% |
The forecasts are based on statistics, historical price patterns, and a variety of technical indicators, including RSI, MACD, support and resistance, trendlines, Fibonacci levels, and momentum. Trained AI models and manual reviews are also utilized to improve prediction accuracy. This information is provided for informational purposes only and does not constitute financial advice—always do your own research (DYOR)
Final Thoughts

In our base case, with geopolitical risks still weighing on sentiment, Solana’s price may consolidate near current levels for a few weeks before a potential breakout. This phase could allow steady accumulation backed by both technical and fundamental strength.
As confidence and liquidity improve — driven by Fed rate cuts and wider crypto adoption — Solana could enter its next bullish leg. Strong network growth, rising developer activity, and expanding DeFi and gaming ecosystems all support a long-term uptrend once global uncertainty eases.
SOL Price Prediction FAQs
Q: What will SOL be worth in 2025?
Analysts expect SOL to trade around $248 by the end of 2025, with potential highs near $268 if market conditions stay positive.
Q: Can SOL reach $500?
Reaching $500 by 2030 is challenging but possible. Solana’s fast Layer-1 design and strong Web3 ecosystem give it solid growth potential.
If the project keeps expanding in DeFi, NFTs, and gaming, attracts more developers, and benefits from a crypto market recovery, $500 by 2029 is achievable.
Q: Does SOL have long-term potential?
Yes. Solana’s high speed, low fees, and active developer base make it one of the leading blockchains.
Long-term success depends on network stability, competition, and regulation. If Solana keeps innovating and growing adoption, its outlook remains strong.
Q: What affects SOL’s price?
Key drivers include network upgrades, ecosystem growth, and market sentiment.
External factors like interest rates, liquidity, and competition from other Layer-1s also matter. Network reliability strongly impacts investor confidence.
Q: Is SOL a good investment for 2025?
With the Fed’s rate cuts and higher risk appetite, SOL could benefit from better liquidity and renewed momentum.
Its solid tech and expanding ecosystem support a bullish 2025 outlook.
Q: How accurate are SOL price predictions?
Forecasts rely on historical data, technical indicators, and AI models, but real prices can vary.
Use predictions as reference only — always do your own research (DYOR).


 Price Prediction 2025, 2026 to 2030")


