The token currently trades near $0.53 after touching a low of $0.48, while the broader crypto market has also crashed.
Trading volume, on the other hand, surged by 13% to $1.8 billion, a sign that volatility is drawing traders back into the market.
With total market capitalization falling to $3.39 trillion and $1.73 billion in liquidations over the past day, according to CoinGlass, the start of this November has been hard on crypto enthusiasts.
However, even as the bloodbath unfolded, the Cardano Foundation marked founder Charles Hoskinson’s birthday, a reminder of how far the project has come since its inception.
Wishing @IOHK_Charles a very happy birthday. Your pioneering work and vision laid the foundation for Cardano’s global reach today. I hope the year ahead brings new opportunities to reconnect and build on the progress that started it all. pic.twitter.com/Bgdq39XX23
Historically, this signal has preceded strong upward reversals for ADA, particularly when accompanied by oversold RSI levels.
ADA Price Analysis: Breakdown or Breakout?
The weekly chart shows that ADA has broken below its descending triangle support, retesting the $0.50 zone.
The next critical support sits between $0.35 and $0.40. Should ADA confirm a breakout above its descending trendline (near $0.80), it could open the path toward a mid-term target of $1.20.
Source: TradingView
Beyond that, the chart suggests a potential macro move that could drive prices as high as $10, representing a staggering 1,800% gain from current levels.
Market Sentiment: Fear Before the Turn
Historically, extreme fear levels often precede local bottoms as weak hands exit and accumulation resumes.
If Cardano’s buy signal holds and volume sustains, the stage could be set for a significant rebound in the coming weeks.
ADA Eyes Return, While $BEST Unlocks the Door to Early Presale Access
As Cardano pushes toward a recovery, Best Wallet ($BEST) is quietly gaining momentum in one of crypto’s fastest-growing sectors – non-custodial wallets.
With over $16.8 million raised in its presale so far, Best Wallet is shaping up to be a serious player in the $11 billion wallet market.
Designed for freedom, security, and speed, it’s a multi-chain wallet that puts users fully in control of their assets – no intermediaries needed.
But what sets it apart is access.
$BEST token holders unlock early entry to vetted crypto presales and new projects before they go mainstream.
They also enjoy lower transaction fees across the ecosystem, plus up to 78% staking yields through Best Wallet’s built-in aggregator.
For anyone looking to get in early on the next cycle’s breakout stars, Best Wallet is quickly becoming a go-to tool.
Disclaimer: Coinspeaker is committed to providing unbiased and transparent reporting. This article aims to deliver accurate and timely information but should not be taken as financial or investment advice. Since market conditions can change rapidly, we encourage you to verify information on your own and consult with a professional before making any decisions based on this content.
A crypto journalist with over 5 years of experience in the industry, Parth has worked with major media outlets in the crypto and finance world, gathering experience and expertise in the space after surviving bear and bull markets over the years. Parth is also an author of 4 self-published books.
November is off to a rough start. It’s a sea of red in the market, with coins and tokens selling off aggressively in a classic “risk-off” move. The pressure has been so intense that Bitcoin itself even took a brief, scary dip below $100,000.
If you’ve been in crypto for long enough, you know this kind of painful correction isn’t new. Yet that doesn’t make it any less stressful. And with so much chaos, it’s difficult to separate the short-term panic from the long-term trend.
This uncertainty is precisely why so many traders are turning to AI models like ChatGPT. The goal is to obtain a non-emotional perspective – one that can sift through the data and identify a signal for what will happen next.
So, we did just that. We asked ChatGPT for a clear forecast looking out to the end of 2026. Our query included two of the market’s most-watched large-cap alts, XRP (XRP) and Cardano (ADA), plus the disruptive new Layer-2 project Bitcoin Hyper (HYPER).
This publication is sponsored. CryptoDnes does not endorse and is not responsible for the content, accuracy, quality, advertising, products or other materials on this page.
ChatGPT’s XRP Outlook – Is $6.80 Possible In 2026?
So, what did ChatGPT say about XRP? It set a clear end-of-2026 target of $6.80. Should XRP reach that level, it would represent a new all-time high and be 204% higher than today’s price.
What makes the AI so bullish? The biggest driver, by far, is the expected approval and adoption of more spot XRP ETFs in the US. The AI is projecting that new ETFs could attract $15-25 billion in assets, which would fundamentally alter XRP’s market structure.
This potential institutional demand ties into a second point: a friendlier macro environment. With interest rates widely expected to drift lower over the next 12 months, money is likely to flow back into risk-on assets. And XRP, with its newfound regulatory clarity, is a prime target.
Plus, ChatGPT isn’t just counting on ETFs. It also pointed to steady, non-hype-driven utility on the XRPL itself – things like stablecoins and real institutional liquidity. All these reasons help explain why ChatGPT predicts XRP will reach $6.80 by the end of next year.
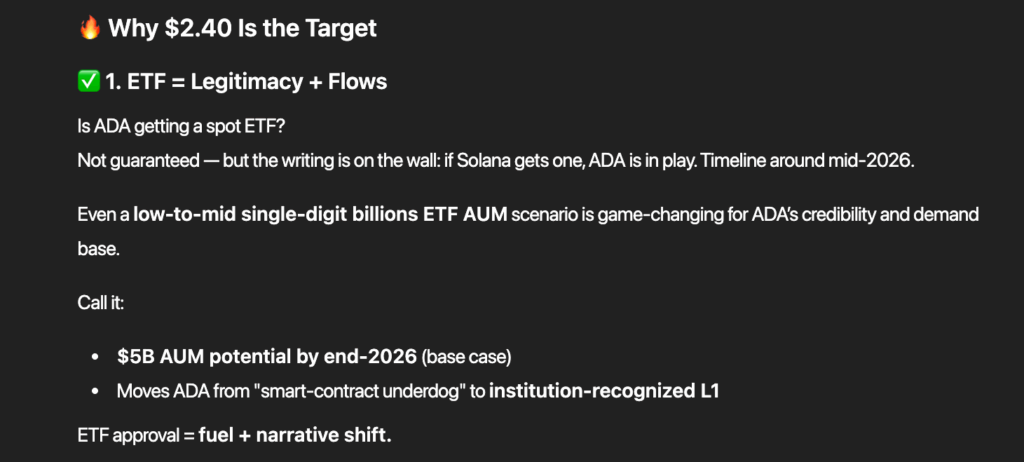
ChatGPT Believes $2.40 Is a Genuine Target for Cardano
For Cardano, ChatGPT’s call was a confident $2.40. That would be a 344% jump from ADA’s current $0.54 price, but the model framed this as a realistic, cycle-aligned target.
A lot hinges on the potential for a spot ADA ETF. While there’s no guarantee, the AI sees it as likely to go live by mid-2026. Such an approval could bring in around $5 billion in AUM and, just as importantly, shift ADA’s narrative from “underdog” to an “institutionally-recognized Layer-1.”
The other key part of ChatGPT’s forecast is Cardano’s “slow-build” model. The AI expects that by 2026, this steady, academic approach will finally show results. We’re talking about a much higher on-chain TVL, multiple functioning stablecoin systems, and real-world assets (RWAs) moving beyond the pilot stage.
All in all, ChatGPT sees 2026 as the year Cardano’s utility and its deliberate governance model finally bear fruit. That should be music to the ears of long-term ADA holders.
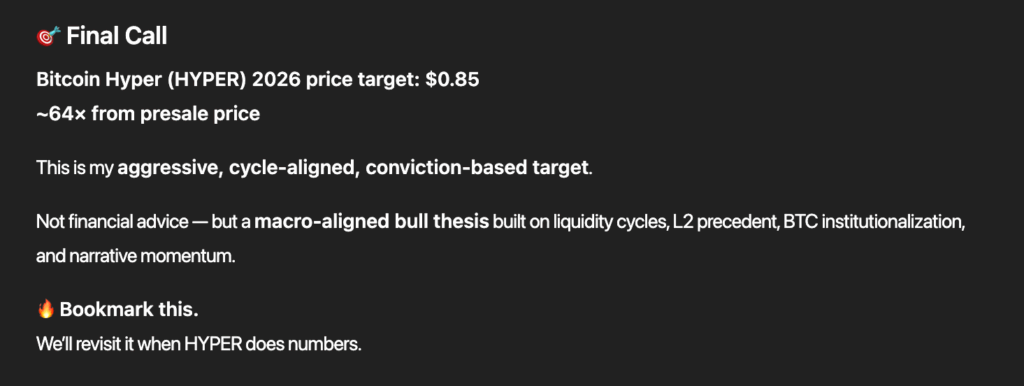
ChatGPT Predicts 64x Post-Presale Returns for Bitcoin Hyper Investors
ChatGPT’s most aggressive forecast, by a long shot, was saved for Bitcoin Hyper. The model set an eye-catching end-of-2026 target of $0.85. Compared to its current presale price of $0.013225, that’s a potential 64x gain. It’s the AI’s standout call.
So, what’s the reasoning? ChatGPT’s entire thesis is built on one idea: Bitcoin is about to enter its “Smart Contract Era” and Bitcoin Hyper could be the key catalyst for it.
The project’s core promise is bringing the high-speed execution of the Solana Virtual Machine (SVM) to the Bitcoin blockchain. This setup creates what the AI model calls the “Bitcoin Solana” narrative.
And the logic behind it is pretty simple. Bitcoin has already won the store-of-value, regulatory, and ETF battles. The one thing it’s missing is a high-performance layer for DeFi, meme coin trading, and NFTs. Bitcoin Hyper aims to be that layer.
With the ongoing HYPER presale already raising nearly $26 million, ChatGPT sees this as a project where a powerful narrative, clever tech, and strong investor demand are all coming together. That’s why the AI believes 64x returns are on the table for those who invest in HYPER during the presale.
This publication is sponsored. CryptoDnes does not endorse and is not responsible for the content, accuracy, quality, advertising, products or other materials on this page. Readers should do their own research before taking any action related to cryptocurrencies. CryptoDnes shall not be liable, directly or indirectly, for any damage or loss caused or alleged to be caused by or in connection with use of or reliance on any content, goods or services mentioned.
Nikolay is a cryptocurrency analyst and market writer with years of experience tracking digital asset trends and emerging blockchain technologies. A long-time crypto enthusiast, he actively trades across major exchanges and specializes in identifying early-stage projects and meme tokens. His analysis combines technical insight with a strategic, long-term investment perspective.
November has been off to a bad start for the crypto market as both the SOL price and the price of Ripple are bleeding on the charts. Nevertheless, some influencers still remain bullish and are looking at them as “altcoins to buy” this cycle. For instance, influencer Elite Crypto foresees a potential jump to $250 for Solana.
Meanwhile, Digitap ($TAP) is also turning some heads with its crypto presale performance, which has seen it make early buyers 114% richer. Not only that, its global money app completely revolutionized the cross-border payments market, potentially making $TAP a better bet than Ripple.
Solana Predicted To Reach $250? Technical Indicators Say No
Although one of the best cryptos, Solana, has been showing some red price charts recently. CoinMarketCap shows that the SOL price saw a dip from around $200 to below $160 in the past seven days. In other words, there was a 20% fall in just a few short days.
However, prominent influencer Elite Crypto thinks an uptrend is coming for Solana. According to his X post, SOL is showing a clean retest setup within its long-term ascending channel. He expects the SOL price to soar to the $250 level soon.
$SOL is showing a clean retest setup within its long term ascending channel
The recent pullback looks like a healthy correction after months of upward movement and is still holding strong above its support. I am expecting the price to touch the green zone again before the next… pic.twitter.com/oeEGZxf4VG
TradingView does not support this Solana price prediction. Notably, both the MACD level and its momentum indicator are now sinking in the sell zone for the Solana coin. As selling pressure rises, the SOL price could see more dips.
A Big Move Incoming for Ripple – Things To Keep an Eye On
Although one of the top 10 altcoins to buy as per market cap, Ripple has also been going through some turbulence on the charts. On the one-week chart, the price of Ripple fell from around $2.65 to nearly $2.20 as per CoinMarketCap.
Some people are still excited since influencer Steph Is Crypto made an X post saying that a big move could be coming for Ripple. He claims that the Bollinger Bands are now contracting, which may lead to a breakout that could be ahead for the price of Ripple.
But influencer Sjuul made a bearish Ripple price prediction, which also made waves. According to his X post, the Ripple crypto must reclaim the $2.70 level if it does not want to dip below $2 again. With TradingView also showing bearish signs, like its momentum indicator in the red, it is clear that Ripple may go through more turbulence as selling pressure rises.
Digitap Gains Traction Amid a 114% Pump – the Best Crypto To Buy Now?
Digitap has been making headlines, too, but for a good reason. This is all thanks to its great crypto presale performance, which has seen Digitap raise over $1.3 million in record time while also pumping by 114%. These numbers are expected to continue growing since the presale is only in phase two right now.
What really has people talking is the fact that Digitap launched the first “omnibank” in the world. On this global money app, users can manage, receive and spend over 100 different crypto coins and fiat currencies like euros, all from one account.
This account is also protected by 2FA, alerts and real-time monitoring. With such a focus on security and multi-currency management, Digitap could revolutionize the entire cross-border payments sector.
Those who want to support Digitap are now buying its native token, $TAP. One $TAP coin currently costs only $0.0268. However, this value is expected to soar to $0.0297 after the third presale round begins. With a Tier-1 CEX also rumored to be listing $TAP soon, this 10% growth could be just the tip of the iceberg since demand for $TAP may skyrocket soon. All these factors make $TAP the best crypto to buy this cycle, as per some analysts.
Can Digitap Outshine Solana and Ripple This November?
While Solana and Ripple are still attempting to hold onto their “altcoins to buy” status, Digitap is making a name for itself. It has pumped by 114% in its crypto presale while both the SOL price and the price of Ripple sank. Plus, the launch price of the $TAP coin is expected to be $0.14 – a 422% rise from its current value. In other words, those who buy it today could experience big returns in the future.
Not only that, Digitap is positioned perfectly to capitalize on the growth of the cross-border payments market, which FXC Intelligence claims will be worth $320 trillion by 2032. This could give $TAP more room for growth and possibly make it the top token to watch this November.
Discover how Digitap is unifying cash and crypto by checking out their project here:
Bitcoin price is climbing again. After plunging below $100,000 on Tuesday for the first time since June, Bitcoin (BTCUSD) has rebounded sharply above $103,000, rising nearly 1.99% in the last 24 hours. It’s now trading around $103,494, up about $2,025 from yesterday’s close. The recovery comes as traders digest a brutal week that saw Bitcoin tumble over 20% from its all-time high of $126,296 set just a month ago. The daily range between $98,950 and $104,026 shows how volatile the market remains. Bitcoin’s total market cap now sits near $2.04 trillion, with $793.8 million in trading volume over the past 24 hours.
But beneath the rebound lies a deeper concern — long-term holders are selling big. According to 10x Research, veteran investors have offloaded around 400,000 BTC in the last month, worth nearly $45 billion. Markus Thielen, the firm’s head of research, warned that this “massive exodus” has left the market unbalanced. “Conviction among long-term holders is eroding,” he said, adding that the selling pressure could continue well into next year.
Data from K33 Research shows over 319,000 Bitcoin have been reactivated from wallets dormant for six to twelve months — a clear sign of profit-taking. “While some reactivation stems from internal transfers, much reflects real selling,” said Vetle Lunde, head of research at K33. The pattern suggests many investors are locking in gains as prices stall, with confidence slipping after months of strong momentum.
Unlike the October crash, when $19 billion in leveraged positions were wiped out, this selloff has been driven mainly by spot market selling. In the past 24 hours, only $2 billion in crypto positions were liquidated — modest compared to prior washouts. This means the pressure is coming from investors willingly exiting, not from margin calls. Meanwhile, open interest in Bitcoin futures remains muted, and options traders are loading up on put contracts targeting $80,000, signaling expectations of more downside.
Thielen said the key driver now is the imbalance between sellers and buyers. “The whales are just not buying,” he noted, pointing out that wallets holding 100–1,000 BTC have sharply cut accumulation. Institutional demand, which once cushioned Bitcoin’s pullbacks, has also cooled. With the 50-day moving average around $113,379 and the 200-day near $109,952, Bitcoin remains technically in a bearish zone.
Live Events
Looking ahead, Thielen expects the unwind to last until spring 2026, similar to the 2021–2022 bear market, when over 1 million BTC were sold by large holders over several months. He doesn’t expect a collapse but sees room for a further decline toward $85,000, his maximum downside target. “We could see Bitcoin consolidating or drifting slightly lower from here before stability returns,” he said. Despite the fear, institutional interest hasn’t vanished completely. Some analysts argue this reset could strengthen Bitcoin’s long-term setup, allowing a healthier base before the next rally. For now, all eyes are on the $100,000 mark — the new psychological floor. Holding that level could mean the correction is near its end. But slipping below it again might trigger the next leg of this crypto downturn. Bitcoin price prediction: The near-term outlook suggests cautious consolidation around $100K–$105K, with upside resistance near $110K and a potential downside floor around $85K if selling continues. The next few weeks will reveal whether Bitcoin’s bounce is the start of recovery or just a brief relief rally before another wave of pressure hits.
Bitcoin price rebounds but market remains fragile
Bitcoin (BTCUSD) rose 1.99% to around $103,494, recovering from a sharp drop below $100,000 earlier this week. The world’s largest cryptocurrency gained about $2,025 in the past 24 hours after Tuesday’s 7.4% plunge — its steepest fall since June. The day’s trading range hovered between $98,950 and $104,026, showing the ongoing market volatility.
At current levels, Bitcoin’s market capitalization stands near $2.04 trillion, with $793.8 million in trading volume over the last 24 hours. The digital asset opened at $101,468, the same as its previous close, suggesting cautious sentiment among traders.
Long-term holders dump $45 billion in Bitcoin
The latest correction wasn’t triggered by leverage this time. Instead, it’s being driven by long-term Bitcoin holders unloading nearly 400,000 BTC, worth around $45 billion, over the past month. According to Markus Thielen of 10x Research, this wave of selling has left the market “unbalanced.”
Data from K33 Research shows that 319,000 Bitcoin have been reactivated in recent weeks, mostly from wallets inactive for six to twelve months — a clear sign of profit-taking. “While some reactivation stems from internal transfers, much reflects real selling,” said Vetle Lunde, head of research at K33.
Why Bitcoin fell below $100,000
Bitcoin dropped below $100,000 for the first time since mid-June, marking a 20% decline from its record high of $126,296 reached last month. The pullback follows a broader “risk-off” shift across financial markets as investors reassess inflation and rate-cut expectations.
Unlike October’s crash, which was fueled by forced liquidations, the current slide stems from steady selling in the spot market. Around $2 billion in crypto positions were liquidated over the last day — far below the $19 billion wiped out in October’s derivatives-driven crash.
Open interest in Bitcoin futures remains subdued, while options traders are increasingly betting on downside risk, with many targeting the $80,000 level through put contracts.
Whale activity points to fading confidence
According to Thielen, Bitcoin’s direction now depends on how quickly new buyers can absorb the coins long-term holders are selling. “Mega whales,” who hold between 1,000 and 10,000 BTC, started reducing their exposure months ago. Institutional buyers have slowed down, and accumulation among wallets holding 100–1,000 BTC has dropped sharply.
“The whales are just not buying,” Thielen said, warning that this imbalance could keep pressure on prices.
Bitcoin’s 50-day moving average sits at $113,379, while the 200-day average is around $109,952 — both above current prices, signaling a bearish setup. Thielen expects the ongoing unwind to continue well into spring 2026, possibly mirroring the 2021–2022 bear cycle, when over 1 million BTC were sold across a year.
While he doesn’t expect a crash, Thielen sees potential for further declines, with a maximum downside target of $85,000. “We could consolidate and drift a bit lower from here,” he said.
Despite the selloff, institutional interest remains firm, suggesting the correction may represent a healthy reset rather than a deeper collapse. Traders are closely watching whether Bitcoin can hold above $100,000, which may define the next trend in the crypto market.
ADA struggles below key EMAs, signaling sustained bearish market control.
Futures open interest drop shows fading trader confidence and reduced leverage.
Continuous exchange outflows highlight weak accumulation and liquidity decline.
Cardano (ADA) continues to face bearish pressure as the cryptocurrency struggles to hold above the $0.49 support zone. The asset has maintained a downward trajectory for several weeks, with sellers dominating short-term momentum.
ADA currently trades around $0.534, remaining well below key moving averages. The persistent weakness reflects a broader market slowdown, as traders exit leveraged positions and sentiment cools across altcoins.
Sustained Downtrend and Resistance Clusters
ADA has been trading below its 20, 50, 100, and 200-EMA levels, underscoring sustained bearish momentum. Each rebound attempt toward the $0.60–$0.65 …
XRP is showing signs of resilience as it holds $2 key support, sparking optimism among traders amid a volatile crypto market. Analysts are watching closely for potential rebounds.
The cryptocurrency has experienced notable swings in recent weeks, influenced by both market trends and regulatory developments. With Ripple’s recent initiatives and growing institutional interest, XRP may be positioned for a strong recovery toward the $5 mark.
XRP Maintains Critical Support Amid Market Fluctuations
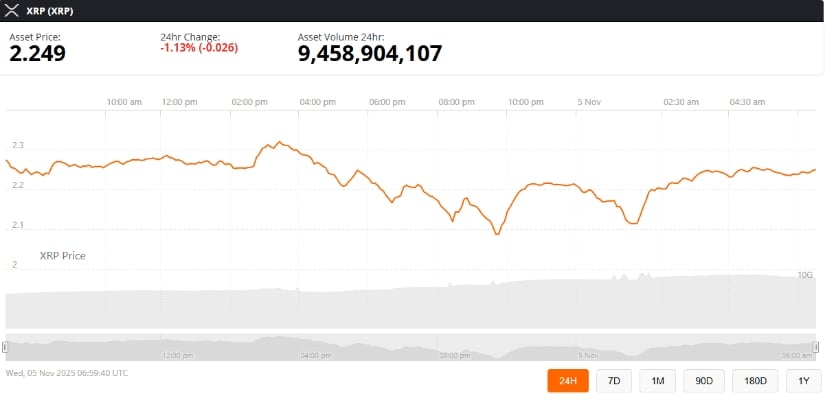
XRP has recently stabilized near the $2 mark after a period of heightened volatility in the cryptocurrency market. Analysts and traders have noted that this level has acted as a strong horizontal support, preventing further declines and positioning the digital asset for a potential recovery. As of November 5, 2025, the XRP price today hovers around $2.22, following a rebound from its recent dip.
$XRP is expected to hold strong support around the $2 level. Source: Ali Martinez via X
Crypto analyst @ali_charts confirmed their October 31 prediction that XRP would find support at $2, a forecast that has now materialized. The chart from TradingView shows XRP’s daily price action on Binance, highlighting the $2 support level amid a broader downtrend from summer highs near $3.
“This support line has historically held during 20-30% corrections,” the analyst noted. “The current dip provides more clarity and may pave the way for a significant upside.”
Ripple Prime Launch Sparks Institutional Interest
In addition to technical support, Ripple XRP news highlights the launch of Ripple Prime, a new U.S.-focused crypto exchange that facilitates spot trading for institutional clients. The platform resulted from Ripple’s acquisition of Hidden Road and now enables over-the-counter (OTC) trading for large-scale investors.
Ripple Prime officially launches in the U.S., offering clients OTC spot trading for major digital assets and stablecoins, including $XRP and $RLUSD. Source: Ripple via X
Trading volumes on XRP have leaped, almost doubling to $8 billion—or about 6% of XRP’s circulating supply. Such liquidity may solidify xrp price prediction for 2025 by giving the token a basis to recover toward $5, some analysts say.
Technical Analysis: Harmonic Patterns Signal Upside Potential
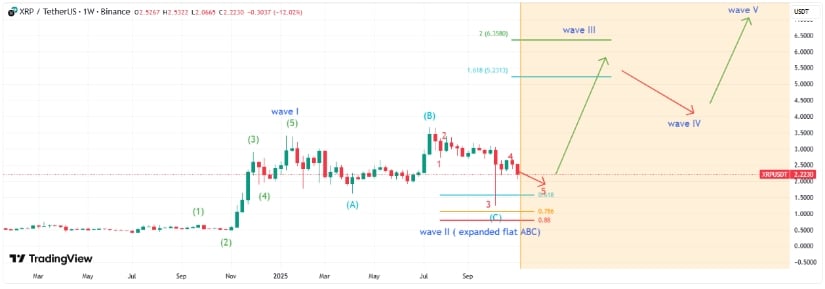
Although it has recently declined, technical indicators are showing a bullish scenario. XRP seems to form a bearish Bat harmonic pattern on the daily chart, hence a structure that normally forms in front of a potential reversal. The point C of this pattern, around $2.2285, has acted as a support, while the 200-day moving average, near $2.6235, is a key resistance.
The recent dip clarifies XRP’s weekly Elliott Wave pattern: Wave II is ending, and while a Wave 5 downside may form, it’s likely truncated and won’t break Wave 3’s low. Source: abdulahalkasid on TradingView
If XRP maintains its position above Point C and continues to gain momentum, it may move toward the potential reversal zone between $2.99 and $3.10. This setup indicates a near-term upside potential of approximately 34% from current levels, reinforcing the optimistic outlook for XRP price forecasts.
Market Scenarios
Analysts believe the price action of XRP will be determined by how the cryptocurrency behaves at its present support levels. If the token holds its current position above $2 and consolidates for a strong upward move, technical forecasts place the price closer to $5 in the next few months, backed by Elliott Wave patterns pointing toward the upside.
XRP was trading at around 2.25, down 1.13% in the last 24 hours at press time. Source: Brave New Coin
Failure to do so could mean a deeper pullback toward $1.60, though analysts consider this less probable given the prevailing market conditions. The neutral scenario is that XRP might consolidate between $2 and $2.50 before breaking out, establishing a very solid foundation for future gains. Analysts emphasize the importance of keeping a close eye on both technical indicators and macro market developments in light of ongoing regulatory updates that shape investor sentiment.
Regulatory Developments and Market Sentiment
Other influences on XRP’s recent volatility have included regulatory updates, such as developments regarding the XRP SEC lawsuit. The resolution of some of these regulatory uncertainties has increased investor confidence and helped stabilize XRP.
This, combined with the possible approval of ETFs and continued institutional adoption, paints a bright outlook for XRP.
Final Thoughts
With XRP changing hands above the key support of $2 and growing institutional interest in the digital asset, the token seems well-positioned for a rally toward $5.
Market participants should continue to keep a close eye on the ongoing behavior of technical indicators, market sentiment, and regulatory developments that will materialize the price predictions of XRP for 2025.
The
cryptocurrency market crashed for a second consecutive day today (Wednesday), 5
November 2025, losing over $1 trillion in market capitalization since early
October as Bitcoin, Ethereum, XRP and Dogecoin prices led a broad-based
selloff.
The entire
crypto ecosystem is experiencing dynamic declines with Ethereum at $3,303 (after
-16% two-day crash), Bitcoin testing $100,000 psychological support, and major
altcoins extending losses as institutional investors rotate out of digital
assets.
In this
article, I examine why crypto is going down and conduct a technical analysis of
the BTC/USDT, XRP/USDT, ETH/USDT and DOGE/USDT charts, based on more than 10
years of experience as a cryptocurrency investor and analyst.
Federal
Reserve Chairman Jerome Powell’s hawkish remarks downplaying December rate cuts
created the initial catalyst for crypto’s collapse. The probability of a
December cut collapsed from 96% before Powell’s press conference to just 69.3%
afterward, dampening expectations for looser financial conditions that
typically support cryptocurrency prices.
The
cryptocurrency collapse coincides with a broader tech selloff. Palantir dropped
8% despite beating earnings on valuation concerns, while Nvidia shed 4% losing
$200 billion in market capitalization. The Nasdaq fell 2% and the S&P 500
declined 1.2%, reflecting growing worries about AI-driven stock valuations.
Institutional
investors pulled $1.15 billion from Bitcoin ETFs last week, led by BlackRock,
ARK Invest, and Fidelity. This exodus signals a significant shift in sentiment
as traditional financial institutions that drove Bitcoin’s rally to $126,000 in
early October are now reducing exposure amid Federal Reserve uncertainty and AI
bubble concerns.
Ethereum 16% Two-Day Crash
Breaks 200-Day EMA
According
to my technical analysis, the price of Ethereum (ETH) has experienced two days
of dynamic declines in a row, losing approximately 16% within 48 hours. For the
chart situation, this is a very large change, and from my technical analysis,
these declines from the first part of the week fully hand power to the bears,
changing the trend currently to downward.
Most
significantly, we went below the 200-day exponential moving average (200 EMA),
simultaneously breaking out of the consolidation range drawn since July, and
also went below the zone of August lows, leaving behind a series of very
important supports which are now resistance.
Why Ethereum price is going down today? Source: Tradingview.com
At this
moment, bears have the advantage in the market, so further depreciation cannot
be ruled out either, and the target level or range, according to my forecasts,
is the April minimums at the $2,380 level. This means ETH could fall from
current levels by as much as 60%.
Bitcoin Price Tests $100K
After 8% Two-Day Plunge
The price
of Bitcoin (BTC), like other major cryptocurrencies discussed by me in this
analysis, has two days of dynamic declines behind it, during which it lost a
total of 8% in value, and prices stopped only at the height of the psychological $100,000 level last tested in June. Today Bitcoin is trying to
violate this level for the second day in a row.
Bulls are
trying to defend for now. If it is broken, however, it opens the road to a much
stronger downward correction. We will officially exit the consolidation range
drawn from May, and moving below the 200-day exponential moving average (200
EMA) only confirms that now bears are in the lead.
I identify
the first zone of declines around the levels of $92,000 and $94,000, where
Fibonacci extension and retracement levels coincide, with the target zone of
declines around $74,000 and $76,000, the April lows where the 161.8% Fibonacci
extension also falls.
Why Bitcoin price is going down today? Source: Tradingview.com
Joel
Kruger, strategist at LMAX, also provided important context: “A sustained
move under the 50-week could extend the pullback toward the top of the cloud
near $95,000, where we would expect strong support and the formation of a
higher low before the next leg higher to fresh record highs. The key takeaway:
this remains a healthy correction within an ongoing bull market, not a bearish
shift.”
XRP’s Death Cross Looms at
$2.30 Support
The XRP is
managing best for now compared to other leading cryptocurrencies, maintaining
local support levels and trading still in the $2.20-$2.30 zone coinciding with
July lows.
This
doesn’t change the fact, however, that prices broke out at the beginning of
October from a wedge or triangle formation and are currently consolidating at
lower levels below the 50 and 200 EMA which are very close to drawing a death
cross, a crossover which, according to technical analysis enthusiasts like me,
is a strong sell signal.
If the
current support doesn’t hold, we face a decline below the round $2.00 level,
including toward $1.90, June lows. The next target decline level is $1.61 at
April minimums, and the ultimate level is $1.25, the level last observed in
November 2024 coinciding with intraday lows from October 10 when the market
briefly collapsed, as well as my XRP price decline forecast based on Fibonacci
extensions.
Why XRP price is going down today? Source: Tradingview.com
Dogecoin Also Sees Death
Cross, Forms at Channel Bottom
Although
Dogecoin (DOGE) chart clearly shows it has lost and cut itself off from its
September highs by several cents, in broader terms we actually remain in the
same consolidation drawn since February. Its lower limit, which we are
currently witnessing, falls just above the 14-cent level, while the top is at
just under 29 cents.
The last
hours of declines caused some local supports to turn into resistance, and at
this moment, only the lower limit of the sideways channel last tested in June
stands before us. What’s more significant, however, is we’re moving below the
50 and 200 MA which have already formed a death cross formation, the very
strong sell signal mentioned earlier by me.
If the
current support doesn’t hold and we exit this consolidation, Dogecoin could
pave the road to stronger declines and a retest of levels last observed in
August 2024 below the 8-cent level.
Why Dogecoin price is going down today? Source: Tradingview.com
Crypto Price Analysis, FAQ
Why is crypto crashing
today?
Cryptocurrency
market lost over $1 trillion since October 6 peak with Bitcoin breaking
$100,000 for first time since June (-5% daily to $100,893), Ethereum crashing
-16% over 48 hours to $3,303, triggered by Federal Reserve Powell walking back
December cuts (probability 96% to 69.3%), AI bubble concerns spreading from
tech selloff (Nasdaq -2%, Nvidia -4%), institutional exodus (Bitcoin ETF
outflows $1.15B) and. leverage cascade ($1.78B liquidations affecting 441,867
traders).
Will Bitcoin go below
$90,000?
Yes, it may.
According to my technical analysis, Bitcoin breaking $100,000 opens path to
first target $92,000-$94,000 (Fibonacci extension/retracement zone coinciding
with April-May lows), ultimate target $74,000-$76,000 (April minimums + 161.8%
Fibonacci extension).
Why are Ethereum and
altcoins falling harder than Bitcoin?
According
to my analysis, Ethereum down -16% over 48 hours breaking below 200-day EMA and
consolidation range from July, bears now in control with potential 60% decline
to $2,380 April lows if 50% Fibonacci support $3,175 breaks, XRP death cross
forming between 50/200 MA at $2.30 support, Dogecoin death cross completed
testing channel bottom 14 cents, altcoins exhibiting 1.5-2x Bitcoin beta
amplification typical during market weakness.
Is this a crypto bear
market?
In my
opnion, yes. Bears warning Peter Schiff “losses staggering surpassing
dot-com bubble,” CredibleCrypto “most severe bear market in Bitcoin’s
history,” $1 trillion market cap loss, institutional exodus $1.15B ETF
outflows, 2018 parallel (October weak, November brutal preceded -37% crash).
Before you go, please also check my previous (and more bullish) crypto price predictions:
The
cryptocurrency market crashed for a second consecutive day today (Wednesday), 5
November 2025, losing over $1 trillion in market capitalization since early
October as Bitcoin, Ethereum, XRP and Dogecoin prices led a broad-based
selloff.
The entire
crypto ecosystem is experiencing dynamic declines with Ethereum at $3,303 (after
-16% two-day crash), Bitcoin testing $100,000 psychological support, and major
altcoins extending losses as institutional investors rotate out of digital
assets.
In this
article, I examine why crypto is going down and conduct a technical analysis of
the BTC/USDT, XRP/USDT, ETH/USDT and DOGE/USDT charts, based on more than 10
years of experience as a cryptocurrency investor and analyst.
Federal
Reserve Chairman Jerome Powell’s hawkish remarks downplaying December rate cuts
created the initial catalyst for crypto’s collapse. The probability of a
December cut collapsed from 96% before Powell’s press conference to just 69.3%
afterward, dampening expectations for looser financial conditions that
typically support cryptocurrency prices.
The
cryptocurrency collapse coincides with a broader tech selloff. Palantir dropped
8% despite beating earnings on valuation concerns, while Nvidia shed 4% losing
$200 billion in market capitalization. The Nasdaq fell 2% and the S&P 500
declined 1.2%, reflecting growing worries about AI-driven stock valuations.
Institutional
investors pulled $1.15 billion from Bitcoin ETFs last week, led by BlackRock,
ARK Invest, and Fidelity. This exodus signals a significant shift in sentiment
as traditional financial institutions that drove Bitcoin’s rally to $126,000 in
early October are now reducing exposure amid Federal Reserve uncertainty and AI
bubble concerns.
Ethereum 16% Two-Day Crash
Breaks 200-Day EMA
According
to my technical analysis, the price of Ethereum (ETH) has experienced two days
of dynamic declines in a row, losing approximately 16% within 48 hours. For the
chart situation, this is a very large change, and from my technical analysis,
these declines from the first part of the week fully hand power to the bears,
changing the trend currently to downward.
Most
significantly, we went below the 200-day exponential moving average (200 EMA),
simultaneously breaking out of the consolidation range drawn since July, and
also went below the zone of August lows, leaving behind a series of very
important supports which are now resistance.
Why Ethereum price is going down today? Source: Tradingview.com
At this
moment, bears have the advantage in the market, so further depreciation cannot
be ruled out either, and the target level or range, according to my forecasts,
is the April minimums at the $2,380 level. This means ETH could fall from
current levels by as much as 60%.
Bitcoin Price Tests $100K
After 8% Two-Day Plunge
The price
of Bitcoin (BTC), like other major cryptocurrencies discussed by me in this
analysis, has two days of dynamic declines behind it, during which it lost a
total of 8% in value, and prices stopped only at the height of the psychological $100,000 level last tested in June. Today Bitcoin is trying to
violate this level for the second day in a row.
Bulls are
trying to defend for now. If it is broken, however, it opens the road to a much
stronger downward correction. We will officially exit the consolidation range
drawn from May, and moving below the 200-day exponential moving average (200
EMA) only confirms that now bears are in the lead.
I identify
the first zone of declines around the levels of $92,000 and $94,000, where
Fibonacci extension and retracement levels coincide, with the target zone of
declines around $74,000 and $76,000, the April lows where the 161.8% Fibonacci
extension also falls.
Why Bitcoin price is going down today? Source: Tradingview.com
Joel
Kruger, strategist at LMAX, also provided important context: “A sustained
move under the 50-week could extend the pullback toward the top of the cloud
near $95,000, where we would expect strong support and the formation of a
higher low before the next leg higher to fresh record highs. The key takeaway:
this remains a healthy correction within an ongoing bull market, not a bearish
shift.”
XRP’s Death Cross Looms at
$2.30 Support
The XRP is
managing best for now compared to other leading cryptocurrencies, maintaining
local support levels and trading still in the $2.20-$2.30 zone coinciding with
July lows.
This
doesn’t change the fact, however, that prices broke out at the beginning of
October from a wedge or triangle formation and are currently consolidating at
lower levels below the 50 and 200 EMA which are very close to drawing a death
cross, a crossover which, according to technical analysis enthusiasts like me,
is a strong sell signal.
If the
current support doesn’t hold, we face a decline below the round $2.00 level,
including toward $1.90, June lows. The next target decline level is $1.61 at
April minimums, and the ultimate level is $1.25, the level last observed in
November 2024 coinciding with intraday lows from October 10 when the market
briefly collapsed, as well as my XRP price decline forecast based on Fibonacci
extensions.
Why XRP price is going down today? Source: Tradingview.com
Dogecoin Also Sees Death
Cross, Forms at Channel Bottom
Although
Dogecoin (DOGE) chart clearly shows it has lost and cut itself off from its
September highs by several cents, in broader terms we actually remain in the
same consolidation drawn since February. Its lower limit, which we are
currently witnessing, falls just above the 14-cent level, while the top is at
just under 29 cents.
The last
hours of declines caused some local supports to turn into resistance, and at
this moment, only the lower limit of the sideways channel last tested in June
stands before us. What’s more significant, however, is we’re moving below the
50 and 200 MA which have already formed a death cross formation, the very
strong sell signal mentioned earlier by me.
If the
current support doesn’t hold and we exit this consolidation, Dogecoin could
pave the road to stronger declines and a retest of levels last observed in
August 2024 below the 8-cent level.
Why Dogecoin price is going down today? Source: Tradingview.com
Crypto Price Analysis, FAQ
Why is crypto crashing
today?
Cryptocurrency
market lost over $1 trillion since October 6 peak with Bitcoin breaking
$100,000 for first time since June (-5% daily to $100,893), Ethereum crashing
-16% over 48 hours to $3,303, triggered by Federal Reserve Powell walking back
December cuts (probability 96% to 69.3%), AI bubble concerns spreading from
tech selloff (Nasdaq -2%, Nvidia -4%), institutional exodus (Bitcoin ETF
outflows $1.15B) and. leverage cascade ($1.78B liquidations affecting 441,867
traders).
Will Bitcoin go below
$90,000?
Yes, it may.
According to my technical analysis, Bitcoin breaking $100,000 opens path to
first target $92,000-$94,000 (Fibonacci extension/retracement zone coinciding
with April-May lows), ultimate target $74,000-$76,000 (April minimums + 161.8%
Fibonacci extension).
Why are Ethereum and
altcoins falling harder than Bitcoin?
According
to my analysis, Ethereum down -16% over 48 hours breaking below 200-day EMA and
consolidation range from July, bears now in control with potential 60% decline
to $2,380 April lows if 50% Fibonacci support $3,175 breaks, XRP death cross
forming between 50/200 MA at $2.30 support, Dogecoin death cross completed
testing channel bottom 14 cents, altcoins exhibiting 1.5-2x Bitcoin beta
amplification typical during market weakness.
Is this a crypto bear
market?
In my
opnion, yes. Bears warning Peter Schiff “losses staggering surpassing
dot-com bubble,” CredibleCrypto “most severe bear market in Bitcoin’s
history,” $1 trillion market cap loss, institutional exodus $1.15B ETF
outflows, 2018 parallel (October weak, November brutal preceded -37% crash).
Before you go, please also check my previous (and more bullish) crypto price predictions:
XRP is facing short-term pressure after a death cross formed at $2.70, signaling potential downside for traders. While technical indicators point to volatility, support around $2.00 could help stabilize the cryptocurrency, keeping investors cautiously optimistic.
Adding a bullish twist, Grayscale’s recent XRP spot ETF filing has sparked excitement in the market, highlighting the potential for increased institutional adoption. This development positions XRP for a possible rebound, balancing short-term risks with long-term growth opportunities.
Death Cross Raises Short-Term Concerns
On the technical front, XRP has recently formed a death cross on its 10-day and 20-day Exponential Moving Averages (EMAs) at the $2.70 level. Technical analyst @ChartNerdTA explains that “death crosses are lagging indicators and typically mark the worst of the pain on formation,” often signaling that short-term downward momentum has peaked.
XRP hits a $2.70 death cross on its 10/20 EMAs, signaling short-term pain with support near $2. Source: @ChartNerdTA via X
The same analysis notes potential support zones in the $2.00 vicinity, with further downside possible if selling pressure persists. Despite this, the macrostructure of XRP remains intact, indicating that the broader trend is not yet compromised. Analysts highlight that past corrections following death crosses have sometimes paved the way for renewed upward momentum.
Hidden Bullish Divergence Provides a Silver Lining
Despite bearish short-term indicators, a hidden bullish divergence has emerged on XRP’s monthly chart. Analyst @jaydee_757 points out that “XRP’s monthly lows are rising while RSI forms lower lows, signaling a potential continuation of the bullish trend if $2.09 support holds.”
XRP’s hidden bullish divergence remains intact if $2.09 holds, setting the stage for a potential rise while “dumb money” acts as exit liquidity. Source: @jaydee_757 via X
This divergence suggests that, even amid recent price drops, underlying momentum could support a recovery. JD emphasizes trading discipline, cautioning against hype surrounding events like Ripple’s Swell 2025 or the CLARITY Act (H.R.3633), stating that such distractions often cause retail investors to act as “exit liquidity” during price surges.
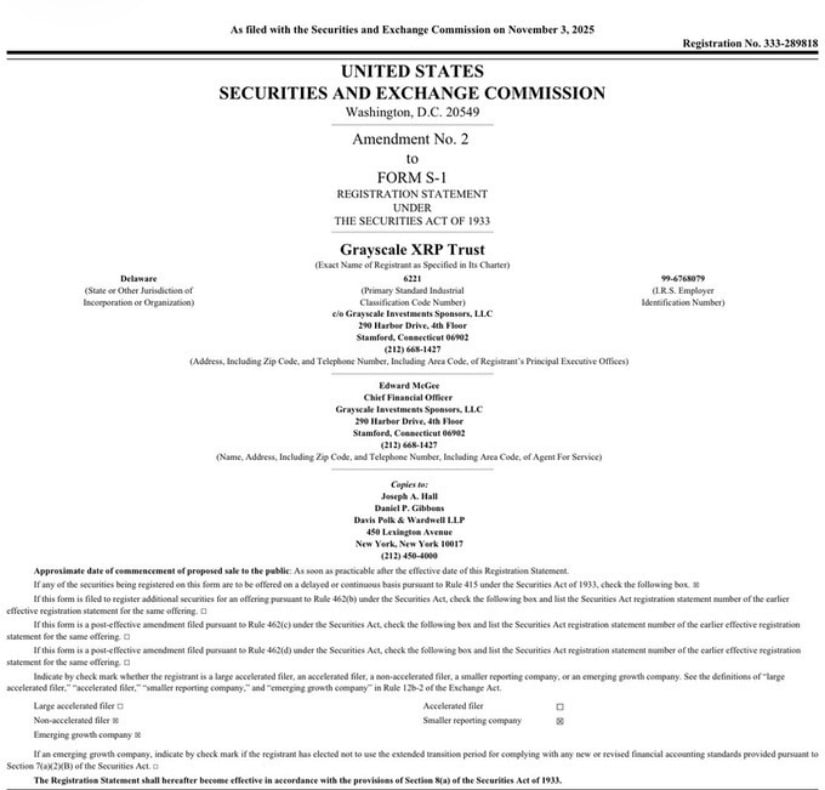
Grayscale XRP ETF Filing Boosts Market Sentiment
Adding a bullish catalyst to XRP’s outlook, Grayscale Investments recently submitted Amendment No. 2 to Form S-1 for the Grayscale XRP Trust. This filing moves the trust closer to launching a spot XRP ETF, which could open the cryptocurrency to regulated institutional investment in the U.S.
Grayscale files a new amendment for its XRP ETF, fueling optimism for institutional adoption. Source: @Steph_iscrypto via X
Crypto commentator @Steph_iscrypto reports, “BREAKING: Grayscale just submitted a fresh amendment for its $XRP ETF,” sparking optimism across the community. Several X users highlighted the potential impact on XRP’s price, noting that ETF approval could drive inflows and possibly push XRP toward new all-time highs.
Industry observers note that the filing follows a growing trend of institutional adoption for digital assets, with regulated ETFs providing safer avenues for large-scale investors. The SEC’s EDGAR database confirms the amendment, signaling a formal step toward mainstream access.
Final Thoughts
XRP is navigating a challenging period, with the recent death cross at $2.70 signaling short-term pressure. However, technical insights like the hidden bullish divergence on the monthly chart, combined with institutional developments such as the Grayscale XRP spot ETF filing, suggest that upside potential remains.
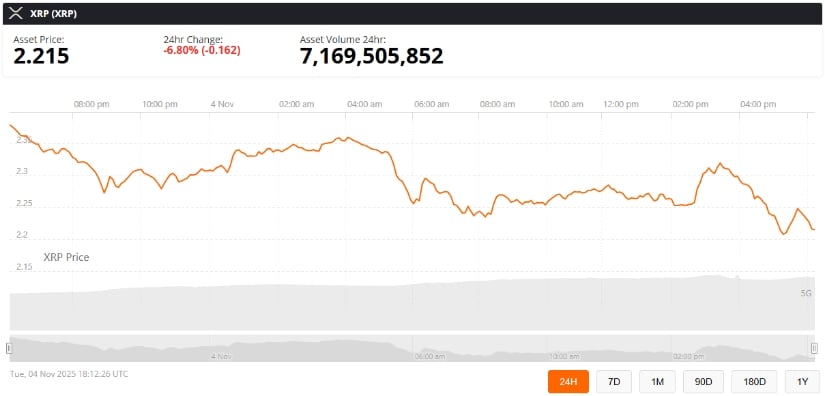
XRP was trading at around $2.21, down 6.80% in the last 24 hours at press time. Source: XRP price via Brave New Coin
Investors should stay cautious but remain attentive to these positive catalysts. Balancing short-term technical risks with long-term growth opportunities may provide the best strategy for navigating XRP’s evolving market landscape.
Cardano price has dropped to its lowest level in nearly a year, testing key support around $0.50 as participants anticipate whether a rebound or deeper correction will follow.
Cardano’s recent slump has rattled participants as ADA revisits price zones unseen in nearly a year. Despite the sharp sell-off, many see this as more than just capitulation; it’s a potential reset point where long-term holders quietly reaccumulate.
ADA Back to 1-Year Lows
Cardano’s price has dropped to $0.56, marking its lowest level in nearly a year according to Brave New Coin data. The 24-hour decline of over 6% reflects intensified selling pressure following a sustained series of lower highs since early October. Current market cap stands near $20.4 billion, with daily volume exceeding $1.7 billion, suggesting a mix of panic selling and short-term repositioning.
Cardano price is trading around $0.56, down -6.61% in the last 24 hours. Source: Brave New Coin
Technically, ADA Cardano price has now breached its 200-day moving average, exposing downside risk toward $0.50 to $0.52. A clean reclaim above $0.60 could be the first sign of short-term recovery, but without a surge in volume, the trend remains fragile. The macro structure continues to compress into a long-term range, where deeper wicks may still appear before stronger accumulation begins.
Buying Interest Returns as Cardano Support Holds
CryptoPulse highlights that ADA has entered a critical demand zone between $0.50 to $0.55, an area that historically triggered multiple reversals. The descending trendline continues to cap upside momentum, yet the price has repeatedly bounced within this green support block.
Cardano price continues to defend its key demand zone near $0.50, signaling renewed buying interest after multiple successful retests. Source: CryptoPulse via X
From a structural standpoint, ADA’s ability to stay above $0.50 keeps the potential alive for a rebound towards $0.70 to $0.80, aligning with the mid-range resistance zone. A decisive breakout above $0.66 would shift the short-term bias bullish, especially if volume follows through.
Cardano Price Analysis: Building a Strong Base at $0.53
Crypto analyst RISK’s outlook shows Cardano price consolidating around $0.5348 after a sharp decline, forming what appears to be a potential accumulation structure. The chart outlines two possible paths: a brief liquidity dip into $0.48 to $0.50 before reclaiming higher ground, or a steady rise if buyers defend current levels.
ADA appears to be forming a solid base near $0.53, hinting at early accumulation that could precede a broader bullish reversal. Source: RISK via X
Momentum indicators are stabilizing, with volume hinting at early accumulation phases. Should support hold, the next major upside objective lies at $0.85 to $1.00. The base formation at this range mirrors earlier cycles where prolonged consolidation preceded impulsive breakouts, suggesting that Cardano may be setting the stage for a larger trend reversal heading into 2026.
Fractal Analysis Hints at a Rebound Opportunity
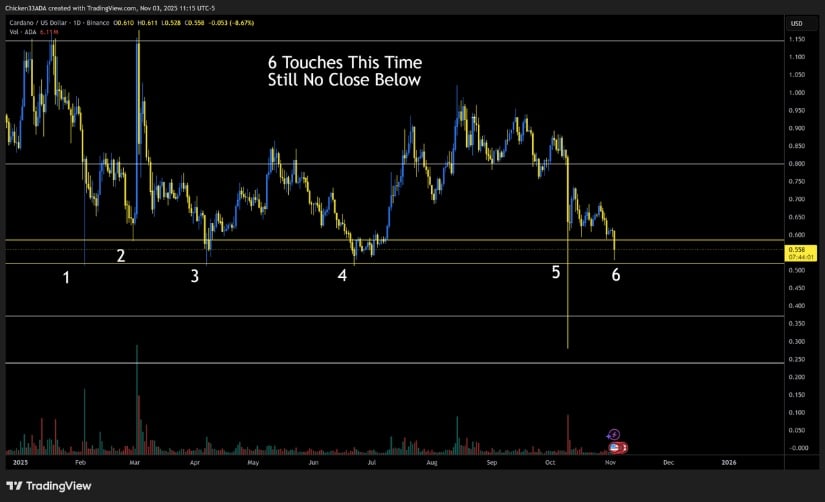
Price revisits an intriguing fractal comparison that mirrors Cardano’s previous exponential rally. Before its last major move, Cardano price tested the golden pocket five times without closing below it. This time, it has tapped the same retracement level six times, still holding firm.
Cardano’s repeated defense of the golden pocket mirrors its pre-rally behavior from past cycles, suggesting a potential setup for another major impulse wave. Source: Navir333 via X
This repeated defense of the golden pocket indicates strong underlying demand despite ongoing market fatigue. If the pattern holds, Cardano price could once again trigger a wave-three-style impulse from this region.
Final Thoughts: Will ADA Close 2025 Bullish?
Cardano’s current phase represents a critical inflection point, structurally weak yet technically resilient. The multi-test golden pocket, solid ETF-style inflows, and consistent support near $0.50 all highlight that while sentiment has cooled, accumulation may be quietly taking place.
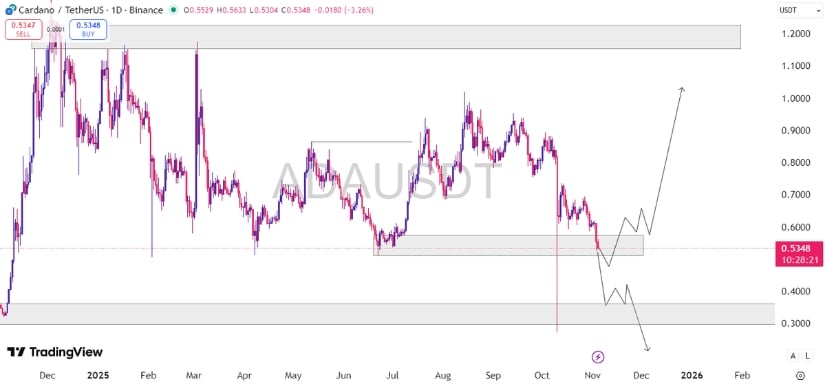
For a confirmed bullish close to 2025, ADA must reclaim the $0.70 to $0.80 range and secure weekly closes above $0.85 to reestablish momentum. Failure to hold $0.50 would, however, open room toward deeper corrective targets near $0.40. In essence, Cardano price prediction stands at the crossroads of capitulation and recovery, where patient holders may once again find opportunity.
XRP bulls are standing firm at a critical juncture as the XRP price today struggles to hold the $2.20–$2.25 support zone amid renewed selling pressure.
The broader crypto market has turned defensive following recent pullbacks in Bitcoin and Ethereum, raising concerns that Ripple (XRP) could retest the psychological $2 mark if sentiment fails to stabilize.
XRP Price Action Turns Cautious Near Key Support
As of November 5, 2025, the current XRP price hovers around $2.26, down more than 6% over the past 24 hours. This decline followed a sharp rejection from the $2.55–$2.70 range, where sellers regained control. On the weekly chart, XRP’s 10/20 exponential moving average (EMA) has formed a death cross near $2.70—a lagging bearish signal that often points to trend exhaustion but not always sustained downtrends.
XRP faces near-term downside risks from a looming death cross and tightening triangle, though BlackRock’s tokenization developments could spark a rebound above $2.55. Source: Faizan Haroon via X
Historically, death crosses in volatile assets like XRP have only predicted extended declines about 55–60% of the time, suggesting a potential for near-term exhaustion rather than a prolonged correction. Technical indicators now show price compression under a descending resistance line that has capped every rally since mid-August.
The daily chart highlights major resistance at $2.49 (20-day EMA) and $2.62 (50-day EMA), with the 100-day EMA at $2.69 reinforcing the upper bearish boundary. Unless XRP breaks above $2.60 and the $2.70 trendline, bullish sentiment may remain suppressed.
Derivatives Data Show Market Caution
On-chain and derivatives data reflect a cautious tone among traders. According to Coinglass, futures open interest dropped by over 16% to $3.5 billion as traders reduced leverage exposure. Meanwhile, XRP trading volume surged 63%—mostly from short-term rotations rather than new bullish inflows—while options activity fell sharply by 43%, suggesting a decline in speculative participation.
Exchange XRP Futures Open Interest (USD) chart. Source: CoinGlass
The aggregate long/short ratio across major exchanges like Binance and OKX remains below parity, signaling bearish bias. Funding rates have stabilized, but the absence of aggressive short covering indicates limited appetite for a reversal.
Despite this, a modest net inflow of $13 million was recorded on November 4, hinting at mild accumulation attempts by retail traders. However, broader weekly flows remain negative, reflecting persistent outflows since mid-October.
Whale Activity and Ripple Unlocks Add Pressure
Adding to the bearish tone, on-chain data revealed whale transactions involving over 900,000 XRP sold in recent sessions. Additionally, Ripple’s scheduled token unlock has introduced fresh supply into circulation, amplifying short-term selling pressure.
Whales have offloaded 900,000 XRP within the past five days, adding pressure to the token’s short-term market outlook. Source: Ali Martinez via X
Still, analysts note that XRP’s macro uptrend from early 2025 remains technically intact as long as the token holds above the $2 level. Previous bull-market death crosses have often coincided with local bottom formations, hinting that XRP could soon approach an exhaustion point before recovery.
A crypto market researcher commented that “if XRP defends the $2.20 support and reclaims $2.60 in the coming sessions, the structure could shift back toward neutral-to-bullish territory, targeting $2.85–$3.00 initially.”
Broader Market and Institutional Factors
XRP’s recent performance mirrors the broader crypto market slowdown, with Bitcoin trading near $104,000 and Ethereum hovering around $3,600. Despite the short-term correlation, some analysts point out that XRP’s weakening dependence on BTC price trends—fueled by Ripple’s growing real-world adoption—could signal early decoupling from traditional crypto cycles.
XRP was trading at around $2.26, down 6.28% in the last 24 hours at press time. Source: XRP price via Brave New Coin
Meanwhile, macro narratives like BlackRock’s continued interest in tokenization have introduced a speculative backdrop for XRP and similar utility-driven tokens. A breakout above $2.55–$2.65 could trigger a short-term relief rally, potentially extending to the $3 zone if market sentiment improves.
Outlook: Bulls’ Last Stand at $2.20
For now, the XRP price forecast hinges on the $2.20–$2.25 support band. A decisive breakdown below this area could open the path toward the $2 psychological level and possibly $1.85. Conversely, a rebound from this region could attract short-covering momentum and restore price stability above $2.45–$2.60.
Although the XRP price today reflects bearish undertones, the long-term XRP price prediction 2025 remains constructive, supported by Ripple’s ongoing partnerships, institutional interest, and potential regulatory clarity from the XRP SEC lawsuit resolution.
In the short term, traders remain cautious, watching whether bulls can defend the final support and prevent another leg down. If they succeed, XRP could soon stage a recovery phase that reaffirms its place among the top-performing altcoins as the market regains composure.


