The main tag of Cryptocurrency News Articles.
You can use the search box below to find what you need.
[wd_asp id=1]

29 10, 2025

Dogecoin (DOGE) Price Prediction: Dogecoin Holds Key Support as Bulls Eye Explosive $0.50 Breakout

By |2025-10-29T10:35:16+03:00October 29, 2025|Crypto News, News|0 Comments

Dogecoin (DOGE) is capturing investor attention again, holding critical support at $0.19 as analysts anticipate a potential breakout that could propel the meme coin toward $0.50.

Despite a quieter crypto market and declining trading volumes, Dogecoin continues to demonstrate resilience. Technical setups, historical patterns, and growing whale accumulation indicate the coin is positioning itself for a bullish surge. Traders are closely monitoring key support and resistance levels to gauge the next major move.

Dogecoin Stability Amid Low Volume

According to a recent analysis by Saad Ullah of The Tradable, Dogecoin has been holding firm around the 0.5 Fibonacci retracement level at $0.19–$0.20. Even as trading volume declines, technical indicators suggest accumulation is ongoing, creating the conditions for a possible breakout.

Analyst Ullah noted, “All it takes is just some volume. Even a modest influx of buying pressure could quickly flip this quiet phase into action.”

On the weekly chart, Dogecoin (DOGE) holds key support at the cycle high VWAP, Ichimoku “Katana,” and 0.5 Fibonacci level, with low volume suggesting a small influx could trigger a quick rebound. Source: Cantonese Cat via X

Dogecoin’s stability in this zone is further reinforced by the Ichimoku “Katana” formation and cycle VWAP indicators, which historically highlight equilibrium points before major price moves. These technical signals collectively point to a growing bullish potential if the $0.19 support continues to hold.

Triangle Patterns Signal Potential Upside

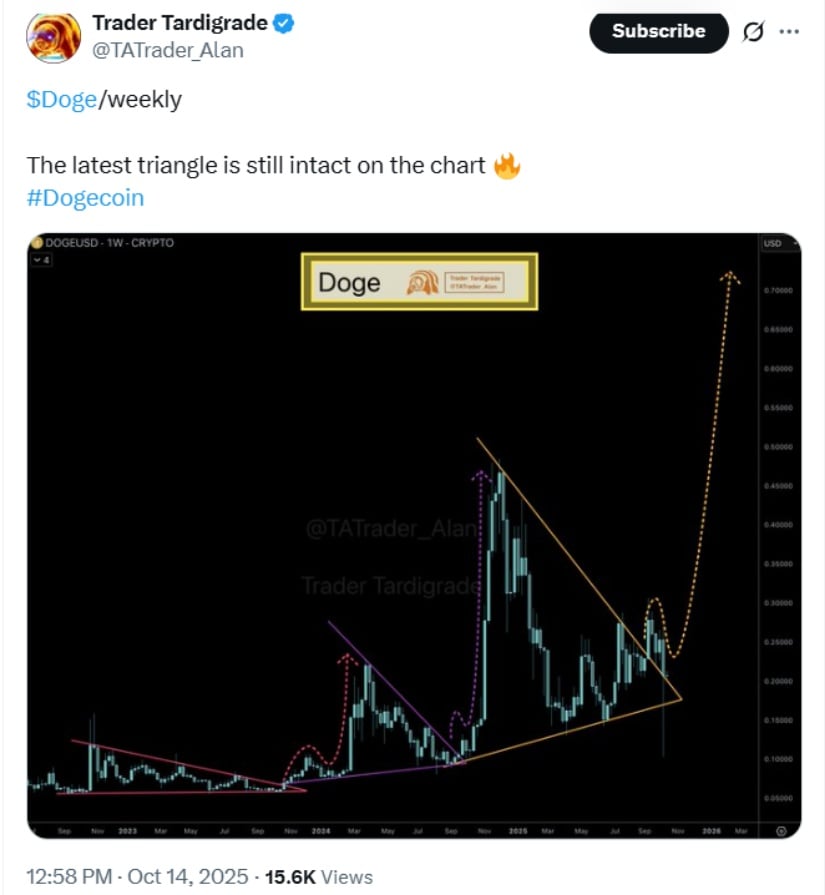
On the weekly chart, Dogecoin is trading within a well-defined triangle pattern, a classic setup that often precedes periods of high volatility. Usman Salis, a market analyst, highlighted that “DOGE has delivered explosive rallies after extended periods of compression, making the current triangle setup particularly interesting for traders.”
Dogecoin (DOGE) Price Prediction: Dogecoin Holds Key Support as Bulls Eye Explosive alt=

Dogecoin’s weekly chart maintains a symmetrical triangle, signaling consolidation with potential for a bullish breakout or bearish reversal depending on key support and resistance levels. Source: Trader Tardigrade via X

Key levels to watch include the lower boundary at $0.19 and the upper triangle resistance near $0.30. A clean breakout above this threshold could propel Dogecoin toward the $0.50 mark and potentially higher. Historical cycles from 2021 and 2024 suggest that similar triangle consolidations preceded sharp upward movements, lending credibility to the pattern’s predictive value.

Accumulation and Whale Activity

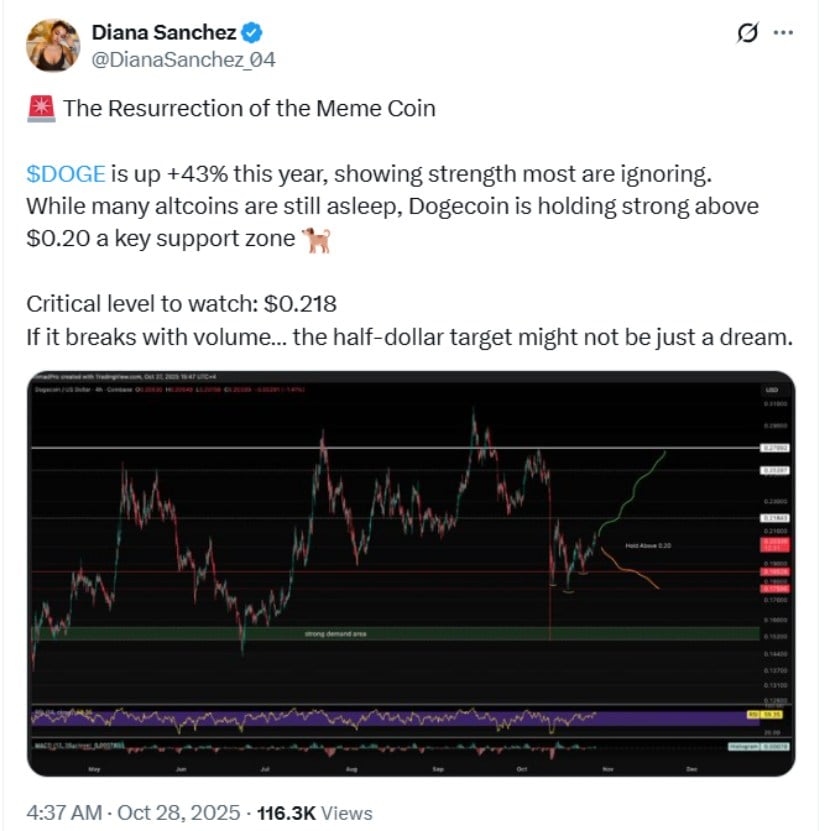
Data from October 2025 shows that whales have been actively accumulating Dogecoin. According to Diana Sanchez, $DOGE has surged 43% year-to-date and “is holding strong above $0.20, a key support zone,” despite altcoins underperforming.
Accumulation and Whale Activity

Dogecoin (DOGE) has surged 43% this year, holding firm above the $0.20 support zone, with $0.218 as a critical level—breaking it with volume could pave the way toward $0.50. Source: Diana Sanchez

Recent transactions indicate $134 million worth of Dogecoin was purchased by larger holders, flipping previous resistance at $0.21 into support. Analysts argue this accumulation could underpin the next bullish wave, potentially taking the coin to $0.50 if momentum persists.

Short-Term Targets and Outlook

Technical analysis points to immediate resistance levels at $0.25–$0.26, followed by higher targets at $0.33 and $0.50. According to Ali_charts, maintaining support near $0.18–$0.20 could allow DOGE to flip $0.25 into a new support level, enabling a rally toward $0.33 in the short term.

EtherNasyonal, a long-term market analyst, emphasized that “the real wave of expansion hasn’t arrived yet,” noting that Dogecoin is still in the accumulation phase within a lower band of an ascending channel. This mirrors previous bull waves observed in the 2015–2018 period, where DOGE climbed from fractions of a cent to roughly $0.018, marking a cumulative gain of over 5,000%.

Final Thoughts

Dogecoin (DOGE) continues to present an interesting combination of stability and bullish potential. Holding crucial support at approximately $0.19, paired with historical patterns and whale behavior, positions DOGE for an explosive push to $0.50.
Short-Term Targets and Outlook

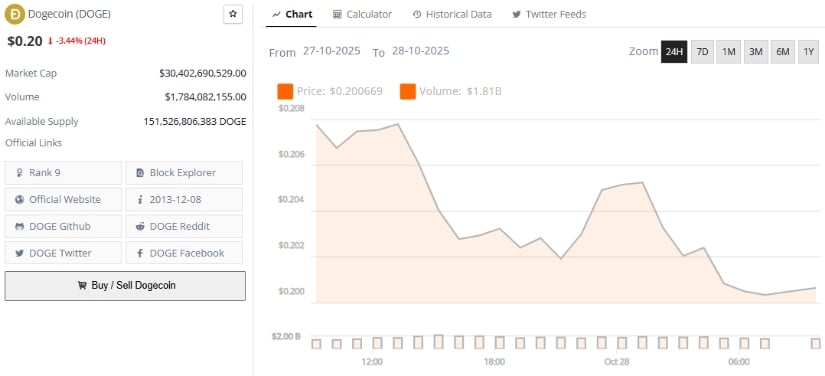
Dogecoin was trading at around $0.20, down 3.44% in the last 24 hours at press time. Source: Brave New Coin

Amidst continued uncertainty in the broader crypto market, technical setups suggest the meme coin is coiling for another phase of bullish momentum, with opportunities for traders and long-term holders alike.
Source link

29 10, 2025

XRP Price Prediction: XRP Eyes $3.60 Breakout as Liquidity Cluster and Whale Accumulation Drive Momentum

By |2025-10-29T08:34:45+03:00October 29, 2025|Crypto News, News|0 Comments

Investor confidence in XRP is strengthening as whales accumulate hundreds of millions worth of tokens and liquidity clusters form above current levels.

With XRP trading around $2.67 and the market eyeing the $3.60 breakout zone, the asset’s next move could determine whether this bullish wave matures into a full-scale rally.

XRP Approaches Critical Resistance Levels

According to crypto analyst Stephanie Starr (@StephanieStarrC), XRP is at a pivotal point. “This has been a level of resistance since early July. I will not get overly excited until we clear $3.22 and $3.60,” Starr noted. XRP recently tested $2.68, reflecting its struggle to break through long-standing resistance while maintaining support near $2.50.

XRP hits a critical resistance zone—watching $3.22 and $3.60 for the next breakout! Source: @StephanieStarrC via X

Technical charts from Bitstamp highlight ascending trend lines and repeated attempts to surpass resistance. Analysts suggest that a successful close above $3.22 could pave the way for a breakout toward $3.60. If momentum is sustained, some projections even anticipate a potential bull flag toward $4.50.

Liquidity Clusters Signal Potential Upside

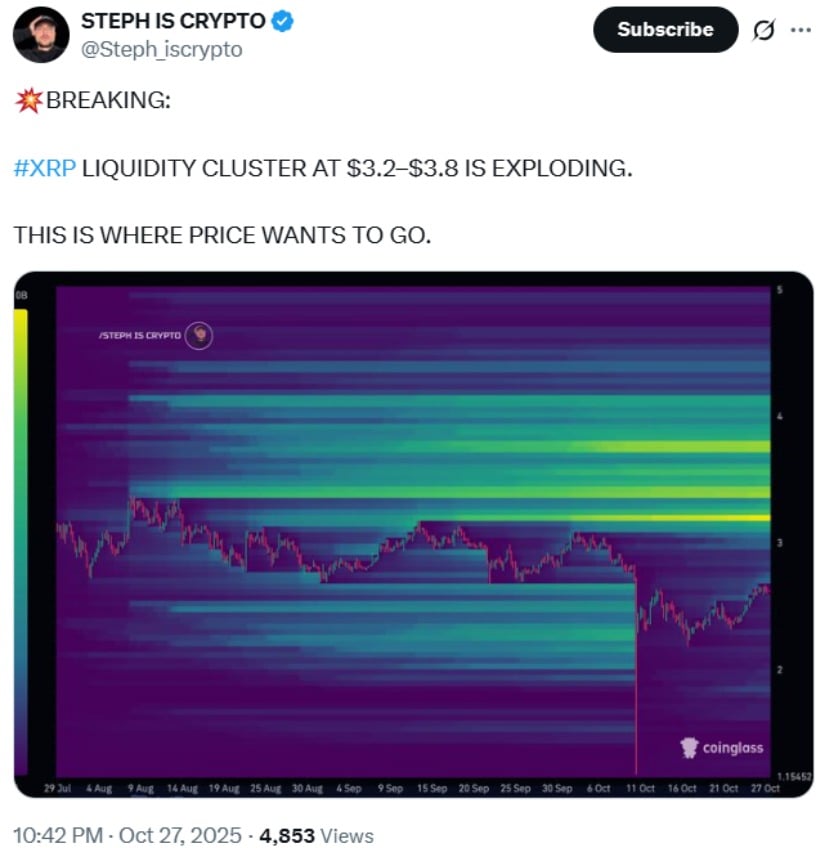
A recent analysis from Steph is Crypto (@Steph_iscrypto) highlights a dense liquidity cluster for XRP between $3.2 and $3.8. “This is where price wants to go,” the post noted, emphasizing the importance of accumulated orders in fueling breakouts.

XRP Price Prediction: XRP Eyes .60 Breakout as Liquidity Cluster and Whale Accumulation Drive Momentum

XRP’s $3.2–$3.8 liquidity cluster is exploding—target zone in sight! Source: @Steph_iscrypto via X

Liquidity clusters often act as magnets for price movement, attracting leveraged positions and triggering stop sweeps that can accelerate short-term rallies. On-chain data confirms heavy positioning in this range, signaling strong market interest.

Whale Accumulation Boosts Market Confidence

In October 2025, whales acquired $560 million in XRP, signaling strong institutional confidence in the asset. This significant accumulation points to potential upward momentum as large holders position themselves ahead of possible breakouts.

Whale Accumulation Boosts Market Confidence

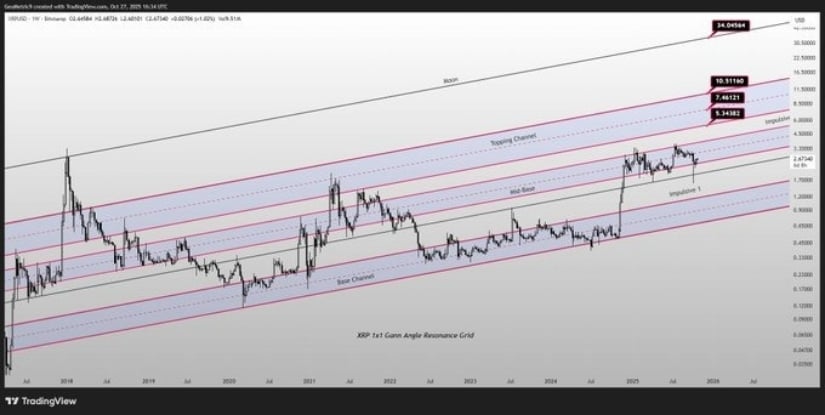
The XRP mid-base channel shows accumulation—holding here hints at upside, but breaking below could spark concern. Source: @GeoMetric_9 via X

Ripple’s ongoing advisory expansions and ecosystem developments have further reinforced optimism among traders and investors. Combined with on-chain data showing heavy leveraged positioning, XRP’s market activity suggests that both short-term gains and long-term growth are being closely watched by key players.

Market Sentiment and Strategic Considerations

Despite bullish signals, analysts caution traders to remain vigilant. XRP’s mid-base channel currently acts as a key accumulation zone. As long as the asset holds above the channel, upside potential remains. Consecutive closes below this level, however, could indicate short-term weakness.

Crypto experts suggest a balanced approach to trading XRP. While moon targets such as $9 remain mathematically possible, these are based on extended projections and require careful risk management.

Final Thoughts

XRP is showing signs of strong accumulation within its mid-base channel, supported by whale activity and a dense liquidity cluster between $3.2–$3.8. Holding above this channel suggests that upside momentum toward $3.60 remains possible, with technical indicators pointing to potential further gains. Traders and investors are watching these levels closely, as they could determine the next significant move for the asset.

Market Sentiment and Strategic Considerations

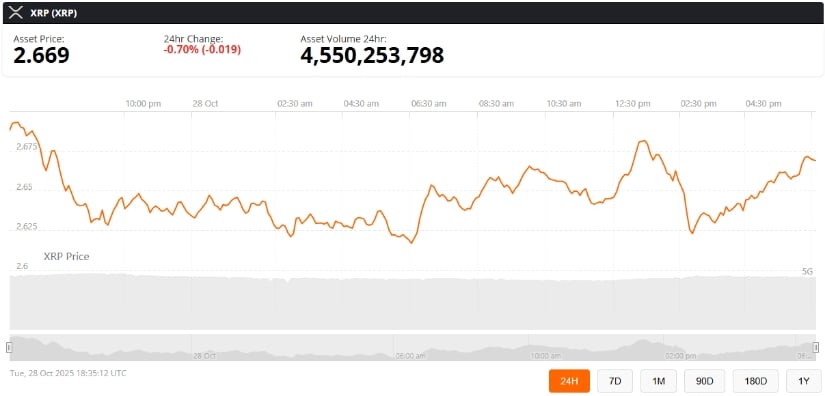
XRP was trading at around $2.66, down 0.70% in the last 24 hours at press time. Source: XRP price via Brave New Coin

However, caution remains essential. Consecutive closes below the channel or key resonance lines could signal weakness, while ambitious targets like $5–$10 require careful risk management. A strategic approach, laddering positions, and leaving small “moon bags” for long-term growth can help navigate the market’s volatility without overexposure.

Source link

29 10, 2025

As DOGE Rallies, Whales Turn

By |2025-10-29T06:32:48+03:00October 29, 2025|Crypto News, News|0 Comments

Dogecoin price prediction trends are heating up again as the original meme coin shows signs of a strong comeback.

But even though investors are optimistic about DOGE, whales are eyeing Ethereum’s memecoin, Layer Brett https://layerbrett.com, for bigger gains in November. Investors are wondering if Dogecoin will rally or if LBRETT will steal the show. Let’s find out.

Dogecoin price prediction: A breakout on the horizon?

At the time of writing, DOGE is trading at $0.2074, marking a 5.57% price increase in the last 24 hours. The meme token’s trading volume surged 150.57% in the same timeframe to reach 2.2B. Furthermore, DOGE has seen a 5.64% surge in market cap, outperforming coins such as Bitcoin and XRP.

Technical analysis points to growing bullish momentum for DOGE. The Relative Strength Index (RSI) stands near 47. This suggests that the meme token is in a neutral zone with neither overbought nor oversold conditions. Meanwhile, the MACD indicator has just recorded a bullish crossover, with the MACD line moving above the signal line. This often signals potential upward momentum.

Renowned analyst and trader Ali Martinez https://x.com/ali_charts/status/1982552565066973636 recently gave a bullish Dogecoin price prediction. As per analysis, $0.18 is a key support for DOGE. He suggests that if bulls defend this level, it could push prices to $0.25 and $0.33. This represents a potential 21% to 60% gain from current levels.

Layer Brett: A leader of the next generation of memecoins?

Layer Brett https://layerbrett.com is a new Ethereum Layer 2 memecoin that seeks to address key limitations faced by first-generation memecoins. Originally launched on the Base network with high potential but no clear direction, Layer Brett has evolved into a project with greater purpose.

At the center of the Layer Brett ecosystem will be its native token, LBRETT. Other than gas fees, LBRETT will be used for governance. This will give holders an active role in decision-making and ecosystem development. LBRETT will also be used for staking, enabling holders to earn passive income.

There’s a limited supply of 10 billion LBRETT tokens. Layer Brett has allocated them accordingly, potentially enhancing long-term value as adoption grows and demand increases. For example, 10% of the supply will be used for liquidity provision, 15% for ecosystem development, and a 5% reserve.

The network will also feature NFT integrations and gamified staking, providing an exciting and rewarding experience to LBRETT holders.

Why whales are turning to Ethereum’s Layer Brett

With bullish momentum for memecoins, DOGE whales are turning to Layer Brett because of the benefits it has over legacy meme tokens. These are:

● The Private Funding Phase: Layer Brett is offering an opportunity to buy LBRETT tokens early and at a discounted price. LBRETT is currently at $0.0058, with the next price point set at $0.0061 and over $4.4 million raised.

● Transactions & Payments: Because of its low-fee, high-speed design, LBRETT will be a more suitable currency for micro-transactions, swaps, memes, and NFTs.

● Staking & Yield Generation: Users can stake their LBRETT tokens and earn passive returns of over 500%.

Conclusion

While the latest Dogecoin price prediction points to potential short-term gains, investors are no longer chasing nostalgia. The spotlight is now increasingly shifting towards an Ethereum Layer 2 meme coin, Layer Brett.

Its combination of blockchain scalability, capped supply, and utility positions it as a strong contender in the memecoin space. Lastly, with a low entry barrier, LBRETT is at its all-time low value for early investors.

Don’t miss your chance to be a part of the next big memecoin

Website: https://layerbrett.com

Telegram: https://t.me/layerbrett

X: https://x.com/LayerBrett

Disclaimer: This article is for informational purposes only and does not constitute financial advice. Cryptocurrency investments carry risk, including total loss of capital. Readers should conduct independent research and consult licensed advisors before making any financial decisions.

Crypto Press Release Distribution by https://btcpresswire.com

This release was published on openPR.

Source link

29 10, 2025

Cardano Price Prediction: Experts Warn ADA May Lag Behind as Layer Brett Captures Trader’s Eyes In October

By |2025-10-29T04:31:19+03:00October 29, 2025|Crypto News, News|0 Comments

While investors keep an eye on Cardano price prediction charts, a new Ethereum Layer 2 project called Layer Brett is catching serious attention. It blends memecoin culture with real blockchain performance and analysts are already calling it the next crypto to explode.

Traders are beginning to look past Cardano’s recovery story and ask a new question: could Layer Brett be the next major crypto to take off?

Cardano Price Prediction: Can ADA regain its strength amidst ETF discussions?

Despite recent decline, many analysts remain positive on Cardano price prediction. ADA has long been one of the top DeFi tokens with strong fundamentals and a loyal community. It’s now trading around $0.67 after a 12.77% dip over the past month, bringing its total market cap to about $30.55B.

Source: TradingView

The $0.63–$0.65 support range is key to whether ADA can keep its bullish setup intact. The price has tested this zone several times, and staying above it could show that buyers interest. If ADA manages to bounce from here, it might make another run toward $0.85.

Also, Bloomberg reports a 75% chance of a Cardano ETF approval by 2026, with other analysts hinting the odds could be even higher. However, ADA’s large market cap makes explosive moves less likely. For investors seeking high-potential returns, smaller-cap projects like Layer Brett are becoming increasingly exciting.Cardano Price Prediction: Experts Warn ADA May Lag Behind as Layer Brett Captures Trader’s Eyes In October

Layer Brett Gains Serious Momentum

The latest Cardano price prediction suggests the project is still finding its footing, but Layer Brett has already taken center stage on crypto Twitter and Telegram. Its ICO has attracted strong attention, raising over $4.43 million so far, with tokens currently priced at $0.0061.

Built on Ethereum’s Layer 2, Layer Brett offers lightning-fast transactions and near-zero gas fees. It’s a meme coin, yes; but one with real utility. Early investors are already earning close to 600% APY from staking, and the roadmap outlines plans for NFT integration, gamified staking, and community-driven crypto governance.

What makes this even more interesting is the energy behind it. Traders aren’t just buying in; they’re talking, sharing, and building a culture around LBRETT. Early believers are being rewarded with both high yields and a sense that they’re part of something that could be the next big crypto.

Why Traders Are Choosing LBRETT Over Legacy memecoins 

For many investors, ADA feels like a “safe bet.” But the real excitement in crypto often starts with projects that combine potential with community passion, and that’s exactly where Layer Brett stands out.

Its 10 billion token cap helps prevent inflation, ensures scarcity and ensures value. Transactions are smooth and staking rewards are generous. Also, It’s fully decentralized community-focused crypto governance that ensures that holders can vote on updates, shape events, and even earn through referrals and contests. 

The contrast is hard to miss: while ADA holders wait for the next upgrade, LBRETT users are already earning, trading, and having fun in a growing ecosystem built for scalability and participation.

Catch the LBRETT train now!

Recent Cardano price prediction suggests that ADA remains a solid long-term play, but it’s not moving as fast as it used to. Layer Brett, on the other hand, is growing like wildfire. It is powered by humor, smart tokenomics, and real blockchain utility.

Every memecoin cycle has its breakout star. In 2021, it was Shiba Inu. In 2023, it was PEPE. In 2025, all signs point to LBRETT

Join the LBRETT movement today before the next price jump!

For More Information:

Website: https://layerbrett.com 

Telegram: https://t.me/layerbrett 

X: (1) Layer Brett (@LayerBrett) / X

Disclaimer: This is a paid post and should not be treated as news/advice. LiveBitcoinNews is not responsible for any loss or damage resulting from the content, products, or services referenced in this press release.
Source link

29 10, 2025

XRP Price Prediction: Key Levels to Watch Ahead of FOMC Meeting

By |2025-10-29T02:30:32+03:00October 29, 2025|Crypto News, News|0 Comments

REX-Osprey XRP ETF (XRPR) Stats – Source: REX-Osprey Website

This company would join VivoPower International in the list of XRP-focused treasuries that have already carried out their strategies, while multiple other publicly listed firms like Trident Digital Tech Holdings are negotiating with investors to launch similar initiatives.

Meanwhile, the REX-Osprey XRP ETF (XRPR) has surpassed the $110 million mark in assets under management, as institutional interest for altcoins keeps growing.

Although Trump temporarily derailed altcoin season, XRP’s daily chart still points to an ongoing consolidation. These technical setups tend to indicate accumulation by market participants, and could anticipate a big boost in the price.

What XRP needs at the time is another catalyst that manages to push the price above its all-time high. Ethereum (ETH) and BNB Coin (BNB) have paved the way, as these two have already reached new price records during this cycle.

XRP could play catch-up at some point, and the only reason why this move has been delaying seems to be that the market is taking a breather following the massive 500% rally that the token experienced between October 2024 and January 2025.

XRP Eyes Trend Line Breakout as RSI Sends Buy Signal

The daily chart shows that XRP climbed above the 200-day exponential moving average (EMA) in the past few days, favoring a bullish long-term outlook for the token.

Source link

29 10, 2025

SOL Bulls Target $500 By 2026, But Layer

By |2025-10-29T00:29:22+03:00October 29, 2025|Crypto News, News|0 Comments

Watching trending cryptocurrencies? Layer Brett’s L2 mechanics and staking make the 30x case, even as SOL’s $500 thesis plays out.

Rotation whispers are back as trending cryptocurrencies perk up and majors firm. Can Solana Price Prediction really land at $500 by 2026, or will a faster rail win the sprint?

In that lane, Layer Brett https://layerbrett.com on Ethereum Layer 2 is getting the clicks as the top meme token right now. Actions feel instant, staking crypto loops are practical, and culture meets mechanics. That’s why some watchers call LBRETT the next big crypto with a credible 30x shot if activity keeps building.

Solana price prediction: how high throughput and real apps drive the $500 case Solana

Solana’s case leans on high throughput, developers who keep building real apps, and steady DeFi and consumer use; in liquid markets, majors can grind higher, so a Solana price prediction of $500 by 2026 stays on the board.

But it’s still a multi-year arc. Rotations, pullbacks, and macro hiccups will show up. Long-view holders treat SOL as an altcoin with steady execution, not a “crypto pumping now” headline. That context keeps Solana price prediction honest while traders also scout nearer-term opportunities.

Even with SOL in the news, many are betting the sprint lives on Layer Brett, fast, cheap, repeatable, while Solana Price Prediction plays the marathon.

Layer Brett puts LBRETT in the fast lane with tiny fees

Layer Brett https://layerbrett.com is a memecoin built for repetition, not just one-off spikes. On Ethereum Layer 2, a Layer 2 blockchain, fees drop to cents, making tips, quests, and staking feel normal. As an ERC-20 token, LBRETT plugs into DeFi, Web3, and smart contracts, leaving the opportunity open to crypto governance later.

Early access for LBRETT is live via the official site, with the panel showing a current price of $0.0058, a next step at $0.0061, and $4,427,265 in funding already committed at capture time. Supporters can connect MetaMask or Trust Wallet, acquire with ETH/USDT/BNB, and activate staking when tokens are claimable.

This phase is designed for simple, repeatable participation on Ethereum Layer 2: low fees for tipping, quests, and compounding, ERC-20 compatibility for DeFi/Web3 integrations, and a clear path to claim by reconnecting the same wallet once distribution opens.

That mix, tiny costs, speed, and visible metrics, lets a meme token turn attention into daily behavior.

How LBRETT rewards early supporters

The wallet path is simple: connect MetaMask or Trust Wallet acquire LBRETT with ETH/USDT/BNB stake when claimable. Low fees make compounding feel real, not theoretical. Builders can add DeFi coin utilities, while users chase top gainer crypto moments as usage grows.

Tokenomics stay clean: fixed supply 10,000,000,000 with a roadmap that nods to future crypto governance and community incentives. It’s a Layer 2 crypto design aimed at repeat actions, not friction.

Solana is running but Layer Brett is grabbing eyeballs

Whales and traders still follow SOL’s long game, yet many rotate to mechanics that feel immediate. Layer Brett pairs Meme coin energy with rails that scale on Ethereum Layer 2.

In a crypto bull run 2025 backdrop, that’s the secret some screens tag as low cap crypto gems because usage, not slogans, drives the chart.

If daily actions keep stacking tips, quests, staking crypto, LBRETT can outpace majors on a percentage basis while SOL advances toward 2026. That’s the core pitch of a modern Memecoin with real rails.

Conclusion

SOL targeting $500 by 2026 is a credible multi-year build for those tracking Solana Price Prediction into the next cycle. The near-term sprint looks different.

Layer Brett https://layerbrett.com runs on Ethereum Layer 2, shows live metrics (price $0.0058, next step $0.0061, funding $4,427,265, rewards 592.29% at capture), and converts culture into repeatable on-chain actions.

If you rank opportunities by mechanics and momentum, LBRETT deserves a top slot on the watchlist. Ready to back rails that run at meme speed? Tap the panel, acquire a little LBRETT, and put those cents-level fees to work, tip, quest, and stake while the network is still early. When culture meets throughput, the first movers write the chart.

Secure LBRETT now, act fast before the next stage flips

For More Information:

Website: https://layerbrett.com

Telegram: https://t.me/layerbrett

X: https://x.com/LayerBrett

Disclaimer: This article is for informational purposes only and does not constitute financial advice. Cryptocurrency investments carry risk, including total loss of capital. Readers should conduct independent research and consult licensed advisors before making any financial decisions.

Crypto Press Release Distribution by https://btcpresswire.com

This release was published on openPR.

Source link

28 10, 2025

MATIC Price Prediction: Targeting $0.45-$0.55 Recovery Within 30 Days Despite Mixed Signals

By |2025-10-28T22:28:45+03:00October 28, 2025|Crypto News, News|0 Comments


Rongchai Wang
Oct 28, 2025 18:07

MATIC price prediction suggests potential recovery to $0.45-$0.55 range over next month, though bearish momentum and analyst disagreement create uncertainty for Polygon investors.


Polygon’s MATIC token finds itself at a critical juncture as October 2025 draws to a close, with the current price of $0.38 presenting both opportunity and risk for investors. Our comprehensive MATIC price prediction analysis reveals a complex technical landscape where short-term bearish momentum conflicts with potential medium-term recovery signals.

MATIC Price Prediction Summary

MATIC short-term target (1 week): $0.35-$0.40 (-7.9% to +5.3%)
Polygon medium-term forecast (1 month): $0.45-$0.55 range (+18% to +45%)
Key level to break for bullish continuation: $0.43 (SMA 20 resistance)
Critical support if bearish: $0.33 (strong support zone)

Recent Polygon Price Predictions from Analysts

The cryptocurrency analyst community shows remarkable divergence in their Polygon forecast assessments. Recent predictions span an extraordinary range, from conservative targets near $0.19 to ambitious projections exceeding $4.70.

Changelly’s MATIC price prediction of $0.196 by October 28, 2025, appears overly pessimistic given current support levels, while 30rates.com’s similar target of $0.1914 suggests these platforms may be overweighting recent bearish momentum. In stark contrast, PricePredictions.com offers a more optimistic MATIC price target of $0.804742, representing a potential 112% gain from current levels.

The most bullish Polygon forecast comes from LongForecast.com, projecting $4.762 by October 2025 – a staggering 1,153% increase that would require unprecedented market conditions. This wide prediction range reflects the inherent uncertainty in cryptocurrency markets and suggests investors should focus on technical indicators rather than rely solely on algorithmic forecasts.

MATIC Technical Analysis: Setting Up for Potential Reversal

Current Polygon technical analysis reveals a token caught between competing forces. The RSI reading of 38.00 sits in neutral territory but leans bearish, while the MACD histogram at -0.0045 confirms ongoing downward momentum. However, several factors suggest this bearish pressure may be weakening.

MATIC’s position within the Bollinger Bands at 0.29 indicates the token is trading in the lower portion of its recent range, often a precursor to mean reversion. The current price of $0.38 sits just above the lower Bollinger Band at $0.31, providing technical support that has held firm despite recent selling pressure.

Volume analysis from Binance shows $1,074,371 in 24-hour trading, which remains relatively subdued. This low volume environment suggests that any significant buying interest could quickly push MATIC higher, particularly if it breaks above the immediate resistance at $0.43.

The moving average structure presents a mixed picture for our MATIC price prediction. While the token trades below all major moving averages (SMA 20 at $0.43, SMA 50 at $0.45, SMA 200 at $0.69), the shorter-term averages are beginning to flatten, potentially signaling an end to the current downtrend.

Polygon Price Targets: Bull and Bear Scenarios

Bullish Case for MATIC

The primary bullish scenario for our Polygon forecast centers on a break above the SMA 20 resistance at $0.43. This level has acted as a ceiling for recent price action, and a decisive move higher would likely trigger momentum-based buying.

Our MATIC price target in the bullish scenario reaches $0.45-$0.50 initially, coinciding with the SMA 50 and psychological resistance. A sustained move above $0.50 could open the door to $0.55-$0.58, where stronger resistance awaits near the Bollinger Band upper boundary and previous support-turned-resistance levels.

For this bullish case to materialize, MATIC needs to see increased buying volume and improvement in momentum indicators. A RSI move above 50 and MACD histogram turning positive would provide confirmation of trend reversal.

Bearish Risk for Polygon

The bearish scenario remains a significant concern for our MATIC price prediction, particularly if the current support at $0.35 fails to hold. A break below this level would likely trigger stop-loss orders and could accelerate selling toward the $0.33 strong support zone.

Should $0.33 break, the next logical target aligns with some analyst predictions around $0.30-$0.31, coinciding with the lower Bollinger Band. This would represent a 21% decline from current levels and could validate the more pessimistic short-term forecasts from Changelly and 30rates.com.

The key risk factors include continued macro headwinds for risk assets, lack of positive developments in Polygon’s ecosystem, and persistent low trading volumes that could amplify any selling pressure.

Should You Buy MATIC Now? Entry Strategy

Our analysis suggests a cautious approach to MATIC positioning, with specific entry levels based on technical confirmation rather than attempting to catch a falling knife.

Conservative Entry Strategy: Wait for a confirmed break above $0.43 with increased volume before establishing positions. This approach reduces risk but may sacrifice some upside if the recovery is swift.

Aggressive Entry Strategy: Consider small positions near current levels ($0.38-$0.39) with strict stop-losses below $0.33. This higher-risk approach offers better reward potential but requires disciplined risk management.

Risk Management: Regardless of entry timing, position sizes should remain modest given the mixed technical signals. Stop-losses below $0.33 are essential, while profit-taking should begin near $0.50-$0.55 resistance levels.

For the question of whether to buy or sell MATIC, the current environment favors patient accumulation rather than aggressive positioning in either direction.

MATIC Price Prediction Conclusion

Our comprehensive MATIC price prediction suggests a medium-term recovery to the $0.45-$0.55 range within 30 days, representing potential gains of 18-45% from current levels. However, this Polygon forecast comes with medium confidence given the conflicting technical signals and analyst disagreement.

The key indicators to watch for confirmation include RSI movement above 50, MACD histogram turning positive, and most critically, a volume-supported break above the $0.43 resistance level. Invalidation of this bullish scenario would occur on a break below $0.33 support with sustained selling pressure.

Timeline expectations suggest that this MATIC price target scenario should begin materializing within 7-14 days if the technical setup is valid, with full realization expected by late November 2025. Investors should remain flexible and adjust positions based on how these key technical levels perform in the coming sessions.

Image source: Shutterstock


Source link

28 10, 2025

XRP Price Prediction – At $2.64, Ripple Holds Strong While Noomez

By |2025-10-28T20:27:23+03:00October 28, 2025|Crypto News, News|0 Comments

The XRP price prediction outlook has steadied as Ripple’s token hovers around $2.64, holding steady after a difficult quarter.

Analysts note a neutral tone across indicators, with sentiment balanced between caution and quiet accumulation.

While traders debate what is XRP price prediction 2025 amid cautious sentiment, Ripple’s institutional adoption and established liquidity seeking stability in a shifting market.

At the same time, a new project called Noomez ($NNZ) https://www.noomez.io is drawing attention for its live presale and structured, stage-based rollout, offering a data-driven contrast to established assets like XRP.

XRP Price Prediction Forecast and Market Overview

Analysts show a neutral setup: both the 50-day and 200-day moving averages are near current prices, and the Relative Strength Index (RSI) stays at 51.69, signaling a balanced market.

Short-term XRP predictions suggest the price could stabilize between $2.60 and $3.00 into November, with small percentage shifts reflecting consolidation rather than new breakouts.

This outlook shows the token’s maturity: while volatility remains part of its DNA, XRP crypto price prediction models indicate steady performance built on Ripple’s institutional adoption and established liquidity.

XRP Market Sentiment and Technical Signals

Ripple’s momentum stays stable, with signals showing neutral signs in the indicators.

Sentiment remains balanced, mirroring the technical levels. The RSI near 51.69 supports this, showing that XRP is neither overbought nor oversold, a setup often seen before moderate continuation moves.

This keeps XRP predictions in place for now, as analysts monitor its support levels at $2.60 and resistance levels near $3.00.

Long-Term XRP Outlook and 2030 Projections

Ripple’s long-term trend remains constructive, with XRP price prediction 2025 models averaging around $2.82. Analysts expect steady appreciation if institutional usage continues to expand.

By 2030, projections climb toward an average of $8.87, representing a potential 245% increase from current levels.

Some longer-range XRP predictions explore the question could XRP hit $20, though most view that as possible only under ideal liquidity and adoption growth.

As legacy assets consolidate, projects like Noomez https://www.noomez.io are quietly drawing attention for offering early-stage exposure through a structured, data-driven presale rather than secondary-market trading.

Why Noomez ($NNZ) Is Gaining Attention in the Market

With risk capital rotating back into early-stage projects, Noomez ($NNZ) has emerged as one of the few presales combining transparency, structure, and measurable progress.

The project features a fixed 280 billion token supply, with 50% (140 billion) allocated to its public presale, now live.

Each of the 28 stages lasts up to seven days, starting at $0.00001 and rising to $0.0028 by Stage 28, a 280× price curve for early buyers. Any unsold tokens are automatically burned after each stage, permanently reducing circulation.

Additional mechanics strengthen credibility:

● 15% liquidity lock once trading begins

● 6-12 month team vesting on the 5% allocation

● KYC-verified founders and fully audited contracts

● Noom Gauge showing real-time progress, burns, and supply data

● Two Noom Vault milestones (Stages 14 and 28) releasing reward airdrops

● A deflationary model ensuring every unsold token is removed from supply

This on-chain, rules-based system contrasts Ripple’s steady institutional model with a transparent, algorithmic rollout that appeals to traders seeking verified data and early-phase exposure rather than post-launch volatility.

Pro Tip: When evaluating projects at different stages like XRP and Noomez, focus on transparency and sustainability over hype.

How XRP and Noomez Reflect Two Market Phases

XRP’s growth outlook makes it appealing for investors who like consistency and an established market utility. Its projected climb to $8.87 by 2030 suggests a gradual appreciation as institutional usage expands.

By contrast, Noomez ($NNZ) https://www.noomez.io represents the early-stage, data-backed alternative, a project using transparent economics and automated burns to define value before trading even begins.

For traders weighing both sides, XRP represents reliability, while Noomez brings a data-driven approach to early-stage opportunity.

For More Information:

NNZ Official Website: https://www.noomez.io

Join NNZ Telegram Channel: https://t.me/NoomezOfficial

Follow NNZ on X (Formerly Twitter): https://x.com/NoomezOfficial

Disclaimer: This article is for informational purposes only and does not constitute financial advice. Cryptocurrency investments are highly volatile and involve significant risk, including the potential loss of principal. Always perform your own due diligence or consult a licensed financial advisor before making investment decisions.

Crypto Press Release Distribution by https://btcpresswire.com

This release was published on openPR.

Source link

28 10, 2025

$60M Outflows and $1B Treasury Push XRP Toward Key Breakout

By |2025-10-28T18:26:35+03:00October 28, 2025|Crypto News, News|0 Comments

  • XRP price today trades near $2.65 as buyers defend the $2.60 support zone.
  • Evernorth confirms $1B XRP treasury purchase, boosting institutional sentiment.
  • $60M in outflows and rising derivatives activity point to a $2.94 breakout test.

XRP price today trades near $2.65, gaining modestly after recent volatility as traders react to renewed institutional inflows and macro liquidity expectations. The token’s rebound follows confirmation that Evernorth, backed by Ripple, purchased over $1 billion worth of XRP to seed its new treasury platform.

Buyers Reclaim Mid-Fib Zone As Structure Turns Neutral

XRP Price Prediction (Source: TradingView)

The daily chart shows XRP price action attempting to reclaim the 0.5 Fibonacci retracement level at $2.72, a key midpoint from the summer rally to the $3.66 peak. The token has recovered sharply from its October low near $2.20, with the 20-day EMA at $2.68 providing a pivot for buyers to hold.

Immediate resistance sits between $2.73 and $2.94 — aligning with the 50% and 61.8% retracement zones and the descending trendline that caps the current structure. A decisive break above this pocket could open a path toward $3.26, the 0.786 retracement mark and the upper boundary of the wedge.

Related: Chainlink Price Prediction: Whales Accumulate as LINK Eyes a Bullish Reversal

Support remains firm around $2.56–$2.60, where both the 100-day EMA and ascending trendline converge. Losing this area could invite a deeper retest of $2.45, though broader sentiment appears to be stabilizing after heavy liquidation earlier this month.

Evernorth’s $1B Purchase Boosts Institutional Confidence

The Evernorth acquisition, confirmed by Coin Bureau, marks one of the largest single corporate accumulations of XRP in 2025. The firm now holds 388.7 million tokens, reinforcing Ripple’s expanding footprint in institutional payments and digital asset treasury solutions.

This announcement has significantly improved near-term sentiment, with traders interpreting it as validation of the XRP price prediction narrative that institutions continue to see value in XRP’s liquidity framework. The move also underscores Ripple’s ongoing strategy of expanding corporate adoption beyond remittances, aligning with its RLUSD stablecoin initiatives and partnerships across fintech and healthcare sectors.

Derivatives Data Points To Strengthening Long Interest

M Outflows and B Treasury Push XRP Toward Key Breakout
XRP Derivative Analysis (Source: Coinglass)

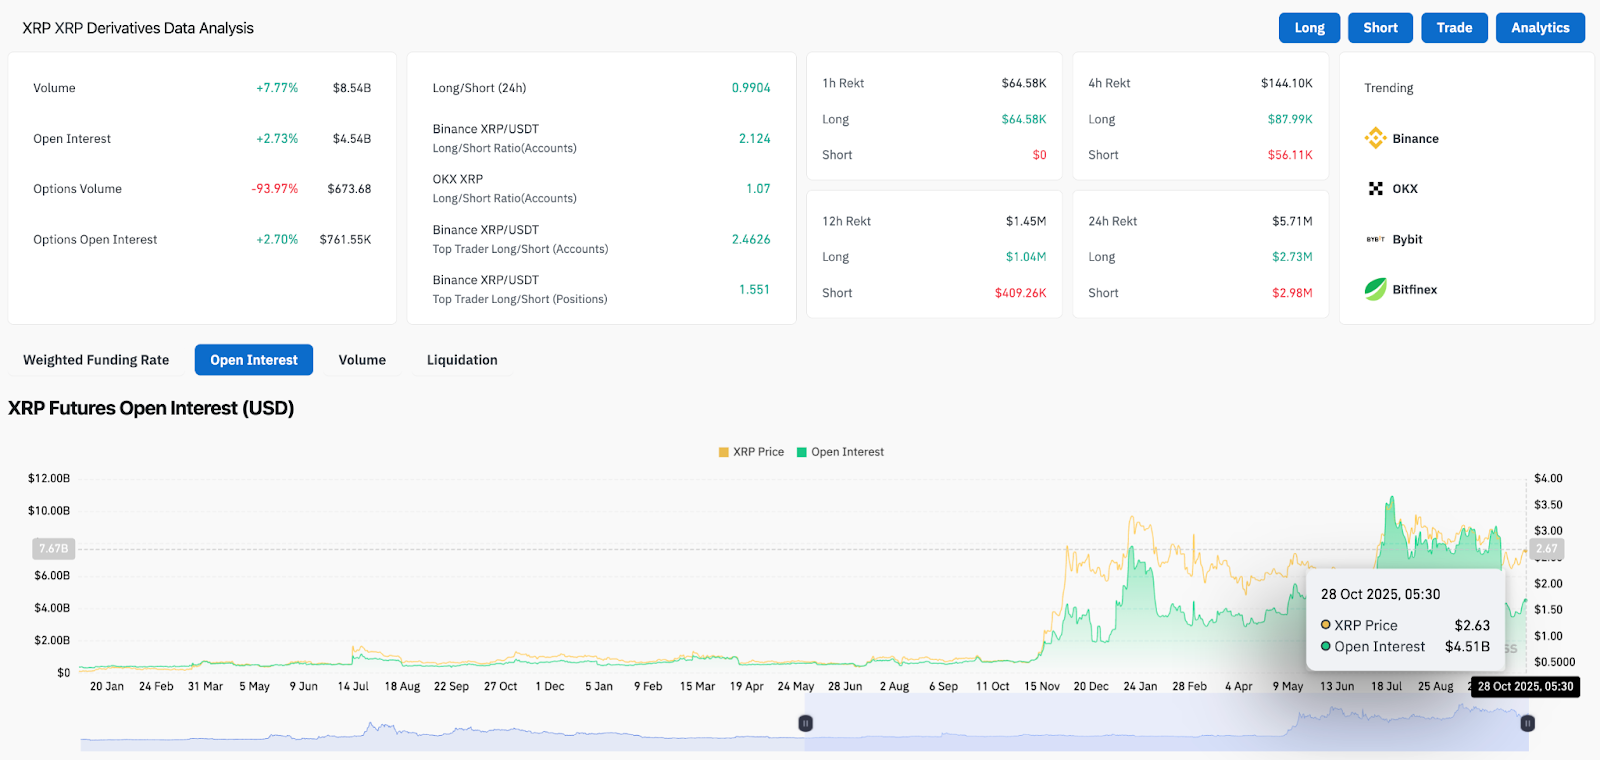
According to Coinglass derivatives data, open interest rose 2.7% to $4.54 billion, while futures volume climbed 7.8% to $8.54 billion. The long/short ratio remains balanced at 0.99, though Binance traders lean heavily long at 2.12, suggesting renewed speculative confidence.

Related: Hedera Price Prediction: HBAR Gains Investor Momentum as ETF Launch Nears

Funding rates have normalized after last week’s deleveraging, and options open interest also increased 2.7% to $761 million, indicating that volatility traders are re-engaging. These metrics suggest that positioning is shifting from defensive to neutral-bullish, particularly if XRP can confirm a break above the $2.72 pivot.

Exchange Flows Show Modest Outflows

XRP Netflows (Source: Coinglass)

Spot exchange netflows show a –$3.22 million outflow on October 28, extending a broader pattern of coins moving off exchanges this quarter. Historically, such mild outflows coincide with accumulation phases, as investors shift holdings to custody rather than liquidation.

Over the past month, cumulative outflows exceed $60 million, while price resilience near $2.60 implies that sellers are losing control. 

Outlook: Will XRP Go Up?

For now, the XRP price prediction remains cautiously bullish above $2.60. A close above $2.73 would confirm short-term breakout potential toward $2.94, followed by $3.26 if momentum accelerates.

Failure to hold the $2.56 support zone would weaken the setup and likely bring XRP back toward $2.40–$2.45, where deeper liquidity sits.

Given improving derivatives positioning, steady exchange outflows, and renewed institutional demand, the near-term bias tilts upward. The key test lies in whether buyers can push through the $2.72–$2.94 resistance band and sustain volume as macro liquidity improves post-Fed.

Related: Bitcoin Price Prediction: Fed QT Pause And Trump–Xi Summit Put $118K In Play

Disclaimer: The information presented in this article is for informational and educational purposes only. The article does not constitute financial advice or advice of any kind. Coin Edition is not responsible for any losses incurred as a result of the utilization of content, products, or services mentioned. Readers are advised to exercise caution before taking any action related to the company.


Source link

28 10, 2025

ADA Struggles Under $1 as Bitcoin

By |2025-10-28T16:25:47+03:00October 28, 2025|Crypto News, News|0 Comments

Cardano Price Prediction

ADA’s slow climb under the 1 dollar mark has turned into a patience test, and the crowd that once chased every update is getting selective. Many traders are rotating into clearer momentum plays until ADA proves it can defend higher lows with convincing volume.
In a market that prizes speed, tiny fees, and culture, talk is shifting toward Bitcoin Hyper (HYPER) (https://bitcoinhyper.com/) as traders scan for the best crypto to buy now that blends utility with momentum. HYPER’s focus on fast confirmations and straightforward incentives fits a landscape where responsiveness often beats complexity.

Cardano Price Prediction: Will ADA Finally Clear the $1 Barrier?

The 1 dollar region is a psychological ceiling and a liquidity pocket. Recent pushes have faded before volume could compound, so bulls want to see higher lows hold and a decisive close above resistance. If you are checking structure in real time, compare price action and depth on ADA’s page at https://coinmarketcap.com/currencies/cardano/ and watch how pullbacks behave once momentum kicks in.

For a quick market pulse during volatility, many traders watch broad moves and relative strength to judge whether ADA’s breakout attempts align with risk-on conditions or face headwinds. They also track volume surges and order book depth as a fast proxy for genuine follow-through.

Bitcoin Hyper Prioritizes Speed With Straightforward Staking

Bitcoin Hyper (https://bitcoinhyper.com/) takes a simple approach built for daily use: keep transactions fast and inexpensive even when traffic jumps, then back that with clear, straightforward rewards that encourage participation. This helps keep throughput steady during peak periods and reduces friction for everyday transactions.

The result is a product feel that favors responsiveness over complexity, making it easier for newcomers to onboard while giving active users the snappy experience they expect. By minimizing steps and making incentives transparent, it shortens the path from first interaction to consistent engagement.

Why ADA Holders Are Eyeing Bitcoin Hyper in 2025

Throughput and cost control: Fast confirmations and low fees fit active trading, micro-payments, and on-chain social activity.

Community momentum: Meme-aware branding shortens discovery cycles, which can help with listings, liquidity, and tighter spreads.

Utility plus incentives: Practical features paired with rewards create a loop that keeps users engaged beyond one headline.

Simple UX: Smooth flows reduce friction, which often matters more than niche features when markets move quickly.

Final Verdict

Cardano’s path back to 1 dollar remains open, but conviction requires a breakout that sticks with sustained participation. Until that print arrives, traders searching for the best crypto to buy now will weigh alternatives that feel faster and more engaging, with Bitcoin Hyper (https://bitcoinhyper.com/) standing out for low-friction transactions and community-driven incentives.

If you prefer additional context on ranges and historical swings while you track ADA, the overview at https://www.coingecko.com/en/coins/cardano

can help you gauge whether momentum has room to extend.

Buchenweg 15, Karlsruhe, Germany

For more information about Bitcoin Hyper (HYPER) visit the links below:

Website: https://bitcoinhyper.com/

Whitepaper: https://bitcoinhyper.com/assets/documents/whitepaper.pdf

Telegram: https://t.me/btchyperz

Twitter/X: https://x.com/BTC_Hyper2

Disclosure: Crypto is a high-risk asset class. This article is provided for informational purposes and does not constitute investment advice.

CryptoTimes24 is a digital media and analytics platform dedicated to providing timely, accurate, and insightful information about the cryptocurrency and blockchain industry. The enterprise focuses on delivering high-quality news coverage, market analysis, project reviews, and educational resources for both investors and enthusiasts. By combining data-driven journalism with expert commentary, CryptoTimes24 aims to become a trusted global source for emerging trends in decentralized finance (DeFi), NFTs, Web3 technologies, and digital asset markets.

This release was published on openPR.

Source link

Go to Top