The main tag of Cryptocurrency price Articles.
You can use the search box below to find what you need.
[wd_asp id=1]
The main tag of Cryptocurrency price Articles.
You can use the search box below to find what you need.
[wd_asp id=1]
Crypto analyst Balo has assured that the Dogecoin price rally to a new all-time high (ATH) above $0.74 is in the works. He explained why this rally may be closer than some may imagine despite the recent bearish price action.
Dogecoin Price Eyes Rally Above $0.74 ATH
In an X post, crypto analyst Balo shared an accompanying chart showing that the Dogecoin price could surpass its current all-time high of $0.74, reaching $0.8 in the process. This came as the analyst opined that a major run was imminent for the foremost meme coin, despite its current downtrend.
Balo explained that at each local bottom since early 2024, there has always been a “messy” Dogecoin price action that looks designed to shake people out before the real jump. He added that DOGE has made higher lows and maintained the higher-timeframe (HTF) trend, and that the same price pattern appears to be repeating now.
The crypto analyst also admitted that the parabolic surge for the Dogecoin price may feel far away, but that each mini cycle brings DOGE closer to its bull run. He also stated that this gives investors more time to accumulate before the DOGE price rallies to a new all-time high, which he claimed is just a matter of time.
This bullish prediction for the Dogecoin price comes amid its current downtrend, with the meme coin struggling below the psychological $0.2 level. DOGE has continued to mirror Bitcoin’s price action, and with the flagship crypto threatening to drop below $100,000 again, crypto analyst Dogecoin OG predicts that the meme coin could fall to the $0.16 range.
Analyst Predicts Mega Run For DOGE
Crypto analyst Crypto Patel has also provided a bullish outlook for the Dogecoin price, declaring that the meme coin was ready for its next historic mega run. The analyst stated that the breakout and retest are complete and that the structure is locked and loaded for a parabolic explosion.
Furthermore, Crypto Patel revealed that the same pattern that sent the Dogecoin price flying during the 2017 and 2021 bull cycles is repeating again on the monthly timeframe. He added that the move looks even more powerful this time around. As such, he expects DOGE to rally 10x to 33x based on the fractal confluence and macro breakout structure.
Patel stated that targets 1 and 2 are $2 and $5, respectively, both of which mark new ATHs for the meme coin. His accompanying chart showed that the Dogecoin price could reach these targets sometime next year.
At the time of writing, the Dogecoin price is trading at around $0.17, down over 4% in the last 24 hours, according to data from CoinMarketCap.
Cardano price is holding firm near the $0.50 support, with participants eyeing a potential reversal as momentum indicators start to turn in favor of the bulls.
A surge of quiet accumulation is starting to surface around Cardano’s $0.50 zone, where price action has repeatedly attracted long-term holders. The stability at this level is drawing fresh optimism, with several participants noting early signs of reversal momentum.
Cardano appears to be approaching a potential bullish reversal as price tests the descending trendline that has capped every rally since early 2024. The chart shared by Rand shows ADA Cardano price is forming a possible base around the $0.50 region. A confirmed push above resistance could now flip market sentiment from bearish to bullish.
ADA holds steady near the $0.50 zone, signaling potential accumulation as traders watch for a breakout confirmation. Source: Rand via X
The key support remains around $0.53 to $0.50, a region that has repeatedly held through prior shakeouts. If the structure holds and volume begins to expand, Cardano price could be gearing up for a mid-cycle reversal, setting the stage for higher highs over the coming days.
Waleed Ahmed’s broader timeframe analysis suggests that ADA’s long-term structure remains intact within a massive accumulation box. The range between $0.59 and $0.62 continues to serve as a consolidation base, while the upper boundary near $3.10 represents the major cycle top where price could head next.
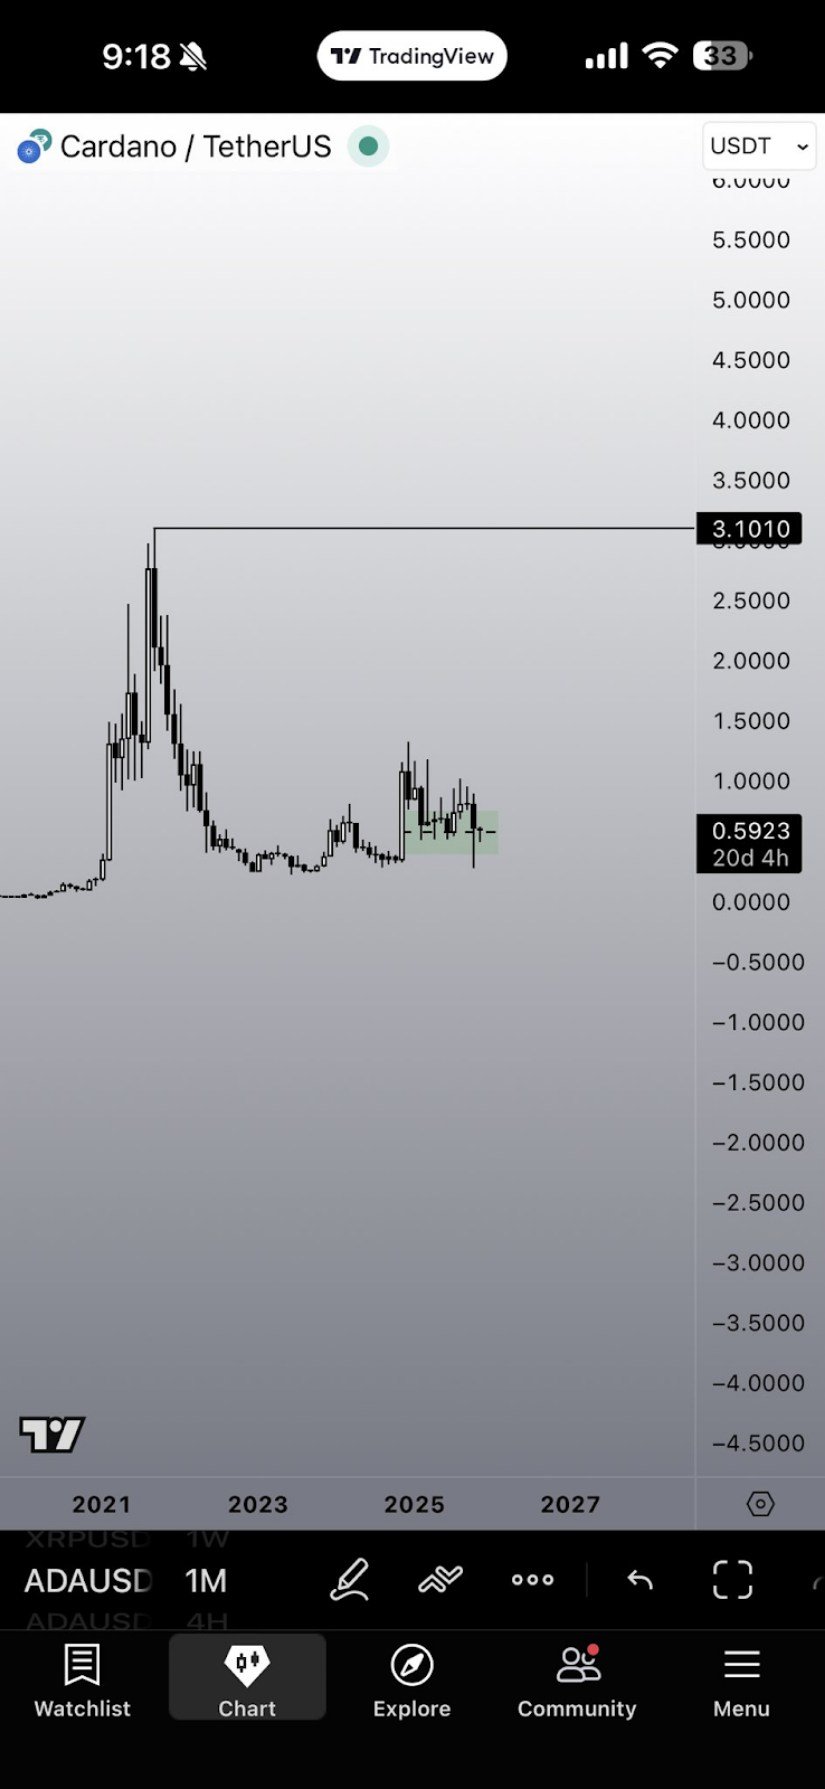
Cardano price continues to trade within a broad accumulation range, hinting at a potential long-term breakout towards the $3.00 cycle top. Source: Waleed Ahmed via X
If ADA can hold its mid-range support and break above $0.80–$1.00, it could initiate a multi-month rally similar to past expansion cycles. This accumulation behavior, visible in the weekly structure, implies that Cardano price may be preparing for a strong macro move if broader market momentum aligns.
The DApp Analyst’s seasonal data adds weight to the bullish outlook, showing that ADA has spent nearly a year consolidating within the $0.50–$1.30 range. Historically, such long periods of compression have preceded strong expansions in prior cycles.
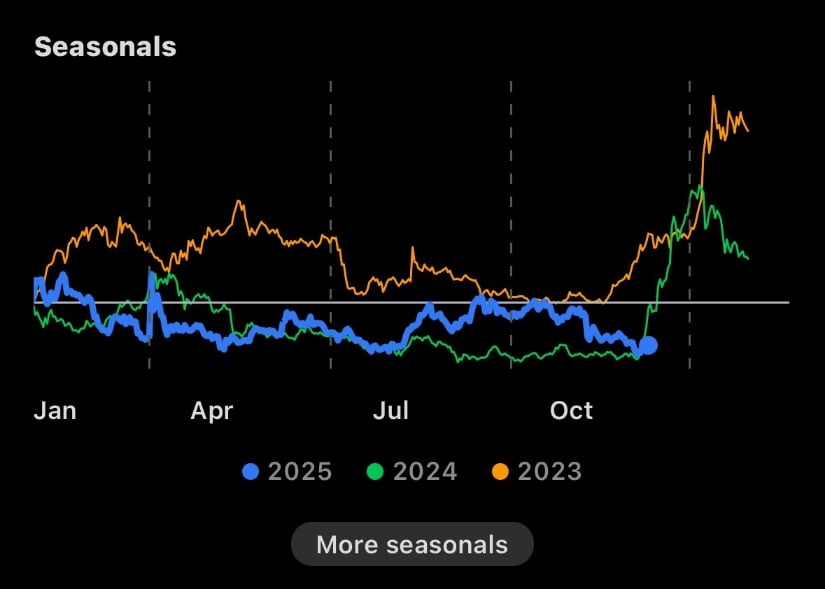
ADA nears a Q4 breakout as seasonal data signals a potential end to its year-long consolidation. Source: The DApp Analyst via X
As seasonal trends align, the historical performance charts for 2023 and 2024 suggest that ADA typically sees acceleration in late Q4, followed by sustained strength through Q1. If this pattern repeats, ADA could soon see the long-awaited breakout, positioning it for a more decisive trend shift into 2026.
Cardano is currently testing the lower boundary of its trading band as noted by Trend Rider’s setup. The chart highlights a key threshold at $0.70, which needs to be reclaimed to confirm short-term trend reversal. ADA is hovering near the 0.59 support, resting on the lower edge of the RiderAlgo band, a level that has previously triggered bullish rebounds.

Cardano price tests key support near $0.59, with indicators hinting at a possible short-term bullish reversal. Source: Trend Rider via X
Momentum indicators show exhaustion among sellers, while price remains compressed under the VWAP and EMA cluster. A breakout above $0.64 to $0.70 could flip local structure back to bullish, targeting the $0.85 to $0.90 zone in the near term.
Cardano’s chart structure continues to mature as price repeatedly defends its key supports while forming higher lows on longer timeframes. Technical alignment across multiple market watchers pointing towards a growing possibility of reversal, with confluence around the $0.65–$0.70 zone acting as the pivot for confirmation.
If ADA sustains momentum above that resistance, the path toward $1.00 and beyond becomes clearer. With seasonal strength approaching and structural compression nearly complete, the next few weeks could be bullish for Cardano Price Prediction.
XRP could surge 150% to $6 in the next five years due to the likely approval of spot XRP ETFs.
XRP (XRP 1.77%) is the fourth-most valuable cryptocurrency, with a market value of $145 billion. It currently trades at $2.40, but Geoffrey Kendrick at Standard Chartered anticipates big gains in the coming years, due in large part to the potential approval of spot XRP ETFs. He recently set his 2028 target price at $12.50, which implies annual returns of 73%.
However, Morningstar analysts estimate the entire cryptocurrency market will expand at 10% annually during the next several years. That forecast is sensible, but I think XRP will perform better than the broader market: I predict the altcoin will return 20% annually to reach $6 by 2030. That implies 150% upside from where it trades today.
Here’s what investors should know.
Image source: Getty Images.
Ripple is a fintech company that uses XRP and its blockchain (the XRP Ledger) to help payment service providers and other businesses move money across borders. The SWIFT (Society for Worldwide Interbank Financial Telecommunications) system is currently the industry standard where wire transfers are concerned, but transactions can take days to settle and often incur high fees because they are routed through multiple intermediaries.
Ripple solves those problems by using XRP as a bridge currency. Transactions not only settle within seconds, but also cost a fraction of a cent. In June, CEO Brad Garlinghouse predicted XRP would capture 14% of SWIFT payment volume within five years, in which case more than $20 trillion would flow through the XRP Ledger annually.
That seems wildly optimistic. Using a volatile cryptocurrency like XRP as a bridge currency to move money introduces unnecessary risk. Ripple has added the stablecoin RLUSD to its payments ecosystem to address that problem, but that new product faces tough competition from more entrenched stablecoins like USD Coin by Circle Internet Group.
XRP transaction volume, which is a roundabout measure of demand for the cryptocurrency, has steadily declined throughout 2025. That hints at waning interest, and I seriously doubt a significant number of enterprises will adopt XRP payments in the future. Investors should expect very little from this potential catalyst.
The U.S. Securities and Exchange Commission (SEC) was set to approve several spot XRP ETFs in October. The process was delayed due to the government shutdown, but approval is now anticipated in November or December. Those investment products would provide direct exposure to XRP without the hassle and high fees associated with traditional cryptocurrency exchanges.
Eliminating those pain points could unlock demand among retail investors and, more importantly, institutional investors that control about $130 trillion in assets under management. Canary Capital CEO Steven McClurg estimates spot XRP ETFs will draw inflows totaling $5 billion in their first month on the market. That seem too ambitious, given the launch of spot ETFs for Bitcoin drew just $4 billion during their first month, but I agree in principle: Spot XRP ETFs should boost demand.
Bitcoin prices have increased 127% since the SEC approved the first spot Bitcoin ETFs in January 2024. So, it seems reasonable that XRP could see similar price appreciation over the next five years. That’s why I think the altcoin can increase 150% to $6 by 2030.
However, investors must always remember that cryptocurrencies tend to be volatile assets. For instance, XRP declined more than 20% from a record high five times in the last three years alone, and the altcoin is nearly 30% off its high today. Similar volatility is likely in the future. Investors who can’t handle price swings of that magnitude should steer clear.
Risk Warning: this article represents only the author’s views and is for reference only. It does not constitute investment advice or financial guidance, nor does it represent the stance of the Markets.com platform.When considering shares, indices, forex (foreign exchange) and commodities for trading and price predictions, remember that trading CFDs involves a significant degree of risk and could result in capital loss.Past performance is not indicative of any future results. This information is provided for informative purposes only and should not be construed to be investment advice. Trading cryptocurrency CFDs and spread bets is restricted for all UK retail clients.
The development of Mutuum Finance appears to be on track, as the first version of the lending and borrowing protocol is slated for launch on Sepolia testnet within the current quarter. The first version launch will enable the essential DeFi features, such as collateral lending, borrowing, as well as the creation of yields. The fact that the testnet has been successfully implemented is a huge step towards creating a fully functional, self-regulating, and decentralized environment. The project has gained immense popularity, a huge following, and has achieved several development milestones, putting Mutuum Finance on the top of the list as one of the pioneers in DeFi, offering investors an opportunity to own the best crypto to buy and positioning it as the next crypto to explode for long-term gains.
Mutuum Finance has raised over $18.58 million from 17,850+ investors, while Phase 6 is nearly sold out, having surpassed 85% sales, at a token price of $0.035. The lending, leverage, and risk management system, along with staking rewards, as well as the impending Sepolia testnet, provides MUTM a clear use case in DeFi. Another chance to buy tokens, as adoption begins, is available as it enters Phase 7, which boosts the token price to $0.04.
Take action today to be a part of the presale in Mutuum Finance, positioning yourself for strong potential returns in the future crypto market cycle, as it continues to be the next crypto to explode and the best crypto to buy in 2025.
Today, XRP has taken a notable downturn with a price decline of over 3%, raising concerns among investors. The cryptocurrency’s current value stands at $2.3977, a drop influenced by increased selling pressure and market uncertainty. With Ripple’s trading volume exceeding 4.2 billion, market dynamics play a critical role in today’s development. Let’s examine the factors driving this decline and what this means for investors.
The main cause behind XRP’s price decline today is increased selling pressure. With a change percentage standing at -5.09%, many investors seem to be offloading their holdings. This aligns with the enhanced trading volume of over 4.2 billion, which is above average compared to previous activity levels. The prior day’s close was $2.52634, and it opened today slightly lower at $2.39142. Such movements suggest a lack of bullish sentiment at present. More on this decline here. Analyzing the technical indicators like the ADX at 41.39 confirms a strong trend, but it’s currently in a bearish zone. This shows that sellers are dominant in the current market landscape.
XRP’s market dynamics reveal interesting trends. With a Year-To-Date change of +5.49%, the cryptocurrency has displayed overall growth. However, the recent 3-month decline of -21.52% highlights short-term volatility concerns. Factors stirring such dynamics include global market sentiment, regulatory discussions around Ripple, and broader crypto market movements. Despite predictions indicating positive growth targets, this immediate pressure raises red flags for risk-averse investors. Given the recorded RSI of 52.03, XRP is not in oversold territory, but it also lacks significant upward momentum.
Ripple’s trading volume today provides insight into current market sentiment. With a hefty volume of over 4.2 billion XRP traded, it’s evident that the market is active, though heavily leaning towards selling. Comparing this with the average volume of about 6 billion, today’s figures suggest a minor retreat in market interest, possibly due to upcoming regulatory updates or changes in market perception. With no recent earnings announcements or major news from Ripple, external factors seem to be swaying investor actions.
Today’s decline in XRP’s price raises important considerations for investors. While the short-term volatility may concern some, the long-term outlook shows potential. Forecasts anticipate significant growth over the coming years, with projected 5-year targets reaching nearly $11.22. This suggests entry points may be advantageous for those with a high tolerance for risk. Monitoring further market signals and Ripple developments will be key. Utilizing platforms like Meyka can offer real-time insights and predictive analytics to better navigate these shifts, ensuring informed decision-making amidst market turbulence.
XRP’s price dropped more than 3% due to increased selling pressure and overall market uncertainty, leading to heightened investor concerns about future volatility.
Today’s trading volume exceeds 4.2 billion, revealing active market participation but with a bearish tilt, affecting confidence and price stability in the short term.
Despite current declines, forecasts show optimistic growth for XRP, with 5-year price targets nearing $11.22, indicating strong long-term potential for patient investors.
Disclaimer:
The content shared by Meyka AI PTY LTD is solely for research and informational purposes.
Meyka is not a financial advisory service, and the information provided should not be considered investment or trading advice.
Cardano is back in the conversation as major-cap liquidity starts to rotate and headlines pile up. The network just crossed 115 million total transactions on-chain, underscoring steady user activity even during quieter price stretches. Market summaries keep noting how buyers consistently defend key support levels, hinting that traders are still positioning for rebound setups. Some investors are balancing their exposure by pairing ADA with Bitcoin Hyper (HYPER) (https://bitcoinhyper.com/), a payments-driven project that adds a different angle to portfolio narratives. For a real-time look at how ADA is performing, live metrics are available on CoinMarketCap’s Cardano dashboard: https://coinmarketcap.com/currencies/cardano/.
Cardano Network Momentum Crosses 115 Million Transactions
Cardano’s network activity continues to expand, recently passing the 115 million transaction mark-a major milestone proving that demand has remained steady through several market phases. On-chain data shows consistent engagement across dApps and wallets, even during price dips. Market watchers note that ADA continues to find reliable support near $0.64, where buying volume consistently rises. Resistance is stacked between $0.74 and $0.77, leaving traders watching these zones closely for signs of breakout or rejection as volatility slowly returns.
Key Levels Shape the Next ADA Price Outlook
The price structure for Cardano remains technical and disciplined. Holding above $0.64 is seen as the first test for bulls, while reclaiming $0.68 and $0.70 could reopen the path toward $0.77, where prior rallies met resistance. A breakout above that zone could place $0.85 in sight again, potentially signaling a stronger recovery phase. Losing $0.64, on the other hand, risks a dip toward $0.59 before fresh bids appear. Analysts agree that rising volume-rather than isolated candles-will confirm the next meaningful shift.
Bitcoin Hyper and Cardano: Dual Forces in the Crypto Market
While Cardano focuses on smart-contract scalability and developer growth, Bitcoin Hyper (HYPER) (https://bitcoinhyper.com/) is building its identity around payments and real-world settlement. The project’s approach to merchant tools, wallet performance, and API integration offers investors a contrasting but complementary story to ADA’s long-game infrastructure. Pairing the two creates a strategic balance: ADA’s slow-and-steady builder arc alongside HYPER’s fast-moving payments ecosystem. Together, they reflect how blockchain diversification can strengthen portfolio exposure across different utility layers of the crypto economy.
Cardano’s Sleeper Potential Through 2025
ADA’s technical map still reads like a slow-burn setup. Holding $0.64 and breaking $0.70 with conviction could reopen a move toward $0.77, with $0.85 next if momentum sustains. Traders expect more clarity as volume picks up and broader market liquidity rotates into strong majors. For investors seeking synergy between utility and stability, tracking both ADA’s base-building and HYPER’s merchant integration progress provides a more complete picture of how innovation cycles may unfold into 2025.
Buchenweg, Karlsruhe, Germany
For more information about Bitcoin Hyper (HYPER) visit the links below:
Website: https://bitcoinhyper.com/
Whitepaper: https://bitcoinhyper.com/assets/documents/whitepaper.pdf
Telegram: https://t.me/btchyperz
Twitter/X: https://x.com/BTC_Hyper2
Disclosure: Crypto is a high-risk asset class. This article is provided for informational purposes and does not constitute investment advice.
CryptoTimes24 is a digital media and analytics platform dedicated to providing timely, accurate, and insightful information about the cryptocurrency and blockchain industry. The enterprise focuses on delivering high-quality news coverage, market analysis, project reviews, and educational resources for both investors and enthusiasts. By combining data-driven journalism with expert commentary, CryptoTimes24 aims to become a trusted global source for emerging trends in decentralized finance (DeFi), NFTs, Web3 technologies, and digital asset markets.
This release was published on openPR.
Ripple’s XRP has ignited fresh excitement across the crypto market, as renewed whale accumulation and ETF speculation fuel talk of a powerful next leg higher.
After months of consolidation, XRP’s sharp breakout above key resistance has revived investor optimism. Traders now question whether this surge signals the start of a broader bullish phase or merely another short-lived rally. With large holders returning and institutional attention mounting, the stage appears set for a decisive move in one of crypto’s most-watched assets.
The XRP price is once again in the spotlight after a notable surge in large-holder activity fueled optimism about a potential new rally. On November 10, 2025, Ripple’s XRP jumped over 12%, reaching $2.55, as on-chain data revealed more than $550 million in whale accumulation within just a few days. This renewed demand from institutional and high-net-worth investors has reignited bullish discussions around the XRP price prediction for 2025, especially as speculation over a potential XRP ETF approval continues to grow.
Significant whale-level XRP transfers signal heightened liquidity activity, suggesting a major market move may be imminent. Source: XRP Update via X
Market data from Binance charts indicates that XRP has successfully broken above the $2.50 resistance zone for the first time in several weeks. The move was supported by strong buying volume and positive momentum indicators, including an RSI reading of 65 and an expanding MACD histogram—both signaling sustained bullish strength. A one-day chart projection shows a potential continuation pattern that could target the $3.96 resistance area in the near term.
Investor excitement over Ripple’s legal clarity following its SEC lawsuit, which was partially resolved earlier in 2025, has paved the way for institutional re-entry. Analysts now estimate that the probability of a Grayscale XRP ETF or a similar product being approved by mid-November is near 95%, according to several market-tracking platforms.
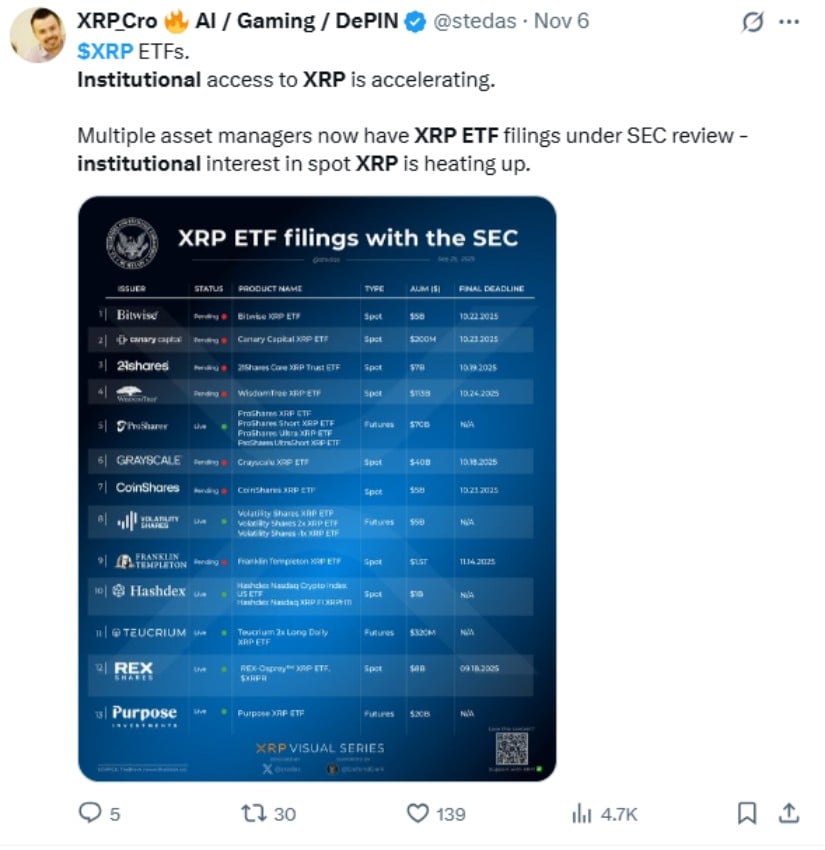
Institutional interest in XRP is rising as multiple asset managers file spot XRP ETFs for SEC approval. Source: XRP Cro AI / Gaming / De via X
Such an approval could mark a turning point for XRP crypto price performance by unlocking regulated investment avenues for large funds and hedge managers previously sidelined due to legal uncertainty.
Institutional demand is expected to be the key driver for XRP’s next growth phase, with whale accumulation indicating early positioning ahead of broader ETF adoption, according to market analysis reported by CoinPaper.
Technical indicators show XRP consolidating above key support levels between $2.40 and $2.50, suggesting a healthy structure after recent gains. Traders are closely watching whether XRP can maintain momentum beyond the immediate $2.65 resistance, a level that could determine the short-term trajectory.
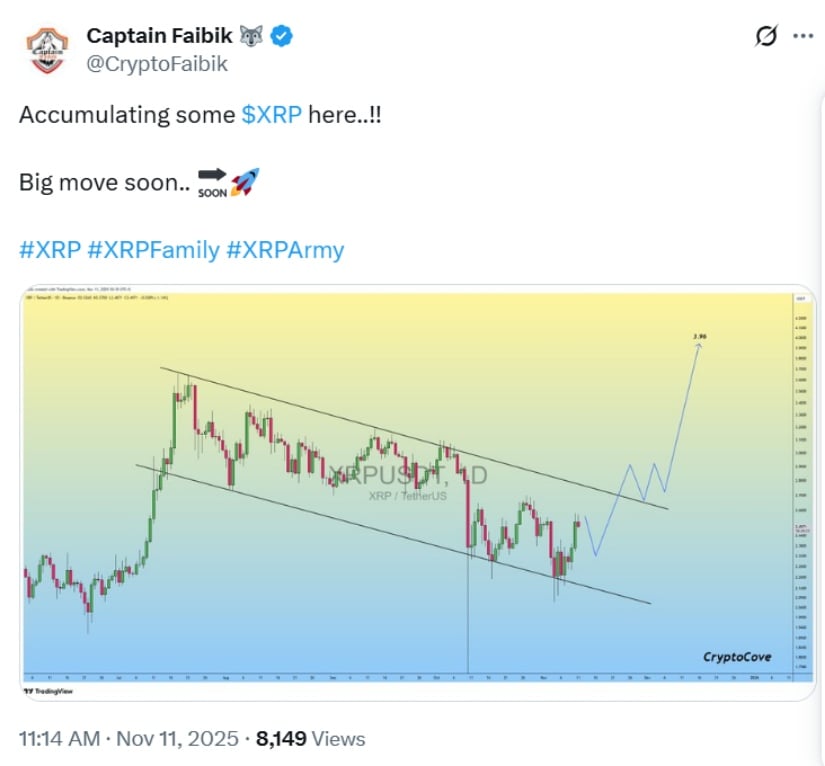
Trader signals accumulation of XRP ahead of a potential significant price movement. Source: Captain Faibik via X
A clear breakout above that point could propel XRP toward $3.00–$3.96, where historical selling pressure may re-emerge. On the other hand, a failed attempt might lead to a short-term correction toward $2.30, aligning with the 50-day moving average support.
Crypto analyst CryptoFaibik, who has followed XRP coin price trends since 2017, remarked on social media, “Accumulating some XRP here… big move soon.” His post gained significant traction within the XRPArmy community, reflecting rising retail enthusiasm alongside whale confidence.
Beyond technicals, macro factors remain supportive. Bitcoin dominance has begun to soften, often a sign of renewed altcoin momentum. Ripple’s ongoing push for banking partnerships in Asia and the Middle East, especially through RippleNet and cross-border payment solutions, continues to add fundamental strength.
Meanwhile, the current XRP price stays below the high set in July 2025 at approximately $2.85, suggesting that there is further upside potential if all bullish stars align. Yet, analysts advise caution and say sustained rallies will rely on the crypto market’s general sentiment and inflow consistency.
If whale accumulation continues and ETF speculation comes to life, XRP may enter a robust uptrend that extends towards the $14 target area, a move of over 450% from present prices. This scenario is optimistic, but it also corresponds with long-term XRP price models that consider institutional adoption and increased liquidity via the offering of exchange-traded products.
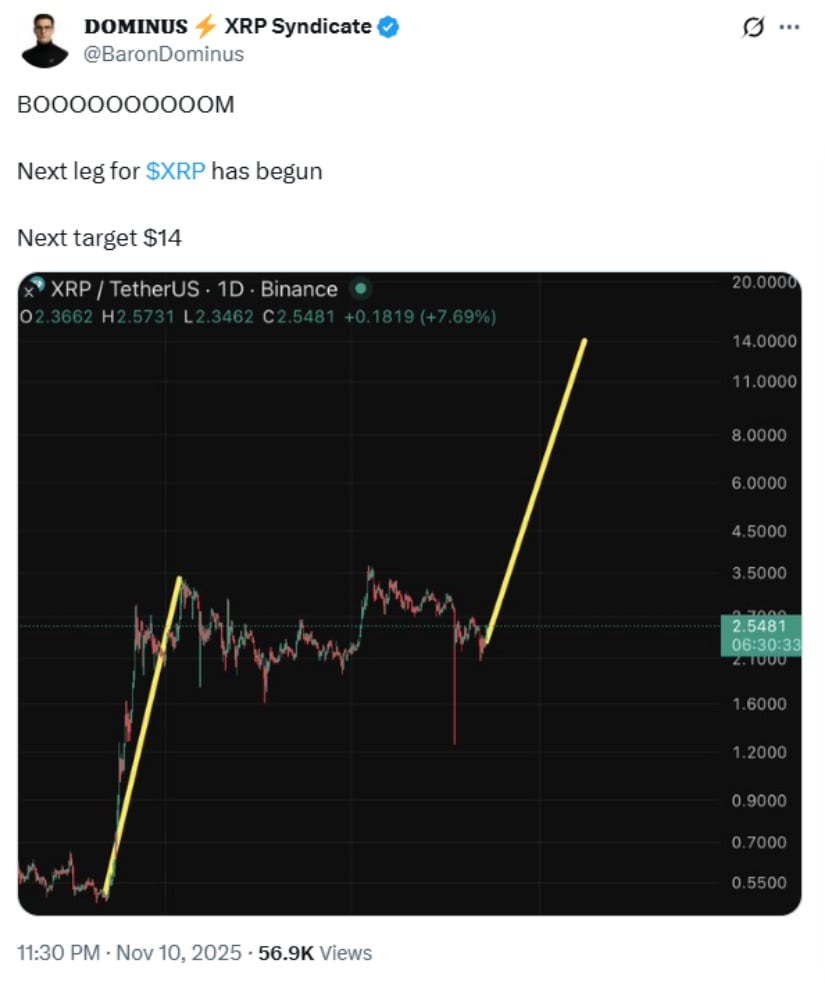
XRP kicks off its next bullish phase, with analysts eyeing a potential target of $14. Source: 𝐃𝐎𝐌𝐈𝐍𝐔𝐒 via X
But analysts warn that such lofty valuations depend upon favorable market conditions and regulatory clarity. Any renewed legal challenges from the case of SEC vs. Ripple or macroeconomic tightening could dampen sentiment, thus slowing XRP’s climb.
The price of XRP today reflects a market on the verge of a possible breakout. Massive whale accumulation, improving technical structure, and growing ETF anticipation are converging to create an environment ripe for volatility—and opportunity.
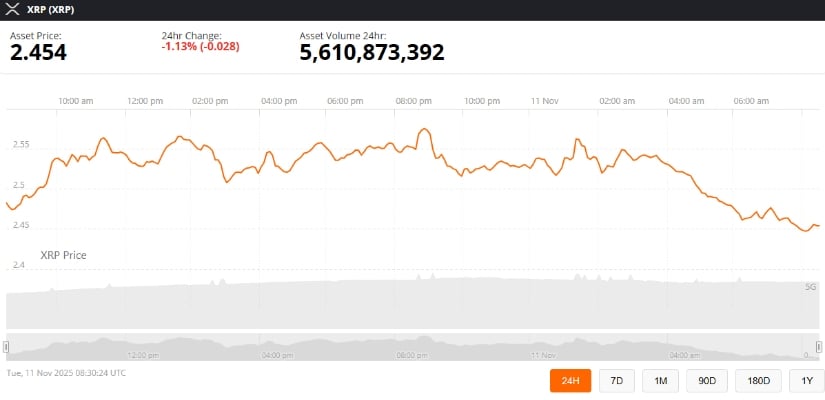
XRP was trading at around 2.45, down 1.13% in the last 24 hours at press time. Source: Brave New Coin
If XRP maintains momentum above $2.60 and institutional interest continues to expand, the path toward the $3.96–$14 range may gradually unfold in the months ahead. Still, with such ambitious XRP price targets, investors are reminded that crypto remains speculative by nature.
Dogecoin is once again stealing the spotlight as traders eye a potential breakout from its ascending triangle pattern—a move that could send prices soaring toward the $1 mark.
After weeks of consolidation, the popular meme-inspired cryptocurrency is showing renewed bullish momentum, trading near $0.18 following a 6% daily surge. Analysts believe Dogecoin’s technical setup, combined with growing whale activity and speculation over a possible ETF listing, could ignite one of its strongest rallies since early 2021.
Dogecoin (DOGE) has once again captured traders’ attention as it forms an ascending triangle pattern, a structure that often precedes strong bullish breakouts. The coin has been consolidating above the $0.18 level, rebounding sharply after touching that support earlier this week. This upward momentum suggests that Dogecoin’s price may be preparing for a move toward the key resistance at $0.23 — a breakout point that could define its short-term and long-term trajectory.
As of November 10, 2025, Dogecoin trades around $0.18, marking a 6% intraday gain amid renewed optimism. Analysts are closely watching this level, as holding above the rising support trendline could trigger a rebound toward $0.29 in the short term. Some long-term projections even point to a possible surge toward the $1 mark if bullish volume accelerates once $0.23 is breached.
The ascending triangle is one of the most widely recognized bullish continuation patterns in technical analysis. It typically forms when an asset’s price creates a series of higher lows while repeatedly testing a horizontal resistance zone. This tightening price action reflects growing buyer confidence, often leading to a breakout once sellers at the resistance level are exhausted.
Dogecoin ($DOGE) is holding strong above key support, with potential upside targets at $0.29, $0.57, and $1. Source: @CRYPTOMOJO_TA via X
For Dogecoin, the resistance near $0.23 has proven difficult to break in recent months. However, each bounce from the $0.18 support trendline strengthens the bullish case. If Dogecoin’s price manages to close above this resistance with increased trading volume, it would confirm the breakout and potentially set the stage for a substantial rally. The short-term Dogecoin price prediction points to a possible target of $0.29, while the long-term outlook suggests upside potential up to $1 based on historical breakout measurements.
Beyond chart patterns, external factors may act as catalysts for Dogecoin’s next big move. Speculation surrounding a potential Bitwise DOGE ETF has fueled optimism in the community, with traders believing such a development could attract institutional interest. Large holders, or “whales,” have also been reportedly accumulating DOGE, hinting at growing confidence in the asset’s near-term prospects.
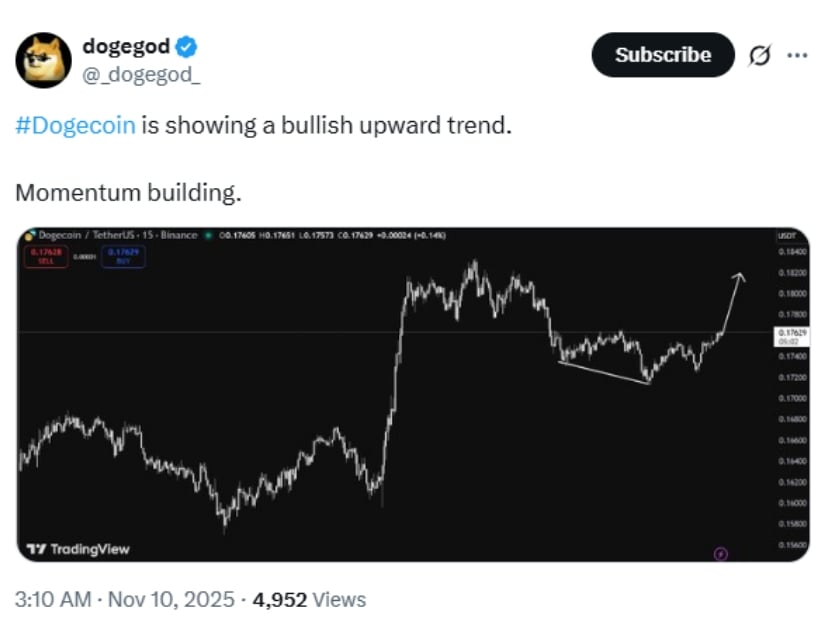
Dogecoin is gaining bullish momentum as its upward trend strengthens. Source: @_dogegod_ via X
Additionally, Dogecoin continues to maintain a high correlation with Bitcoin’s price movements, often amplifying market sentiment by two to three times. This means any renewed bullish phase in the broader crypto market could have an outsized effect on Dogecoin’s trajectory. However, analysts caution that low trading volumes remain a challenge, as sustained participation from both retail and institutional traders will be necessary to confirm the next leg higher.
The question on many traders’ minds remains: will Dogecoin reach $1? Technically, the setup supports the possibility, but the breakout must first be validated above the $0.23 resistance. A successful close above this level could pave the way for a gradual rise toward $0.29, and later, a potential test of the $1 mark if momentum continues into 2026.
However, failure to maintain support near $0.18 could undermine the bullish thesis, leading to another period of sideways movement. Market participants will also be watching for broader Dogecoin news updates, including regulatory developments or endorsements from influential figures like Elon Musk, which have historically driven strong rallies.
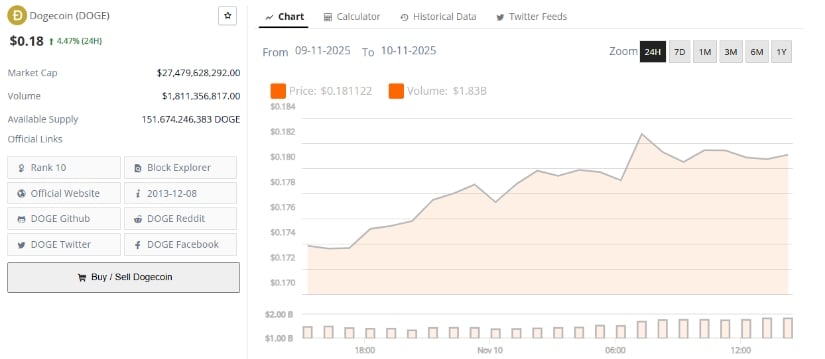
Dogecoin was trading at around $0.18, up 4.47% in the last 24 hours. Source: Brave New Coin
For now, Dogecoin stands at a critical crossroads. Its ascending triangle formation, combined with rising accumulation and ETF speculation, has revived optimism across the market. Whether it can break free from its current consolidation phase and chart a path toward $1 will depend on how price action unfolds in the coming weeks.
Dogecoin’s technical structure shows promise, with an ascending triangle pattern hinting at a potential bullish breakout. A decisive move above $0.23 could signal the start of a rally toward $0.29 and possibly $1, though confirmation through volume and market momentum remains crucial for this Dogecoin price prediction 2025 to materialize.
The downtrend that pushed ADA lower and lower over October has now been broken, putting bullish Cardano price predictions back on track.
The altcoin has seen renewed participation as broader FUD tied to the U.S. government shutdown clears, with the Senate passing a continuing resolution during late Monday trading.
Though the trendline faces pressure again today, with the initial buy-the-news reaction giving way to sell pressure and a retest around $0.57.
Coinglass futures data also only shows moderate speculative demand despite the technical shift. Open interest has added around $9 million, suggesting traders are not willing to bet on the setup just yet.
Market participants may be awaiting stronger technical signals before taking positions.
While the Cardano price has broken above its month-long downtrend, it’s now facing resistance at a key former demand zone around $0.60.
Bulls have yet to fully seize control, and momentum indicators reflect that hesitation.
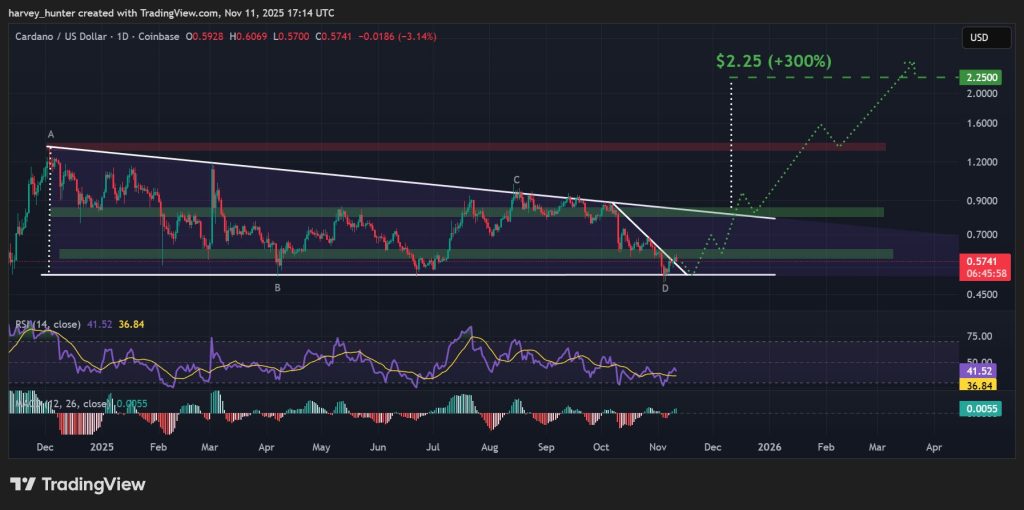
The RSI has stalled near 40, while the MACD histogram is flattening with only a narrow lead above the signal line, suggesting the uptrend remains fragile.
A shakeout scenario could see ADA retest its $0.52 launchpad level, aligning with the lower boundary of a year-long descending triangle, potentially forming a stronger double-bottom reversal setup.
For confirmation of a sustained breakout, $0.60 remains the key level to watch. Reclaiming it as support could open the path toward $0.82, the critical breakout threshold for the pattern.
Fully realised, a triangle breakout could see upside extend 300% to could see upside extend to $2.25. However, near-term support levels remain crucial levels to watch.
A fully realized triangle breakout could propel ADA as high as $2.25, a potential 300% move.
For now, however, short-term support levels remain pivotal levels to watch.
As regulation brings real-world utility back to the forefront, platforms like Cardano and SUBBD ($SUBBD) are gaining traction.
Positioned as an AI-powered content platform, SUBBD is redefining the $85 billion subscriber economy by giving creators true ownership and fans genuine access.
By cutting out the middlemen, $SUBDD puts control back in the hands of those who create real value. Creators can monetize directly, while fans gain access to exclusive content, early releases, and meaningful interactions through token-gated perks.
The concept is already gaining traction. $SUBBD has surpassed $1.3 million in presale, as investors back the shift toward a decentralized creator economy.
With SUBBD, both sides of the community win — creators earn more, and fans get closer while embracing the decentralization use cases crypto was built for.
Visit the Official SUBBD Website Here
The post Cardano Price Prediction: 30-Day Downtrend Is Over – Here’s Why Traders Are Suddenly Watching ADA Again appeared first on Cryptonews.