The main tag of Cryptocurrency price Articles.
You can use the search box below to find what you need.
[wd_asp id=1]
The main tag of Cryptocurrency price Articles.
You can use the search box below to find what you need.
[wd_asp id=1]
Dogecoin has had its share of ups and downs. Like Bitcoin and Ethereum, the meme coin sector is sluggish, and DOGE continues to face downward pressure. With viral pumps largely gone, investors are left watching and wondering if a meaningful rebound is possible.
This Dogecoin price prediction offers a realistic view of where DOGE stands today and whether 2026 might finally bring positive momentum.
Summary
Dogecoin (DOGE) is trading around $0.12, showing little upward momentum. It’s about flat over the last 24 hours, yet it is still down approximately 5% over the week and nearly 18% for the month.
This steady slide underscores persistent selling pressure, especially as the wider crypto market remains subdued. Meme coins like DOGE are often the first to drop when market sentiment turns cautious.
Part of the problem for DOGE is just how far it is from its peak. The token is roughly 82% below its May 2021 all-time high, and every rebound attempt has failed to hold strong. Short-term bounces can happen when it’s oversold, but resistance tends to cap them, meaning sellers are still active.
With liquidity low and hype-driven inflows largely missing, the DOGE outlook remains muted, even if we see small bursts from time to time
Trading below $0.15, DOGE is showing that bearish pressure isn’t going away anytime soon. Any bounce is likely to be weak unless the price can break through $0.20 and signal a shift in sentiment.
Bias: Bearish as long as DOGE stays below resistance.
Key levels: Strong support at $0.125–$0.130 and overhead resistance at $0.150–$0.155.
As long as DOGE trades below resistance, rallies may be viewed as corrective rather than trend-changing.
Looking ahead to 2026, the Dogecoin price prediction is giving off some mixed signals. CoinCodex thinks DOGE will stick close to $0.125–$0.145 — pretty calm. DigitalCoinPrice is more upbeat, saying it could climb to $0.33 if crypto sentiment turns positive. WalletInvestor is more measured: DOGE could sit anywhere between $0.083 and $0.256, averaging $0.171.
The DOGE forecast indicates a year of gradual movement rather than big leaps, closely following the swings of overall crypto sentiment.
Crypto news today is rewarding discipline again; as the market matures, traders are pitting mature large caps vs. early-stage asymmetric setups, especially if the goal is 2026 cycle growth. Cardano is one of the most recognized proof-of-stake networks, but its size changes the math on the upside.
Pepeto (https://pepeto.io) is being tracked from the opposite side, the presale stage entry, where the cost basis is tiny, community energy is high, and the roadmap is built around routed utility that can turn usage into repeat demand.
This article ADA and Pepeto through a 2026 lens using multiple indicators, support and resistance logic, momentum signals, volatility tools, and scenario-based valuation. It also notes why a lot of portfolios are doing ADA for stability exposure and Pepeto, the high-beta slot where they can do their next meme utility rotation.
Cardano Live Price and Market Analysis
CoinMarketCap live data lists Cardano trading at $0.3523 with a market cap of near $12.66B with a 24-hour trading volume of nearly $0.7885B. These numbers are important because they are what define the liquidity base that ADA needs to move, and they help to explain why holders are sometimes cautious when momentum fades.
ADA is still far from its previous cycle peak, which requires the chart to have room for recovery, but also that the chart has some overhead supply from the long-term holders who may sell into rallies. Technical analysis is useful, as it helps distinguish temporary bounces from actual changes in trend.
Technical Analysis is Based on Using Different Indicators
Trend indicators first. Many traders watch the 20- and 50-day exponential moving averages for the short-term direction and the 200-day moving average for the long-term regime. A long-term average above-average reclaim with follow-through is often a sign of a healthier recovery. Repeated rejection below can keep ADA trapped in a range.
Momentum indicators next. The Relative Strength Index is used to judge if rallies have strength. A sustained RSI profile above the midline is usually positive for trend continuation. MACD is kept an eye out for regime flips, with a special eye for it going positive and extending through pullbacks. If the MACD stays negative, there is often no follow-through by buyers.
Volatility and volume complete the picture. Bollinger Bands can show conditions of a squeeze, where compressed volatility often leads to an expansion move. On Balance Volume helps to confirm whether or not accumulation is occurring during advances. If OBV does not rise while price rises, the move can be fragile. Fibonacci retracement levels off of recent swing ranges are then used for confluence, especially when Fib zones line up with prior horizontal resistance.
ADA Price Prediction Scenarios Until 2026
• Base case. ADA is continuing the construction of a recovery staircase. If it has key supports and reclaims major moving averages, then a move to higher resistance bands is plausible. In this case, ADA is like a big cap that can provide respectable gains, but usually not extreme multiples.
• Bull case. A full altcoin season is back, the liquidity is increasing, and ADA is breaking resistance with continued strength of RSI, positive MACD, and expanding Bollinger Bands. That combination is typically indicative of trend continuation and not a one-week spike. ADA can reach higher price zones again, but it still needs heavy capital to reach previous all-time highs.
• Bear case. If ADA fails to reclaim trend structure, it can remain range-bound for a long time. Sideways behavior often persists until macro liquidity turns back into big caps or a clear catalyst turns risk appetite back on.
Pepeto 2026 Thesis: 50x ROI Portfolio Logic
Pepeto is placed in another style of opportunity, nearer an early-cycle venture allocation towards a mature network hold. It is deployed on the Ethereum mainnet, and it considers meme culture as an onboarding machine, and utility is the value engine. PepetoSwap is introduced as a zero-fee swap layer, Pepeto Bridge is targeted for cross-chain movement, and Pepeto Exchange is targeted as a verified meme exchange. The core thesis is routed demand, which means that the ecosystem usage is set up in such a way that it generates demand in the form of tokens because activity goes through $PEPETO.
Pepeto fundamentals are defined by constraints and incentives. The supply is fixed at 420 trillion tokens. Staking APY is advertised around 216% (https://pepeto.io/en/staking) , which can decrease circulating supply and decrease sell pressure in the future.
The project includes references to audits by SolidProof (https://pepeto.io/assets/documents/audit-solidproof.pdf) and Coinsult. Your presale snapshot is $7,113,592.37 raised, with 1 PEPETO trading at $0.000000174, as well as a countdown on the next price increase. Community strength is framed over 100,000+ members.
Now the 50x math. A 50x move from $0.000000174 implies a token price close to $0.000008700. With a 420 trillion supply, that implies a market cap of approximately $3.65B. That is way below the previous cycle peaks of the largest meme leaders, which is why traders refer to it as being a stretch target attainable in a strong 2026 bull run. By contrast, a 50x target for ADA would require a price closer to $17.61 and a market cap of over $633B, which requires a much more extreme macro environment.
Portfolio logic follows. ADA can be used as liquid large-cap exposure with upside, but in general, it is slower moving because the base is already quite large. Pepeto is positioned as the asymmetric slot where early entry, staking, and routed utility can lead to faster repricing should capital rotate into meme utility narratives.
How to Buy Pepeto
Go to (https://pepeto.io) and go to the presale page. Connect your wallet and then select your route of purchase using ETH, USDT, BNB, or a bank card through Web3Payments. Once the allocation is confirmed, you can instantly stake and begin compounding before listings. The official site also promotes a 700,000 dollar giveaway. Only use the official domain, and do not use look-alike pages.
Conclusion
Cardano sits firmly in the large-cap category. At current levels, its upside into 2026 depends on reclaiming trend structure, sustaining RSI and MACD momentum, and confirming expansion through volatility and volume. That profile offers stability but not speed.
Pepeto represents the opposite end of the opportunity spectrum. Built on Ethereum mainnet, it is still in presale and structured around routed ecosystem demand through PepetoSwap, Pepeto Bridge, and Pepeto Exchange. Audited contracts, a hard-capped 420 trillion supply, and staking yields near 216% APY create a setup designed for early-cycle acceleration rather than mature consolidation.
This distinction matters heading into the New Year. Portfolios targeting incremental gains lean toward established liquidity. Portfolios seeking 50x-style outcomes historically rotate into early-stage asymmetry where valuation has room to expand rapidly if narratives and usage align. Pepeto sits squarely in that window.
Timing is the critical variable. Presale access exists before listings, before widespread coverage, and before price discovery compresses opportunity. Once the calendar flips and attention shifts back toward higher-beta plays, these early entry points tend to disappear quickly.
For investors looking for the best crypto to invest in ahead of the New Year, the choice often comes down to this: maturity versus asymmetry. ADA offers proven infrastructure. Pepeto offers the kind of early positioning that has historically produced life-changing returns when meme-utility leaders emerge in a new cycle.
That window is still open but it doesn’t stay open once the market decides it’s time to move.
To stay ahead of key updates, listings, and announcements, follow Pepeto on its official channels only:
Website: https://pepeto.io
X (Twitter): https://x.com/Pepetocoin
Telegram: https://t.me/pepeto_channel
Instagram: https://www.instagram.com/pepetocoin/
These openings favor proactive action, once momentum shifts, this level is gone.
Contact: Dani Bonocci
Website: https://www.tokenwire.io
Phone: +971586738991
SOURCE: Pepeto
Press release distribution
This release was published on openPR.
Crypto news currently is filled with long-range predictions of Bitcoin entering a $250,000 discovery phase. When Bitcoin accelerates into vertical price discovery, there is rapid and fast capital flowing through the crypto market.
Large-cap assets typically have institutional liquidity, while early-stage narratives represent speculative rotation. XRP is a regulatory-aligned enterprise-style asset, while Pepeto (https://pepeto.io) is an early meme utility ecosystem that is designed to take advantage of cycle rotation.
XRP Live Market Data & Current Structure
CoinMarketCap-style snapshots show XRP trading at around $1.92 with a market cap of around $105.4B and a 24-hour trading volume of around $4.6B. These figures are important because XRP already has a very large valuation base. Large bases take much more liquidity to create extreme percentage multiples, and this has the natural effect of slowing down upside velocity compared with early-stage assets.
From a technical standpoint, XRP is still trading within long-term resistance bands drawn from prior cycle supply. Traders will typically plot these bands with horizontal resistance clusters and then confirm bias with several indicators.
Technical Analysis With Multiple Indicators
Trend indicators come first. Many desks track the 20-day and 50-day EMA to help define short-term direction and the 200-day MA as the long-term regime line. A clean reclaim above the 200-day with follow-through would be a signal that XRP is entering into a healthier uptrend. Repeated rejection below this level often holds XRP in consolidation.
Momentum tools help perfect timing. The Relative Strength Index is also used to determine if rallies are supported by strength or just corrective bounces. A moving RSI profile above the midline is usually bullish for the continuation of the trend. MACD is watched for regime flips, especially positive MACD that stays positive during pullbacks.
Volatility and volume tools complete the picture. Bollinger Bands identify squeeze conditions in which compressed volatility can be followed by sharp moves. On Balance Volume is used to confirm accumulation. If the price rises but OBV does not follow, the breakout may be fragile. Fibonacci retracement levels from the last swing range are also used for confluence when Fib zones are in phase with previous horizontal resistance.
XRP 2026 Outlook Assuming Bitcoin Reaches $250K
• Base case. If Bitcoin is in a sustained uptrend to the $250K area, XRP will be able to capitalize on the improved liquidity and sentiment. In this environment, XRP may challenge higher areas of resistance over the long term as long as moving averages are reclaimed and momentum indicators are supportive.
• Bull case. A combination of a full-scale liquidity expansion and positive regulatory developments could see XRP break decisively into a new discovery phase. This requires widening Bollinger Bands, positive MACD regimes, and rising OBV to confirm institutional accumulation.
• Bear case. If regulatory uncertainty or tightening of the macro environment persists, XRP is likely to be range-bound despite the strength of Bitcoin. In that case, rallies tend to die around resistance clusters, and capital tends to rotate into more beta stories.
Pepeto Asymmetric Upside Story
Pepeto is placed as the opposite style of opportunity. It is an Ethereum mainnet presale with meme culture being an onboarding engine, with utility being a key feature in terms of long-term value driver. PepetoSwap is placed as a zero-fee swap layer, Pepeto Bridge is a cross-chain movement, and Pepeto Exchange is a verified meme exchange. The key mechanic is routed demand, meaning that the ecosystem activity is supposed to create repeatable token demand.
Pepeto fundamentals put the focus on discipline of supply and incentives for participation. The total supply is fixed at 420T. Staking APY is touted as being around 216%, which can decrease the circulating supply and ease future selling pressure.
The project has references to audits by SolidProof and Coinsult. The presale data is $7,113,592. 37 raised, 1 $PEPETO priced at $0.000000174, and community strength is framed with 100,000+ members upwards.
This structure places Pepeto squarely in the asymmetric allocation category, making it one of the next meme coins to watch ahead of the New Year. While assets like XRP require enormous capital inflows to achieve large multiples, Pepeto operates from a micro valuation base where even modest rotation can trigger outsized repricing. That imbalance is precisely why speculative traders consistently target early-stage meme utility narratives during full-cycle expansions-especially before year-end liquidity shifts and broader market attention compress the opportunity.
How to Buy Pepeto
The Pepeto presale is running at (https://pepeto.io) . Connect your wallet, select ETH, USDT, or BNB, or pay by card via Web3Payments, and complete your allocation. Tokens are available to stake right away in order to take advantage of the high APY prior to listings. The official website also features a $700,000 dollar giveaway. Always make sure of the official domain to avoid imitation sites.
Conclusion
If Bitcoin ultimately pushes toward the $250K zone, large-cap assets like XRP are likely to attract enterprise- and regulation-aligned capital. That flow supports stability but it also comes with a ceiling. Assets with massive existing market caps rarely deliver extreme multiple expansion once a cycle matures.
Pepeto represents the opposite side of that equation. It is still an early-stage meme utility presale built on Ethereum mainnet, with routed ecosystem demand, a fixed supply structure, audited contracts, staking-driven supply reduction, and a community that is scaling before public listings reshape price discovery. This is the type of profile that historically absorbs speculative upside before it becomes obvious.
Every major Bitcoin cycle has produced a parallel story. While capital anchors itself in large caps, a separate wave hunts asymmetry smaller ecosystems with room to expand rapidly when liquidity accelerates. That is where 100x-style outcomes are formed, not in assets already weighed down by scale.
For investors scanning crypto market news looking for the best crypto to invest in or the next 100x meme-style opportunity, Pepeto represents that asymmetric side of the $250K Bitcoin narrative. It is the trade that exists before rotation headlines appear the one that looks obvious only after pricing has already moved.
Once presale phases advance and broader access arrives, these windows historically close fast. Early positioning is what separates life-changing returns from incremental gains.
That is why Pepeto is increasingly framed as the next crypto to explode. It sits where cycles quietly reward conviction before consensus forms and before the market agrees the move has already begun.
To stay ahead of key updates, listings, and announcements, follow Pepeto on its official channels only:
Website: https://pepeto.io
X (Twitter): https://x.com/Pepetocoin
Telegram: https://t.me/pepeto_channel
Instagram: https://www.instagram.com/pepetocoin/
First steps define lasting advantage, once growth builds, this gate disappears.
Contact: Dani Bonocci
Website: https://www.tokenwire.io
Phone: +971586738991
SOURCE: Pepeto
Press release distribution
This release was published on openPR.
Crypto news today is showing a clear split in trader behavior. Large caps are still absorbing liquidity, but many altcoin holders are getting cautious as charts compress and momentum fades. Solana is a prime example. SOL remains a top network, yet price action is signaling patience, not euphoria. In the same breath, early-cycle hunters are scanning for the next 100x meme coin-style setup that can outperform majors once the market rotates.
That rotation lens is why Pepeto (https://pepeto.io) is getting attention as the best crypto presale to buy, according to the narrative. It is not being marketed as a random meme launch. It is being positioned as meme culture plus real utility, designed to route activity into token demand. This article breaks down Solana’s technical levels and then contrasts them with Pepeto’s structured upside logic for 2026.
Solana Live Data and Technical Map
CoinMarketCap live data shows Solana at $123.36 with a 24-hour trading volume of $5,048,311,949 and a market cap of $69,422,301,750. This snapshot matters because it sets the current battleground for support and resistance. When a large cap like SOL trades heavy volume without escaping a range, it often signals distribution, rotation, or a market waiting for a macro trigger.
From a technical perspective, traders usually build a multi-indicator map instead of relying on one signal. First, they mark the horizontal structure. With SOL near the low one twenties, buyers often defend the area around $120 to $123, while sellers frequently respond near $130 to $135. Above that, the next heavy decision zone often appears near $150, followed by a higher resistance band around $170 to $175 where prior swing reactions tend to cluster.
Next comes trend confirmation. Many desks track the 20-day and 50-day exponential moving averages for momentum and the 200-day moving average for regime bias. A clean reclaim above the long-term average typically signals trend recovery, while repeated rejections below it keep sentiment cautious. Traders then validate with oscillators.
The Relative Strength Index is used to detect whether SOL is trending with strength or merely bouncing inside a range. The MACD is watched for momentum shifts, especially when it flips from negative to positive and holds. Bollinger Bands help identify squeeze conditions. A tight band structure often precedes an expansion, which becomes the moment range traders switch to breakout tactics.
Volume indicators add a second layer. On Balance Volume is used to check whether volume is accumulating during rallies or leaking during bounces. If price rises while OBV fails to follow, the move can be fragile. Many traders also use Fibonacci retracement levels from the most recent swing high to swing low.
These levels often align with the same resistance zones, creating confluence. The key takeaway is simple. SOL is not broken, but it is not signaling effortless upside either. Until it decisively reclaims higher resistance and holds, cautious behavior remains rational.
Solana 2026 Price Prediction Scenarios
Price prediction work is best approached as scenario planning. In the base case, Solana continues building a long consolidation floor. If the $120 region holds and SOL can regain the $150 zone, the market could slowly reprice toward the $170 to $175 band. In that environment, a 2026 range of $175 to $240 becomes plausible if broader liquidity improves and network activity remains steady.
In the bull case, SOL clears resistance with strong volume and holds above the long-term trend line. This is where indicators matter. A sustained RSI strength profile, positive MACD regime, and expanding Bollinger Bands typically confirm that a breakout is real. If that happens during a full market expansion, SOL could challenge the $300 area by new year . That would require consistent follow-through and a macro backdrop that supports risk appetite.
In the bear case, SOL loses the 120 region and fails to reclaim the next resistance band. That would likely pull the price toward lower support zones, with long periods of sideways behavior. A sideways-to-soft 2026 outcome would be defined by repeated failed breakouts and volume that fades on rallies. The reason these scenarios matter is that SOL is already a large cap. Its upside can be meaningful, but it typically requires sustained capital, not only narrative heat.
Why Pepeto Investors See a 65x Path to 2026
Pepeto is being framed as the opposite type of bet. SOL is a large cap that needs heavy liquidity to multiply. Pepeto is an early-stage meme utility narrative where the multiple is driven by starting valuation, community velocity, and a designed demand engine.
Pepeto runs on the Ethereum mainnet and is built around three internal rails. PepetoSwap is positioned as a zero-fee swap layer. Pepeto Bridge (https://pepeto.io/#bridge) targets cross-chain movement. Pepeto Exchange is described as a verified meme exchange where all volume routes through $PEPETO. That routed volume design is the core thesis. As ecosystem usage increases, transactional flow is intended to reinforce token demand rather than just create noise.
The numbers investors track are straightforward. Pepeto has a fixed supply of 420 trillion (https://pepeto.io/#tokenomics) . The presale price is $0.000000174. The project reports $7,113,592.37 raised, staking APY around 216%, audits by SolidProof and Coinsult, and a community above 100,000 members. Staking matters because it can reduce circulating supply and soften future sell pressure, which can improve price behavior when liquidity arrives.
A 65x return from $0.000000174 implies a token price near $0.00001131. With a fixed 420 trillion supply, that price corresponds to a market value around $4.75 billion. That is not a fantasy number in crypto cycles. It is well below the prior peak valuations seen by the largest meme leaders, yet high enough to represent a meaningful breakout. This is why Pepeto holders frame 65x as a path, not a promise. The path relies on three drivers. First, community scale that keeps attention sticky. Second, utility routing that turns activity into demand. Third, stage-based early entry dynamics where presale pricing rises over time and rewards the earliest participants.
How to Buy Pepeto
The Pepeto presale is active at (https://pepeto.io) . Open the official website and connect your wallet. Choose your payment option using ETH, USDT, BNB, or a bank card through Web3Payments, then confirm the purchase.
After purchase, you can stake your tokens immediately to target the high APY before listings. The official site also promotes a $700,000 dollar giveaway. Always double-check the website address and avoid look-alike pages to reduce the risk of fake sites.
Conclusion
Solana remains a major asset, but its current posture explains why many holders are waiting rather than pressing risk. Trading near the $123 level, SOL’s next leg depends on reclaiming resistance with confirmation across trend, momentum, volatility, and volume. It can perform into 2026 but the path forward is methodical, not explosive.
Pepeto sits on the opposite side of the opportunity curve. It is being evaluated as an early-stage meme utility presale on Ethereum mainnet, structured around a routed demand thesis powered by PepetoSwap, Pepeto Bridge, and Pepeto Exchange. Instead of waiting for confirmation, Pepeto is positioned before discovery, where asymmetry is still intact.
With a fixed 420 trillion supply, staking yields near 216% APY, completed SolidProof and Coinsult audits, more than $7.1 million raised, and a community already exceeding 100,000 members, Pepeto checks the same structural boxes that historically appear before major meme breakouts. This is why it continues to surface in conversations around the next meme coin to explode as the market rotates back toward higher-velocity narratives.
The 65x-style thesis isn’t built on hype alone. It’s a wager on early entry, compounding through staking while supply tightens, and the idea that routed ecosystem volume can mature into a durable demand engine as the next cycle unfolds. These setups don’t remain available once sentiment flips and listings compress entry points.
That’s why Pepeto is increasingly framed as one of the best cryptos to invest in ahead of the New Year. The structure is already in place, participation is accelerating, and pricing still reflects early access rather than future relevance. Historically, this is the phase where life-changing returns are positioned not after the move becomes obvious.
To stay ahead of key updates, listings, and announcements, follow Pepeto on its official channels only:
Website: https://pepeto.io
X (Twitter): https://x.com/Pepetocoin
Telegram: https://t.me/pepeto_channel
Instagram: https://www.instagram.com/pepetocoin/
Early conviction shapes future positioning, once breakout begins, this access vanishes.
Contact: Dani Bonocci
Website: https://www.tokenwire.io
Phone: +971586738991
SOURCE: Pepeto
Press release distribution
This release was published on openPR.
The U.S. dollar’s recent retreat has started to ripple through global markets, and cryptocurrencies like Ethereum are positioned to benefit. With the Federal Reserve easing rates and the dollar’s decade-long strength beginning to fade, investors are reassessing where real growth and returns could come from. Ethereum price, currently trading near $2,955, sits at the intersection of this shift — quietly coiling for what could be a decisive move in early 2026.
A weaker dollar tends to lift risk assets, from tech stocks to cryptocurrencies, as global investors search for alternatives that can outperform depreciating U.S. holdings. The dollar index fell about 10% in 2025, marking its first sustained decline in years. Analysts at Deutsche Bank and TD Securities expect that trend to continue into 2026 as the Fed maintains a dovish stance and global growth remains resilient.
For Ethereum price, that macro backdrop is critical. When the dollar weakens, demand often rises for scarce, globally traded digital assets like ETH price. Investors holding non-U.S. currencies find crypto cheaper to buy, while U.S. investors hedge against the dollar’s loss of purchasing power. This dynamic historically drives inflows into Bitcoin and Ethereum — a pattern seen during previous rate-cut cycles.

Ethereum price daily chart shows tight consolidation between $2,900 and $3,000, following months of gradual decline since mid-October. The Bollinger Bands have narrowed significantly, a classic signal of declining volatility that often precedes a breakout. The lower band near $2,801 is acting as key support, while the upper band near $3,176 defines resistance.
Volume has been muted, but candles over the past two weeks hint at accumulation — small-bodied candles with long wicks at lower levels show buyers stepping in around $2,900. If Ethereum can close convincingly above $3,000, the next psychological target sits around $3,200, followed by the Fib retracement levels at $3,350 (0.382) and $3,550 (0.5). Failure to hold $2,800, on the other hand, opens downside risk toward $2,500, where the 0.618 retracement and prior December lows align.
Fed rate cuts directly reduce yields on U.S. Treasuries, making them less appealing compared to growth assets like equities and crypto. As institutional investors rotate capital, ETH price stands to gain not only as a speculative play but also as a yield-generating asset via staking — a crucial differentiator in a lower-yield world.
Meanwhile, the weakening dollar makes Ethereum-denominated DeFi ecosystems more attractive globally. Transactions, liquidity pools, and yield opportunities priced in ETH become relatively cheaper for international participants, encouraging cross-border capital flow into Ethereum’s on-chain economy.
Despite price stagnation, on-chain metrics show improving sentiment. Active addresses have stabilized, and exchange reserves continue to decline — a sign that holders are moving ETH into cold storage or staking rather than selling. That behavior often precedes medium-term rallies.
The dollar’s decline also has a psychological effect: it reignites the inflation hedge narrative that powered crypto’s earlier bull runs. Even if true de-dollarization remains exaggerated, perception alone can fuel speculative demand — and Ethereum price often benefits first when macro tailwinds shift.
If the Fed maintains its easing path through Q1 2026 and the dollar continues sliding, Ethereum price has a clear path to reclaim higher levels. The most probable scenario is a gradual climb toward $3,500 by March, followed by potential consolidation before a larger breakout later in the year.
However, if the Fed pauses cuts sooner or the dollar rebounds, Ethereum price may remain range-bound near $2,800–$3,000. For now, technical compression and supportive macro tailwinds both point to accumulation, not capitulation.
The dollar’s weakening isn’t just a macro footnote — it’s a potential catalyst for Ethereum’s next major move. The combination of lower U.S. yields, persistent global demand for decentralized assets, and Ethereum’s improving on-chain strength could create the conditions for a renewed rally in early 2026.
As the saying goes, bull markets don’t start with headlines — they start with quiet accumulation. Right now, $ETH looks like it’s in exactly that phase.
XRP price
prediction 2026 presents conflicting signals as the digital asset trades at
$1.85 on December 30, 2025, caught between bullish institutional forecasts and
bearish technical patterns.
Standard
Chartered projects XRP could surge 330% to $8 by end-2026, driven by
sustained ETF inflows exceeding $1.15 billion and regulatory clarity following
the SEC settlement.
However, my
technical analysis reveals a death cross formation targeting declines toward
$1.25 before a potential Q2 2026 reversal, creating uncertainty about
whether XRP can escape its current consolidation near 2025 lows.
The token
remains down 11.84% from one year ago and approximately 47% below its 2025 peak
near $3.50, despite 30 consecutive days of XRP ETF inflows signaling strong
institutional interest. This divergence between price action and investor
sentiment makes 2026 a pivotal year for XRP holders evaluating long-term price
targets and whether XRP can participate in the next crypto bull run.
In this article, I answer the question of what XRP
price predictions look like for 2026 and how high the XRP price could rise.
XRP is
trading at $1.85 per token with a market capitalization of $111.79 billion and
24-hour trading volume of $2.22 billion. The cryptocurrency has experienced
significant volatility throughout December, declining from $2.20 highs in late
November to test support in the $1.80-$1.90 range.
Recent
price action shows XRP down 0.91% from yesterday’s $1.865 level, continuing a
pattern of lower highs that defines the current bearish structure and
underperformance versus Bitcoin and Ethereum.
XRP price today. Source: Tradingview.com
Technical
indicators paint a concerning picture for short-term XRP sentiment. The token
has formed a death cross pattern where the 50-day exponential
moving average crossed below the 200-day EMA, historically a bearish signal
indicating extended downside momentum.
XRP price
is moving within a descending channel with clear resistance at $1.93, which the
token failed to break during recent rallies, reinforcing selling pressure and
bearish momentum.
Key
short-term technical points for XRP price analysis include:
XRP price technical analysis on a daily chart. Source: Tradingview.com
Based on my
technical analysis of the XRP/USDT chart, the next logical target sits at $1.25,
representing October 2025 flash crash lows where stronger accumulation may
emerge. Only after realizing this final bottom does the technical setup suggest
cleansing of weak hands and foundation for stronger institutional support that
could push XRP price back toward $3.50+ levels seen in 2025.
The broader
crypto market context shows Bitcoin trading near $87,000 and Ethereum around
$2,900, with both major cryptocurrencies experiencing similar Q4 volatility.
XRP’s price action reflects macro conditions affecting the crypto market, but
the token’s underperformance relative to bitcoin and Ethereum highlights
specific concerns about XRP sentiment and long-term holders’ conviction.
This
comparison matters for institutional investors considering whether to buy XRP
versus other digital assets as part of a diversified crypto portfolio.
Standard
Chartered has emerged as the most bullish institutional voice on XRP price
prediction 2026, with Geoffrey Kendrick, the bank’s global head of digital
assets research, projecting
the token will reach $8.00 by end-2026.
This target
represents a potential 330% increase from current levels around $1.86 and
reflects structural changes in XRP’s regulatory environment and institutional
adoption rather than short-term speculative hype.
Kendrick’s
methodology centers on quantitative modeling of ETF flows and supply dynamics.
The analyst calculates that if XRP ETFs maintain their current pace and attract
$10 billion in total inflows by late 2026, this capital would need to purchase
approximately 4-5 billion tokens at average prices around $2.20.
Removing
this quantity from circulation, combined with the existing 45% decline in
exchange balances from 3.95 billion to 2.6 billion tokens during the initial
ETF launch period, would create substantial supply-side pressure supporting
higher price levels.
Standard
Chartered’s multi-year trajectory for xrp price may be summarized as follows:
|
Year |
XRP price prediction |
Key driver |
|
2025 |
5.50 dollar |
ETF |
|
2026 |
8.00 dollar |
10B ETF |
|
2027 |
10.40 dollar |
Growing cross-border adoption |
|
2028 |
12.50 dollar |
Mature |
This
long-term price outlook assumes sustained institutional investors’ interest in
XRP as a digital asset and continued progress in Ripple Labs’ cross-border
payment partnerships.
The
Motley Fool offers
a more cautious institutional view, suggesting $3.00 as a realistic
2026 target, implying approximately 58% upside from current levels.
Analysts there acknowledge the positive tailwinds from regulatory clarity and
ETF approvals but underline that XRP’s price has declined year-to-date despite
the Trump administration’s supportive stance towards the crypto industry.
Consensus
analyst forecasts across multiple platforms show a range of $2.71 to
$8.60 for XRP price in 2026, with an average prediction around $3.90.
Several Wall Street analysts cited by crypto market outlets project XRP could
trade between $3.40 and $5.00, marking a 40-70% gain from mid-2025
levels. These mid-range forecasts rely heavily on:
Options-based
analysis from Jeff Anderson, Head of Asia at STS Digital, provides
market-implied probabilities instead of directional forecasts.
“Based on
current market conditions, including observed volatility and skew, we can
estimate the probability that each asset will trade above specific price
targets by 31 December 2026,” he commented for FinanceMagnates.com
“XRP,
trading near $1.85, shows a 25pct probability of finishing above $2.40 and a
10pct probability of exceeding $3.90 and finally,” he forecasted.
These
probabilities help investors calibrate expectations around price levels without
assuming the crypto market will necessarily enter a new bull run.
Changelly’s
algorithmic model forecasts an average XRP price of $5.12 in 2026 with
a maximum around $5.79, while CoinCodex projects $2.75 by mid-2026,
reflecting more moderate expectations for XRP’s price trajectory. Together,
these estimates reinforce a wide but data-backed range for long-term price
scenarios.
The crypto
analyst community offers more aggressive long-term price forecasts, leaning on
technical indicators, Elliott Wave structures, and historical volatility to
project XRP’s potential performance in 2026 and even 2030.
EGRAG
Crypto maintains
a bullish long-term XRP price prediction based on Elliott Wave theory.
According to this analysis, XRP is completing a Wave 4 correction and
preparing for an explosive Wave 5 move that could redefine its
price level in the crypto market. Using Fibonacci extensions, EGRAG
identifies resistance targets at:
The analyst
compares the current consolidation to XRP’s 2017 setup, when xrp price traded
sideways for six months before surging to its all-time high of $3.84 in January
2018. EGRAG’s base case assumes that a break above $3.40-4.00 would confirm a
new bullish structure and open the path to $10 and beyond, although such
targets are more relevant for longer horizons like 2030 rather than a single
year.
Dark
Defender provides
a complementary Elliott Wave view, suggesting that XRP completed Wave 4 at
$1.88 in late 2025 and is now poised
to move toward $5.85 dollar in Wave 5. The analyst
highlights:
Dark
Defender links this uptrend potential to sustained ETF inflows and improving
XRP sentiment as regulatory risks fade, but acknowledges that timing remains
uncertain and dependent on broader crypto market conditions.
AI-based
forecasts add another layer to the long-term price debate. When asked to model
XRP price under a scenario of 10 billion dollar in ETF inflows by
late 2026:
Several
critical catalysts will determine whether XRP price prediction scenarios skew
toward the conservative or bullish end of the spectrum. These include ETF
flows, the SEC case outcome, cross-border utility, and macro conditions
affecting the crypto market.
Filip
Dzięciołowski, Editor-in-Chief at Cryps.pl, notes that XRP currently trades at the lowest
levels of 2025 in a narrow consolidation zone and that nothing suggests a rapid
trend change in the coming weeks or months.
“For now,
there are no clear signs that this situation will change in the coming weeks or
even months,” he says. “Over the longer term, however, and looking ahead to the
whole of 2026, a return toward this year’s high, above $3.50, is assumed.”
XRP ETFs
are at the center of the current narrative around whether XRP could outperform
in 2026. Since their launch in November 2025, these products have:
This
pattern signals strong institutional support and interest in XRP as a regulated
investment product, changing the way many investors approach xrp profit
calculator tools and long-term price planning.
“XRP,
so far, remains mostly an ETP- and ETF-flow story,” Ryan Lee, Chief Analyst at
Bitget, commented for FinanceMagnates.com. “Much depends on the persistence of
these inflows and on whether institutional interest in Ripple’s payments
ecosystem translates into something more meaningful. There’s a kind of tension
between short-term fear and long-term positioning in crypto, with ETF inflows
staying steady and exchange balances continuing to fall, exactly what I
associate with mid-cycle consolidation.”
|
Metric |
Value |
|
ETF cumulative inflows |
1.15B dollar+ |
|
Consecutive inflow days |
30 |
|
Exchange balance reduction |
45% (3.95B to 2.6B XRP) |
|
XRP |
Outperforming BTC ETFs |
The SEC
case resolution represents another foundational catalyst. The
Securities and Exchange Commission dropped its appeal against Ripple, and the
company agreed to a $50 million settlement without admitting wrongdoing. Judge
Analisa Torres clarified that XRP is not considered financial security when
sold on exchanges to retail investors, reducing legal uncertainty that had
weighed on xrp price for years.
This
regulatory clarity has encouraged institutional investors previously cautious
about the lawsuit against Ripple, improving market sentiment and creating room
for ETFs and other products to gain traction in the U.S crypto market.
XRP’s
long-term price outlook and predictions for XRP in 2030 depend heavily on
real-world utility as a cross-border settlement token. Ripple CEO Brad
Garlinghouse has stated that XRP could capture 14% of SWIFT’s global
transaction volume within five years, which would represent more than
2.8 trillion dollar in annual flows routed through the XRP Ledger.
While this
goal remains ambitious, even partial realization would significantly increase
demand for XRP as a bridge currency. However, skeptics highlight several
challenges:
For XRP to
justify the upper end of price forecasts, Ripple Labs must convert more
messaging-only clients into full On-Demand Liquidity users, directly linking
network adoption to demand for the token itself.
Macroeconomic
conditions will influence whether 2026 feels like consolidation or a new bull
phase for crypto. Expectations for Federal Reserve rate cuts toward
the 3.00-3.25% range could support risk assets, including cryptocurrencies, by
lowering the opportunity cost of holding volatile digital assets like XRP.
However, unexpected inflation spikes or recession risks could shift
institutional positioning away from crypto, impacting XRP price and trading
volume across exchanges.
The
traditional four-year Bitcoin cycle is also being questioned
as institutional ETFs change market structure. If the cycle moderates, crypto
market participants might see fewer extreme sell-offs, allowing long-term
holders of XRP to benefit from more stable bull markets. If the cycle persists,
however, 2026 could become a consolidation year where XRP trades sideways or
corrects, delaying more substantial rallies until the next cycle leg.
While the
bullish narrative around XRP price prediction 2026 is compelling, several key
risk factors may prevent XRP from reaching high-end targets like $8 or even $10.
The most
important structural risks include:
If XRP’s
real-world utility stagnates while the broader crypto space innovates, the
price trajectory may lag even in a broader bull run.
From my
technical analysis perspective, XRP faces several immediate challenges that
weigh on XRP sentiment:
These
conditions suggest that, even if long-term price forecasts remain bullish, XRP
price may see further underperformance against Bitcoin and Ethereum in early
2026.
Despite
numerous risks, XRP continues to attract attention from long-term holders,
institutional investors, and traders using XRP profit calculator tools to model
various scenarios for 2025, 2026, and 2030.
Key metrics
to monitor as part of a data-driven XRP investment thesis include:
Contrarian
investors may be attracted by the current Fear & Greed Index levels around
24-25 (Extreme Fear), which historically have preceded rebounds in the broader
crypto market. However, aligning entries with technical support levels such as $1.25-1.50
could improve risk-reward profiles compared with buying at current prices
purely based on optimistic forecasts.
Summarizing
the main 2026 price scenarios for XRP:
Each
scenario implies different risk profiles and requires close monitoring of
trading volume, institutional positioning, and macro conditions in the crypto
market.
Before
you leave, take a look at my earlier cryptocurrency analyses, and if you find
my work useful, consider following me on X.
I have also included a helpful FAQ section below.
XRP price
prediction for 2026 ranges from conservative institutional forecasts of 3
dollar to bullish targets of 8 dollar, with consensus averaging around 3.90
dollar. Standard Chartered’s Geoffrey Kendrick expects 8 dollar driven by ETF
flows and regulatory clarity, while technical analysis suggests a possible drop
toward 1.25 dollar before a recovery in Q2 2026.
XRP could
trade between 2.40 and 8 dollar by the end of 2026, with options data from Jeff
Anderson indicating a 25% probability of finishing above 2.40 dollar and a 10%
probability of exceeding 3.90 dollar [provided quotes]. Consensus forecasts
around 3.90 dollar balance bullish long-term price expectations with caution
about the token’s current bearish momentum and regulatory history.
Whether to
buy XRP depends on individual risk tolerance, time horizon, and conviction in
Ripple’s ability to convert regulatory clarity into real-world adoption. ETF
inflows, supportive court rulings in the SEC case, and institutional support
provide solid arguments for long-term investors, but the current technical
downtrend and potential move toward 1.25 dollar suggest waiting for clearer
bullish confirmation or more attractive price levels may be prudent for some
market participants. This article does not constitute financial advice.
Key
catalysts that could shape XRP’s price outlook include:
XRP price
is declining in December 2025 due to a combination of broad crypto market
weakness, bearish technical indicators such as the death cross, and
profit-taking after the 2024-2025 rally. Despite strong institutional support
via ETFs, short-term selling pressure and underperformance relative to bitcoin
and ethereum have weighed on xrp sentiment and market-wide evaluations of its
near-term potential.
Reaching 10
dollar in 2026 remains a low-probability scenario in institutional models,
although EGRAG Crypto’s Elliott Wave analysis allows for such levels in a
full-blown bull run. Achieving 10 dollar would imply a market cap approaching
600 billion dollar, requiring XRP to capture a much larger share of the crypto
market and cross-border payment flows than currently observed. Most forecasts
see 10 dollar as a potential longer-term target beyond 2026 rather than a
central scenario for the next 12 months.
XRP’s
all-time high is 3.84 dollar, reached in January 2018 at the peak of a previous
crypto bull run. In early 2025, XRP approached this level again when it surged
to around 3.50 dollar following Donald Trump’s election victory and subsequent
favorable regulatory developments, but it has since retreated to 1.85 dollar.
XRP ETFs
affect token price by removing significant supply from exchanges as providers
accumulate XRP to back shares, contributing to a 45% drop in exchange balances.
With over 1.15 billion dollar in ETF inflows and 30 consecutive days without
outflows, these structures have become central to any serious XRP price
prediction for 2026 and beyond. If inflows continue and reach 10 billion dollar
as Standard Chartered models, xrp price may see structural upward pressure
regardless of short-term volatility.
The price
of xrp has experienced dramatic swings since 2024, driven largely by the legal
battle with the SEC and broader crypto industry volatility. At the time of
writing, XRP trades at 1.87 dollar with a current value reflecting 49% decline
from its 2025 peak of 3.66 dollar. Throughout 2024, XRP tested multiple key
price points between 0.50 and 0.70 dollar as the legal battle outcome remained
uncertain, keeping institutional investors cautious.
The token
surged 580% between November 2024 and January 2025 following regulatory
clarity, reaching critical price points near 3.50 dollar before the recent
sell-off brought it back toward 1.80-1.90 dollar support levels. This
volatility pattern demonstrates how regulatory developments continue to drive
major price of xrp movements across the crypto industry, with the SEC case
resolution in 2025 marking an inflection point that allowed institutional
support through ETFs to emerge despite subsequent bearish technical pressure.
XRP price
prediction 2026 presents conflicting signals as the digital asset trades at
$1.85 on December 30, 2025, caught between bullish institutional forecasts and
bearish technical patterns.
Standard
Chartered projects XRP could surge 330% to $8 by end-2026, driven by
sustained ETF inflows exceeding $1.15 billion and regulatory clarity following
the SEC settlement.
However, my
technical analysis reveals a death cross formation targeting declines toward
$1.25 before a potential Q2 2026 reversal, creating uncertainty about
whether XRP can escape its current consolidation near 2025 lows.
The token
remains down 11.84% from one year ago and approximately 47% below its 2025 peak
near $3.50, despite 30 consecutive days of XRP ETF inflows signaling strong
institutional interest. This divergence between price action and investor
sentiment makes 2026 a pivotal year for XRP holders evaluating long-term price
targets and whether XRP can participate in the next crypto bull run.
In this article, I answer the question of what XRP
price predictions look like for 2026 and how high the XRP price could rise.
XRP is
trading at $1.85 per token with a market capitalization of $111.79 billion and
24-hour trading volume of $2.22 billion. The cryptocurrency has experienced
significant volatility throughout December, declining from $2.20 highs in late
November to test support in the $1.80-$1.90 range.
Recent
price action shows XRP down 0.91% from yesterday’s $1.865 level, continuing a
pattern of lower highs that defines the current bearish structure and
underperformance versus Bitcoin and Ethereum.
XRP price today. Source: Tradingview.com
Technical
indicators paint a concerning picture for short-term XRP sentiment. The token
has formed a death cross pattern where the 50-day exponential
moving average crossed below the 200-day EMA, historically a bearish signal
indicating extended downside momentum.
XRP price
is moving within a descending channel with clear resistance at $1.93, which the
token failed to break during recent rallies, reinforcing selling pressure and
bearish momentum.
Key
short-term technical points for XRP price analysis include:
XRP price technical analysis on a daily chart. Source: Tradingview.com
Based on my
technical analysis of the XRP/USDT chart, the next logical target sits at $1.25,
representing October 2025 flash crash lows where stronger accumulation may
emerge. Only after realizing this final bottom does the technical setup suggest
cleansing of weak hands and foundation for stronger institutional support that
could push XRP price back toward $3.50+ levels seen in 2025.
The broader
crypto market context shows Bitcoin trading near $87,000 and Ethereum around
$2,900, with both major cryptocurrencies experiencing similar Q4 volatility.
XRP’s price action reflects macro conditions affecting the crypto market, but
the token’s underperformance relative to bitcoin and Ethereum highlights
specific concerns about XRP sentiment and long-term holders’ conviction.
This
comparison matters for institutional investors considering whether to buy XRP
versus other digital assets as part of a diversified crypto portfolio.
Standard
Chartered has emerged as the most bullish institutional voice on XRP price
prediction 2026, with Geoffrey Kendrick, the bank’s global head of digital
assets research, projecting
the token will reach $8.00 by end-2026.
This target
represents a potential 330% increase from current levels around $1.86 and
reflects structural changes in XRP’s regulatory environment and institutional
adoption rather than short-term speculative hype.
Kendrick’s
methodology centers on quantitative modeling of ETF flows and supply dynamics.
The analyst calculates that if XRP ETFs maintain their current pace and attract
$10 billion in total inflows by late 2026, this capital would need to purchase
approximately 4-5 billion tokens at average prices around $2.20.
Removing
this quantity from circulation, combined with the existing 45% decline in
exchange balances from 3.95 billion to 2.6 billion tokens during the initial
ETF launch period, would create substantial supply-side pressure supporting
higher price levels.
Standard
Chartered’s multi-year trajectory for xrp price may be summarized as follows:
|
Year |
XRP price prediction |
Key driver |
|
2025 |
5.50 dollar |
ETF |
|
2026 |
8.00 dollar |
10B ETF |
|
2027 |
10.40 dollar |
Growing cross-border adoption |
|
2028 |
12.50 dollar |
Mature |
This
long-term price outlook assumes sustained institutional investors’ interest in
XRP as a digital asset and continued progress in Ripple Labs’ cross-border
payment partnerships.
The
Motley Fool offers
a more cautious institutional view, suggesting $3.00 as a realistic
2026 target, implying approximately 58% upside from current levels.
Analysts there acknowledge the positive tailwinds from regulatory clarity and
ETF approvals but underline that XRP’s price has declined year-to-date despite
the Trump administration’s supportive stance towards the crypto industry.
Consensus
analyst forecasts across multiple platforms show a range of $2.71 to
$8.60 for XRP price in 2026, with an average prediction around $3.90.
Several Wall Street analysts cited by crypto market outlets project XRP could
trade between $3.40 and $5.00, marking a 40-70% gain from mid-2025
levels. These mid-range forecasts rely heavily on:
Options-based
analysis from Jeff Anderson, Head of Asia at STS Digital, provides
market-implied probabilities instead of directional forecasts.
“Based on
current market conditions, including observed volatility and skew, we can
estimate the probability that each asset will trade above specific price
targets by 31 December 2026,” he commented for FinanceMagnates.com
“XRP,
trading near $1.85, shows a 25pct probability of finishing above $2.40 and a
10pct probability of exceeding $3.90 and finally,” he forecasted.
These
probabilities help investors calibrate expectations around price levels without
assuming the crypto market will necessarily enter a new bull run.
Changelly’s
algorithmic model forecasts an average XRP price of $5.12 in 2026 with
a maximum around $5.79, while CoinCodex projects $2.75 by mid-2026,
reflecting more moderate expectations for XRP’s price trajectory. Together,
these estimates reinforce a wide but data-backed range for long-term price
scenarios.
The crypto
analyst community offers more aggressive long-term price forecasts, leaning on
technical indicators, Elliott Wave structures, and historical volatility to
project XRP’s potential performance in 2026 and even 2030.
EGRAG
Crypto maintains
a bullish long-term XRP price prediction based on Elliott Wave theory.
According to this analysis, XRP is completing a Wave 4 correction and
preparing for an explosive Wave 5 move that could redefine its
price level in the crypto market. Using Fibonacci extensions, EGRAG
identifies resistance targets at:
The analyst
compares the current consolidation to XRP’s 2017 setup, when xrp price traded
sideways for six months before surging to its all-time high of $3.84 in January
2018. EGRAG’s base case assumes that a break above $3.40-4.00 would confirm a
new bullish structure and open the path to $10 and beyond, although such
targets are more relevant for longer horizons like 2030 rather than a single
year.
Dark
Defender provides
a complementary Elliott Wave view, suggesting that XRP completed Wave 4 at
$1.88 in late 2025 and is now poised
to move toward $5.85 dollar in Wave 5. The analyst
highlights:
Dark
Defender links this uptrend potential to sustained ETF inflows and improving
XRP sentiment as regulatory risks fade, but acknowledges that timing remains
uncertain and dependent on broader crypto market conditions.
AI-based
forecasts add another layer to the long-term price debate. When asked to model
XRP price under a scenario of 10 billion dollar in ETF inflows by
late 2026:
Several
critical catalysts will determine whether XRP price prediction scenarios skew
toward the conservative or bullish end of the spectrum. These include ETF
flows, the SEC case outcome, cross-border utility, and macro conditions
affecting the crypto market.
Filip
Dzięciołowski, Editor-in-Chief at Cryps.pl, notes that XRP currently trades at the lowest
levels of 2025 in a narrow consolidation zone and that nothing suggests a rapid
trend change in the coming weeks or months.
“For now,
there are no clear signs that this situation will change in the coming weeks or
even months,” he says. “Over the longer term, however, and looking ahead to the
whole of 2026, a return toward this year’s high, above $3.50, is assumed.”
XRP ETFs
are at the center of the current narrative around whether XRP could outperform
in 2026. Since their launch in November 2025, these products have:
This
pattern signals strong institutional support and interest in XRP as a regulated
investment product, changing the way many investors approach xrp profit
calculator tools and long-term price planning.
“XRP,
so far, remains mostly an ETP- and ETF-flow story,” Ryan Lee, Chief Analyst at
Bitget, commented for FinanceMagnates.com. “Much depends on the persistence of
these inflows and on whether institutional interest in Ripple’s payments
ecosystem translates into something more meaningful. There’s a kind of tension
between short-term fear and long-term positioning in crypto, with ETF inflows
staying steady and exchange balances continuing to fall, exactly what I
associate with mid-cycle consolidation.”
|
Metric |
Value |
|
ETF cumulative inflows |
1.15B dollar+ |
|
Consecutive inflow days |
30 |
|
Exchange balance reduction |
45% (3.95B to 2.6B XRP) |
|
XRP |
Outperforming BTC ETFs |
The SEC
case resolution represents another foundational catalyst. The
Securities and Exchange Commission dropped its appeal against Ripple, and the
company agreed to a $50 million settlement without admitting wrongdoing. Judge
Analisa Torres clarified that XRP is not considered financial security when
sold on exchanges to retail investors, reducing legal uncertainty that had
weighed on xrp price for years.
This
regulatory clarity has encouraged institutional investors previously cautious
about the lawsuit against Ripple, improving market sentiment and creating room
for ETFs and other products to gain traction in the U.S crypto market.
XRP’s
long-term price outlook and predictions for XRP in 2030 depend heavily on
real-world utility as a cross-border settlement token. Ripple CEO Brad
Garlinghouse has stated that XRP could capture 14% of SWIFT’s global
transaction volume within five years, which would represent more than
2.8 trillion dollar in annual flows routed through the XRP Ledger.
While this
goal remains ambitious, even partial realization would significantly increase
demand for XRP as a bridge currency. However, skeptics highlight several
challenges:
For XRP to
justify the upper end of price forecasts, Ripple Labs must convert more
messaging-only clients into full On-Demand Liquidity users, directly linking
network adoption to demand for the token itself.
Macroeconomic
conditions will influence whether 2026 feels like consolidation or a new bull
phase for crypto. Expectations for Federal Reserve rate cuts toward
the 3.00-3.25% range could support risk assets, including cryptocurrencies, by
lowering the opportunity cost of holding volatile digital assets like XRP.
However, unexpected inflation spikes or recession risks could shift
institutional positioning away from crypto, impacting XRP price and trading
volume across exchanges.
The
traditional four-year Bitcoin cycle is also being questioned
as institutional ETFs change market structure. If the cycle moderates, crypto
market participants might see fewer extreme sell-offs, allowing long-term
holders of XRP to benefit from more stable bull markets. If the cycle persists,
however, 2026 could become a consolidation year where XRP trades sideways or
corrects, delaying more substantial rallies until the next cycle leg.
While the
bullish narrative around XRP price prediction 2026 is compelling, several key
risk factors may prevent XRP from reaching high-end targets like $8 or even $10.
The most
important structural risks include:
If XRP’s
real-world utility stagnates while the broader crypto space innovates, the
price trajectory may lag even in a broader bull run.
From my
technical analysis perspective, XRP faces several immediate challenges that
weigh on XRP sentiment:
These
conditions suggest that, even if long-term price forecasts remain bullish, XRP
price may see further underperformance against Bitcoin and Ethereum in early
2026.
Despite
numerous risks, XRP continues to attract attention from long-term holders,
institutional investors, and traders using XRP profit calculator tools to model
various scenarios for 2025, 2026, and 2030.
Key metrics
to monitor as part of a data-driven XRP investment thesis include:
Contrarian
investors may be attracted by the current Fear & Greed Index levels around
24-25 (Extreme Fear), which historically have preceded rebounds in the broader
crypto market. However, aligning entries with technical support levels such as $1.25-1.50
could improve risk-reward profiles compared with buying at current prices
purely based on optimistic forecasts.
Summarizing
the main 2026 price scenarios for XRP:
Each
scenario implies different risk profiles and requires close monitoring of
trading volume, institutional positioning, and macro conditions in the crypto
market.
Before
you leave, take a look at my earlier cryptocurrency analyses, and if you find
my work useful, consider following me on X.
I have also included a helpful FAQ section below.
XRP price
prediction for 2026 ranges from conservative institutional forecasts of 3
dollar to bullish targets of 8 dollar, with consensus averaging around 3.90
dollar. Standard Chartered’s Geoffrey Kendrick expects 8 dollar driven by ETF
flows and regulatory clarity, while technical analysis suggests a possible drop
toward 1.25 dollar before a recovery in Q2 2026.
XRP could
trade between 2.40 and 8 dollar by the end of 2026, with options data from Jeff
Anderson indicating a 25% probability of finishing above 2.40 dollar and a 10%
probability of exceeding 3.90 dollar [provided quotes]. Consensus forecasts
around 3.90 dollar balance bullish long-term price expectations with caution
about the token’s current bearish momentum and regulatory history.
Whether to
buy XRP depends on individual risk tolerance, time horizon, and conviction in
Ripple’s ability to convert regulatory clarity into real-world adoption. ETF
inflows, supportive court rulings in the SEC case, and institutional support
provide solid arguments for long-term investors, but the current technical
downtrend and potential move toward 1.25 dollar suggest waiting for clearer
bullish confirmation or more attractive price levels may be prudent for some
market participants. This article does not constitute financial advice.
Key
catalysts that could shape XRP’s price outlook include:
XRP price
is declining in December 2025 due to a combination of broad crypto market
weakness, bearish technical indicators such as the death cross, and
profit-taking after the 2024-2025 rally. Despite strong institutional support
via ETFs, short-term selling pressure and underperformance relative to bitcoin
and ethereum have weighed on xrp sentiment and market-wide evaluations of its
near-term potential.
Reaching 10
dollar in 2026 remains a low-probability scenario in institutional models,
although EGRAG Crypto’s Elliott Wave analysis allows for such levels in a
full-blown bull run. Achieving 10 dollar would imply a market cap approaching
600 billion dollar, requiring XRP to capture a much larger share of the crypto
market and cross-border payment flows than currently observed. Most forecasts
see 10 dollar as a potential longer-term target beyond 2026 rather than a
central scenario for the next 12 months.
XRP’s
all-time high is 3.84 dollar, reached in January 2018 at the peak of a previous
crypto bull run. In early 2025, XRP approached this level again when it surged
to around 3.50 dollar following Donald Trump’s election victory and subsequent
favorable regulatory developments, but it has since retreated to 1.85 dollar.
XRP ETFs
affect token price by removing significant supply from exchanges as providers
accumulate XRP to back shares, contributing to a 45% drop in exchange balances.
With over 1.15 billion dollar in ETF inflows and 30 consecutive days without
outflows, these structures have become central to any serious XRP price
prediction for 2026 and beyond. If inflows continue and reach 10 billion dollar
as Standard Chartered models, xrp price may see structural upward pressure
regardless of short-term volatility.
The price
of xrp has experienced dramatic swings since 2024, driven largely by the legal
battle with the SEC and broader crypto industry volatility. At the time of
writing, XRP trades at 1.87 dollar with a current value reflecting 49% decline
from its 2025 peak of 3.66 dollar. Throughout 2024, XRP tested multiple key
price points between 0.50 and 0.70 dollar as the legal battle outcome remained
uncertain, keeping institutional investors cautious.
The token
surged 580% between November 2024 and January 2025 following regulatory
clarity, reaching critical price points near 3.50 dollar before the recent
sell-off brought it back toward 1.80-1.90 dollar support levels. This
volatility pattern demonstrates how regulatory developments continue to drive
major price of xrp movements across the crypto industry, with the SEC case
resolution in 2025 marking an inflection point that allowed institutional
support through ETFs to emerge despite subsequent bearish technical pressure.
Ethereum (ETHUSD) currently trades at $2943.4, showing a slight decline of 0.19%. As crypto enthusiasts watch closely, the focus remains on whether ETH can rally towards its monthly target of $3086.8, especially with the RSI standing at 44.64. Let’s delve into the technical data and market dynamics propelling this price movement.
As of now, ETHUSD is priced at $2943.4, a minor dip of 0.19% from the previous close. The price fluctuation is between a low of $2915.01 and a high of $2954.97 today. Despite recent volatility, Ethereum has maintained an impressive year-to-date growth of 6.14%. The trading volume today is 33,314,264, noticeably below its average of 145,421,845, indicating reduced trading activity.
On the technical front, ETH is signaling mixed messages. The Relative Strength Index (RSI) is at 44.64, suggesting the asset is neither overbought nor oversold. The Moving Average Convergence Divergence (MACD) is at -94.20, while its signal line is -104.41, highlighting a possible bullish crossover if the trend continues. The Average Directional Index (ADX) stands at 34.21, indicating a strong trend persistence.
Looking ahead, Meyka AI suggests a monthly forecast for ETHUSD at $3086.8, reflecting investor optimism. The target aligns with the upcoming quarterly forecast of $3862.33. However, enthusiasts should remain cautious as macroeconomic changes, regulations, or unforeseen events could drastically affect market conditions.
ETH’s volatility remains pronounced with an Average True Range (ATR) of 205.92, signaling potential price swings. The Bollinger Bands currently range between $2757.05 and $3328.46, suggesting a broad trading band. Investors should consider these volatility indicators, particularly in uncertain markets.
In summary, Ethereum’s price journey towards $3086.8 is supported by strong technical trends and positive forecasts. While the current RSI and MACD suggest potential growth, investors should be wary of external factors that could sway this trajectory. As Meyka AI continues to monitor these dynamics, staying updated with market trends is advisable for informed decision-making.
The current price of Ethereum (ETHUSD) is $2943.4, with a slight decline of 0.19% from the previous close of $2948.92. For more information, visit ETHUSD.
The RSI is at 44.64, indicating a neutral zone, while the MACD suggests a potential bullish trend if conditions are met. The ADX confirms a strong trend.
Meyka AI forecasts Ethereum (ETHUSD) to reach a price target of $3086.8 for the month, reflecting optimistic sentiment among investors. However, this target is subject to market changes.
Ethereum’s current trading volume is 33,314,264, which is significantly below its average volume of 145,421,845, indicating lower current market activity.
The ATR is 205.92, and the range according to Bollinger Bands is between $2757.05 and $3328.46, highlighting existing market volatility and potential price swings.
Disclaimer:
Cryptocurrency markets are highly volatile. This content is for informational purposes only.
The Forecast Prediction Model is provided for informational purposes only and should not be considered financial advice.
Meyka AI PTY LTD provides market data and sentiment analysis, not financial advice.
Always do your own research and consider consulting a licensed financial advisor before making investment decisions.
Zach Anderson
Dec 29, 2025 07:01
MATIC price prediction shows potential breakout above $0.58 resistance could drive Polygon to $0.85 target, while failure risks drop to $0.33 support level.
Polygon (MATIC) finds itself at a critical juncture as 2025 concludes, trading at $0.38 after a significant decline from its 52-week high of $1.27. Our comprehensive MATIC price prediction analysis reveals a mixed technical picture with both bullish breakout potential and bearish continuation risks depending on key level interactions in the coming weeks.
• MATIC short-term target (1 week): $0.42 (+10.5%) if above $0.38 pivot
• Polygon medium-term forecast (1 month): $0.35-$0.58 trading range
• Key level to break for bullish continuation: $0.58 resistance zone
• Critical support if bearish: $0.33 strong support level
• Confidence Level: Medium for short-term, Low for extended forecasts
Recent analyst forecasts present a notably divergent view on MATIC’s trajectory. CoinCodex’s short-term predictions suggest minimal movement, with their MATIC price prediction targeting just $0.1040 by December 27, 2025 – a figure that appears disconnected from current market reality at $0.38. Their subsequent forecasts show a slight decline to $0.1015 by January 4, 2026, followed by a modest recovery to $0.1071 by January 25, 2026.
However, Benzinga’s longer-term Polygon forecast presents a more optimistic scenario, projecting $0.717 by 2030 with an anticipated 9.61% return on investment. This stark contrast between short-term bearish sentiment and long-term bullish outlook reflects the current uncertainty surrounding MATIC’s immediate direction.
The consensus among recent predictions leans cautiously bearish for the near term, though technical indicators suggest this pessimism may be overdone given MATIC’s current positioning relative to key support levels.
Our Polygon technical analysis reveals several compelling factors supporting a potential price reversal. MATIC’s RSI at 38.00 sits in neutral territory, avoiding oversold conditions that might indicate further downside pressure. The current price of $0.38 aligns precisely with the identified pivot point, suggesting this level may serve as a launching pad for the next directional move.
The Bollinger Bands configuration shows MATIC trading in the lower portion at 0.2879 position, indicating oversold conditions within the recent range. With the upper band at $0.56 and lower band at $0.31, MATIC has room for a significant bounce toward the middle band at $0.43.
MACD indicators present a mixed picture, with the histogram at -0.0045 showing bearish momentum, though the relatively shallow reading suggests weakening selling pressure. The 12-period EMA at $0.39 provides immediate resistance, while the 20-period SMA at $0.43 represents a key target for any recovery move.
Volume analysis from Binance spot trading shows $1,074,371 in 24-hour volume, indicating moderate but not exceptional interest. A breakout above $0.42 would likely require volume expansion to confirm the move’s sustainability.
The primary bullish scenario for our MATIC price prediction centers on a break above the immediate resistance at $0.58. This level has proven significant as both the immediate and strong resistance, making it the critical threshold for any meaningful rally.
MATIC price target sequence:
– Initial target: $0.42 (20-period SMA test)
– Secondary target: $0.45 (50-period SMA reclaim)
– Major target: $0.58 (key resistance break)
– Extended target: $0.85 (61.8% Fibonacci retracement from $1.27 high)
A successful break above $0.58 with volume confirmation could trigger algorithmic buying and short covering, potentially driving MATIC toward the $0.85 region by Q1 2026. This represents approximately 120% upside from current levels and would require sustained buying pressure across the broader cryptocurrency market.
The bearish scenario remains equally valid given MATIC’s proximity to key support levels. Failure to hold the current $0.38 pivot point could trigger a test of immediate support at $0.35, followed by the critical $0.33 strong support level.
Downside targets:
– Immediate risk: $0.35 (immediate support test)
– Major support: $0.33 (strong support level)
– Extended downside: $0.28 (psychological and technical support)
A break below $0.33 would likely accelerate selling pressure, potentially driving MATIC toward the $0.28 region where significant accumulation might emerge. This scenario aligns more closely with CoinCodex’s bearish predictions, though their specific price targets appear overly pessimistic.
Based on our Polygon technical analysis, the current risk-reward setup favors a cautiously bullish approach with strict risk management. The decision to buy or sell MATIC depends heavily on individual risk tolerance and investment timeframe.
Recommended entry strategy:
– Conservative entry: Wait for break above $0.42 with volume confirmation
– Aggressive entry: Current levels ($0.38) with tight stop-loss at $0.34
– DCA approach: Scale into positions between $0.35-$0.42 range
Risk management parameters:
– Stop-loss: $0.32 (below strong support with 2% buffer)
– Initial target: $0.58 (53% upside)
– Position size: Maximum 2-3% of portfolio given volatility
The 14-day ATR of $0.03 indicates moderate volatility, suggesting position sizes should account for potential 8-10% daily swings in either direction.
Our comprehensive MATIC price prediction suggests a critical decision point approaching for Polygon. The convergence of technical indicators around the $0.38 pivot level, combined with oversold positioning within Bollinger Bands, creates conditions favorable for a bounce attempt toward $0.42-$0.45 resistance.
Key prediction summary:
– Confidence Level: Medium for short-term upside to $0.42
– Timeline: 1-2 weeks for initial move development
– Critical level: $0.58 break needed for sustained rally
– Risk level: High given broader market uncertainty
The Polygon forecast remains highly dependent on broader cryptocurrency market conditions and Bitcoin’s direction. Traders should monitor the $0.38 pivot closely, as a decisive break in either direction will likely determine MATIC’s path through January 2026.
Indicators to watch:
– RSI movement above 45 (bullish momentum confirmation)
– MACD histogram reversal (momentum shift signal)
– Volume expansion on any breakout attempt
– Bitcoin correlation and broader market sentiment
While longer-term forecasts suggest potential for significant gains, near-term trading requires careful attention to the identified support and resistance levels, with the $0.33-$0.58 range likely containing price action through the first quarter of 2026.
Image source: Shutterstock
XRP price has remained under pressure over the past several weeks, with multiple recovery attempts failing to gain traction. As 2025 comes to an end, the altcoin continues to succumb to bearish momentum after recording a mildly negative year overall.
Weak spot demand and cautious retail participation have weighed on price action. However, institutional interest has emerged as XRP’s primary stabilizing force, preventing deeper drawdowns despite persistent selling.
Institutional investors have been XRP’s most consistent supporters throughout 2025. According to CoinShares data, XRP recorded $70 million in inflows during the week ending December 27. This pushed month-to-date inflows to $424 million, highlighting steady capital allocation even during periods of declining prices.
Sponsored
Sponsored
Notably, XRP outperformed larger digital assets during the same period. Bitcoin recorded $25 million in outflows, while Ethereum saw significantly higher outflows totaling $241 million.
Want more token insights like this? Sign up for Editor Harsh Notariya’s Daily Crypto Newsletter here.
On a yearly basis, XRP attracted $3.3 billion in inflows, highlighting sustained institutional confidence despite ongoing volatility and legal uncertainties surrounding the broader crypto market.
Institutional support has extended beyond traditional exchange-traded products following the launch of XRP ETFs earlier this year. Since their debut, XRP ETFs have not recorded a single day of net outflows. Only one trading session closed flat, without inflows, reflecting unusually strong consistency in demand.
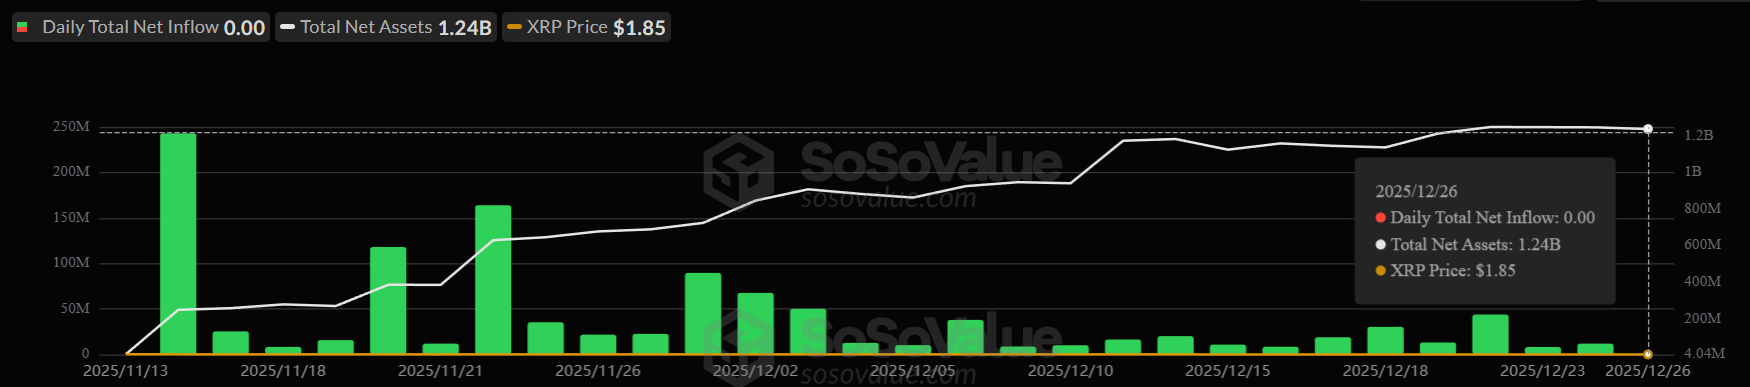
Sponsored
Sponsored
Speaking exclusively to BeInCrypto, Ray Youssef, CEO of crypto app NoOnes, emphasized that institutional investors are executing structured, long-term strategies.
“XRP’s early December accumulation was a strategic positioning by market participants to catch the ETF momentum upside. As with early Bitcoin and Ethereum ETF launch cycles, institutional investors often accumulate assets before their prices begin to reflect these developments,” Youssef noted.
He further stated that XRP is now observed as a high beta asset with a strong value proposition.
“[This] is thanks to the increased participation of institutional players in the asset’s trading, which is further mainstreaming the asset. Despite the prevailing price weakness, traders still consider the current price points as suitable entry opportunities to capture growth potential once XRP’s performance finally reflects the ETF’s momentum,” stated Youssef.
Long-term holders remain a critical cohort heading into 2026. Historically, this group has played a stabilizing role during market downturns. Over the past year, long-term holders alternated between accumulation and distribution, reflecting uncertainty around XRP’s medium-term prospects.
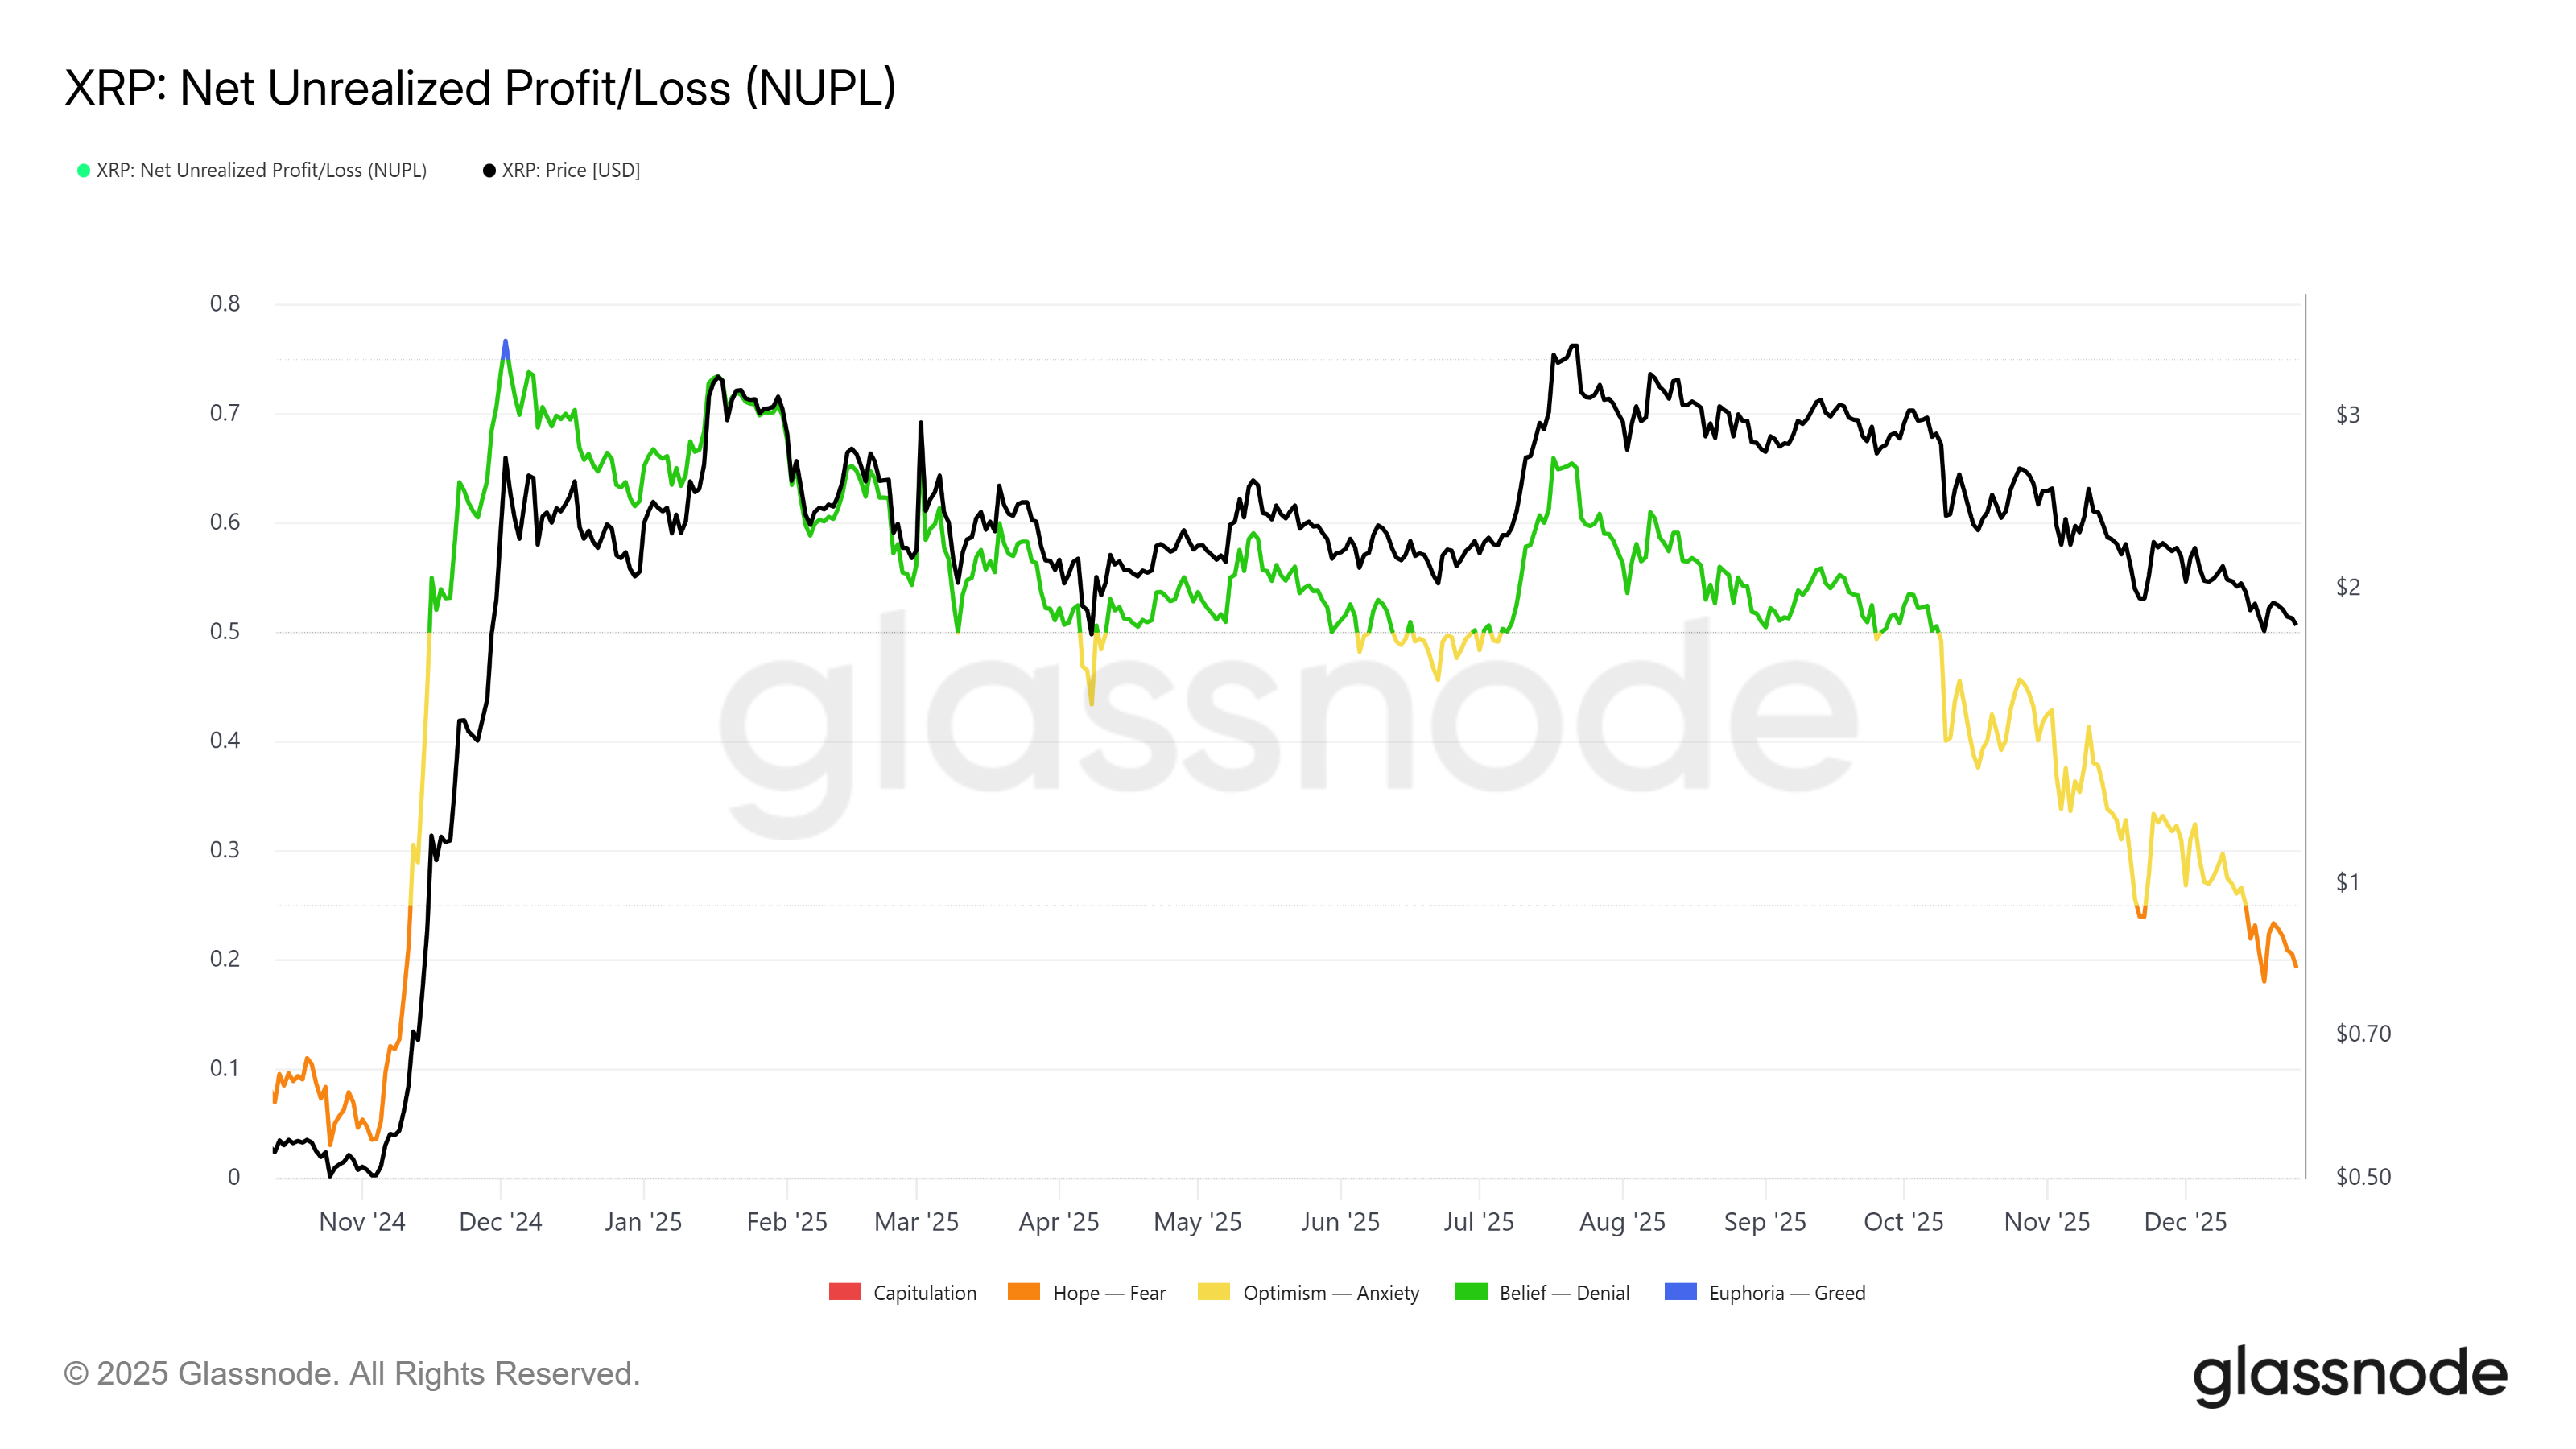
Sponsored
Sponsored
By Q4 2025, selling activity dominated long-term holder behavior. This shift suggests declining confidence among investors who typically hold through volatility. If this lack of conviction persists into 2026, XRP could face heightened downside risk. Sustained distribution from long-term holders often precedes extended consolidation or deeper corrections.
XRP price traded near $1.87 at the time of writing after suffering a 38% decline during Q4 2025. Year-to-date performance shows the altcoin down 9.7% from its opening price. December failed to generate positive momentum, reinforcing bearish sentiment as the year closed.
Despite this, 2026 may chart an independent course. Ray Youssef noted that January, and potentially the entire first quarter, could remain largely stagnant for XRP.
“XRP will likely continue to consolidate and trade between $2 and $2.50 in January and Q1 2026, unless a decisive macro catalyst emerges. The market has yet to recover from persistent volatility and geopolitical disruptions caused by the strained trade relations. The numerous deleveraging and risk-off episodes have made traders hesitant to increase directional exposure until the market headwinds have entirely dissipated,” Youssef highlighted.
The broader objective remains recovery of recent losses. A sustained move above $3.00 would be required to reestablish bullish structure and open a path toward the $3.66 all-time high.
Sponsored
Sponsored
Downside scenarios remain relevant if selling pressure intensifies. Continued consolidation combined with reduced demand could push XRP lower. A decisive break below the $1.79 support level would likely expose the $1.50 zone. Such a move would invalidate the bullish-neutral thesis and reinforce bearish dominance.
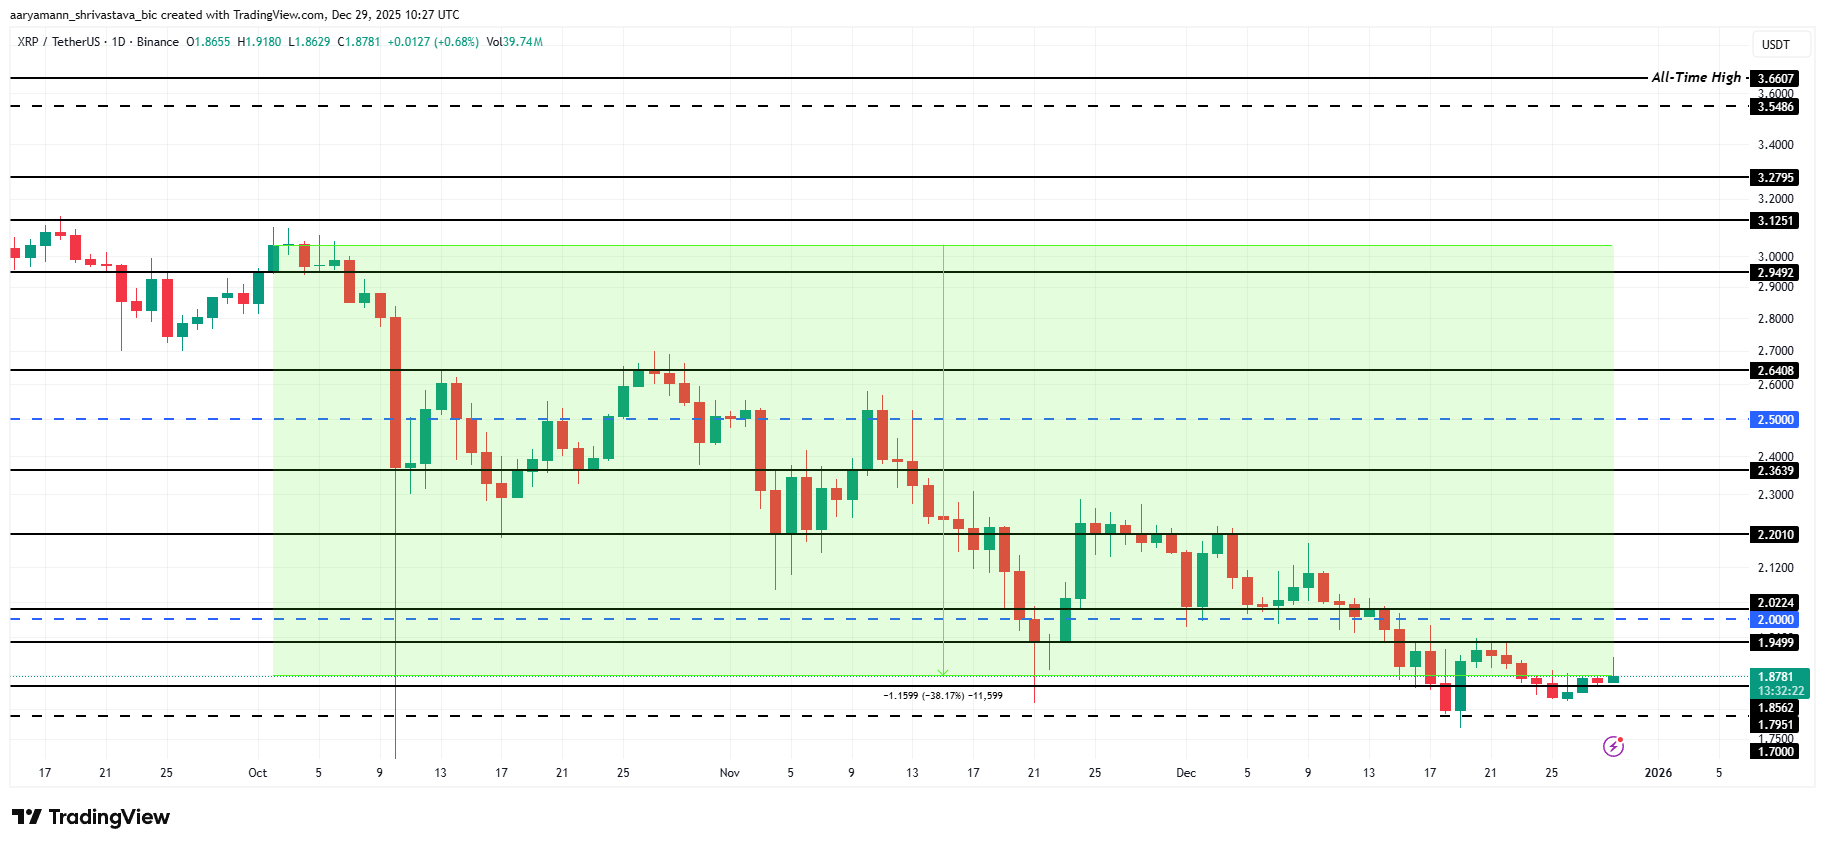
Seasonality adds another layer of caution.
“XRP underperformed in December due to the broader market’s structural weakness. Liquidity contraction, weak risk appetite, and the AI bubble scare sell-off, which spilled into high-risk assets and the entire digital asset market, curtailed the effects of the expected seasonal tailwinds. The crypto market saw one of its worst Q4 performances in almost 7 years,” Youssef further noted.
Historical XRP performance over the past 12 years shows that January delivers an average gain of 3%. However, the median return reflects a 7.8% decline, indicating frequent underperformance.
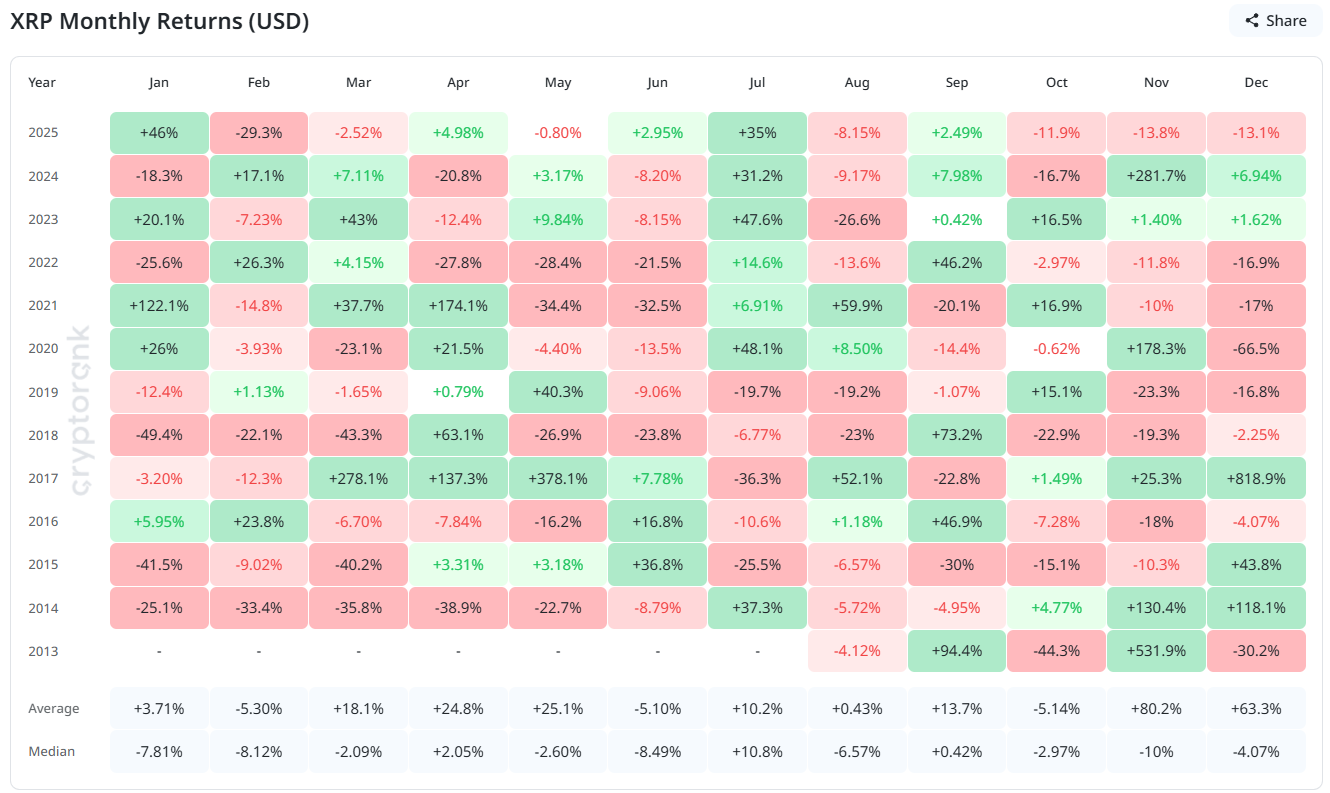
Thus, unless market sentiment and investor behavior shift significantly, XRP price prediction suggests that the price may struggle during the early months of 2026 before clearer directional trends emerge.
As of today, Bitcoin USD (BTCUSD) is trading at $87,877.29, experiencing a slight increase of 0.81%. The big question on traders’ minds now is whether Bitcoin can hit the $92,000 mark in the coming months. Let’s break down the current data, trends, and technical indicators to understand the possibilities.
Bitcoin’s current price stands at $87,877.29, with a daily range between $87,349.52 and $88,000. This aligns with a modest rise of 0.81%, or $705.61, over the last 24 hours. Bitcoin is significantly below its 50-day moving average of $91,712.54 and even further from its 200-day average of $107,608.47, indicating potential bearish sentiment in the short term. The market cap is a robust $1.73 trillion, supported by a relatively high volume of $15.16 billion compared to an average of $508 million.
Technical indicators show mixed signals for Bitcoin. The RSI is at 42.91, approaching the oversold territory, suggesting that a rebound might be possible. The MACD, with a value of -2355.42, reveals bearish momentum, but a positive histogram could indicate a potential crossover in the future. The ADX at 34.98 confirms a strong trend, although not specifying direction. The Bollinger Bands suggest that Bitcoin is near its middle band of $89,354.05, hinting at possible sideways movement. Forecasts can change due to macroeconomic shifts, regulations, or unexpected events affecting the crypto market.
Looking ahead, Meyka AI provides several forecasts: the monthly target is $91,771.03, while the quarterly projection is a bullish $137,052.42. However, the yearly prediction dips to $83,932.49, indicating uncertainty in long-term market conditions. Meanwhile, five-year estimates hover around $133,253.33, suggesting potential growth.
Recent news reports continue to highlight Bitcoin’s popularity among traders but emphasize uncertainty due to volatile market conditions. No significant new events have directly impacted Bitcoin in the last 24 hours, beyond slight market fluctuations. The trend, as indicated by volume spikes and technical indicators, underscores the market’s cautious optimism.
Bitcoin’s path to $92,000 is filled with both challenges and opportunities. While current technical indicators show mixed signals, the broader market forecasts suggest potential upside. Traders should remain vigilant, keeping an eye on macroeconomic developments and market trends for further clues about where BTCUSD is headed.
As of now, BTCUSD is priced at $87,877.29 with a 0.81% increase over the last day. Visit our detailed analysis page for more insights here.
Monthly targets are set at $91,771.03, while quarterly forecasts suggest a rise to $137,052.42. Long-term projections estimate a price of $133,253.33 over five years.
Technical indicators present mixed signals. The RSI suggests possible room for a rebound, while the MACD shows bearish momentum, indicating caution is warranted.
Bitcoin’s performance is impacted by various market sentiments and simple updates, with no major events altering its recent trajectory significantly. Volatility remains a key factor.
With mixed technical signals and a cautious yet optimistic market forecast, Bitcoin reaching $92,000 depends on multiple factors including macroeconomic conditions.
Disclaimer:
Cryptocurrency markets are highly volatile. This content is for informational purposes only.
The Forecast Prediction Model is provided for informational purposes only and should not be considered financial advice.
Meyka AI PTY LTD provides market data and sentiment analysis, not financial advice.
Always do your own research and consider consulting a licensed financial advisor before making investment decisions.

 vs Cardano (ADA) Price Prediction 2026: Top")


