The main tag of Cryptocurrency price Articles.
You can use the search box below to find what you need.
[wd_asp id=1]
The main tag of Cryptocurrency price Articles.
You can use the search box below to find what you need.
[wd_asp id=1]
Solana price remained in a deep bear market this month, falling to a low of $120, its lowest level since April 25. It has plunged by over 50% from its highest point this year, shedding billions of dollars in value, despite some major catalysts.
The SOL token price has been in a strong downward trend in the past few months, a move that has coincided with the ongoing crypto market crash.
It has crashed despite the chain having some major catalysts, including its rising transactions and fees.
Third-party data shows that Solana handles the most transactions, partly because of its strength in the meme coin industry. Its monthly active users (MAU) stand at 98 million, much higher than BNB Chain’s 26 million and Ethereum’s 8 million.
Solana also handles more transactions than other networks. It has handled over 34 billion transactions in the last 12 months, much higher than Ethereum’s and BNB Chain’s 516 million and 4 billion, respectively.
#Solana continues to rank first across most major blockchain metrics over a 1 year period, despite memecoin cool off.

Nansen data shows that Solana’s market share in terms of transactions has continued growing in the past few weeks, soaring to over 1.8 billion. These transactions are much more than those handled by the other large chains, combined.
Solana also made more money than other chains, with its fees soaring to $728 million, much higher than Ethereum’s and BNB’s $601 million and $260 million, respectively. Most of this growth happened in the first half of the year as the meme coin boom happened.
Meanwhile, more data shows that Solana was the most active networks in the decentralized exchange (DEX) industry. Its DEX volume in the last 12 months rose to $1.6 trillion, also much higher than the other chains.
Solana’s network is also benefiting from the ongoing ETF demand. Data compiled by SoSoValue shows that SOL ETFs added $66.5 million in inflows last week, bringing its cumulative inflows to $742 million and its total assets rising to $946 million. These funds have had inflows in the last eight consecutive weeks.

Looking ahead, Solana is working to implement its Alpenglow upgrade, which will boost its performance. It will increase the network’s maximum throughput from 65,000 to 107,000 transactions per second (TPS).
Alpenglow will cut its consensus finality from 12.8 seconds to 100-150 milliseconds, which will be faster than a Google search.
It will also lower its validation costs by 50% and transition from a proof-of-authority to a proof-of-stake, introducing the votor and rotor systems.

The daily timeframe chart shows that the Solana token dropped from a high of $252.55 in September to the current $126.57.
SOL token formed a death cross pattern as the 50-day and 200-day Exponential Moving Averages (EMA) crossed each other in November.
The token has formed a bearish flag pattern, which is made up of a vertical line and an ascending channel. It has moved slightly below the lower side of this pattern.
Solana price has moved below the Supertrend indicator, a sign that the token will continue falling. Therefore, the token will drop to the key support level at $95, its lowest level in April this year. A move above the 50-day moving average at $142 will invalidate the bearish outlook.
The post Solana price prediction: at risk despite rising transactions, ETF inflows appeared first on Invezz
This week, traders enter a holiday-shortened session with fewer catalysts but a handful of meaningful macro data points. The U.S. stock markets will pause early for Christmas, yet the upcoming GDP release, consumer confidence survey, and jobless claims still carry enough weight to influence crypto market. In such low-volume conditions, even small shifts in risk appetite could nudge Ethereum price direction before the year ends.
Ethereum price is trading around $3,019, up about 1.3% on the day. The chart shows ETH consolidating near the lower Bollinger Band in early December but now recovering toward the middle band around $3,064. This zone has acted as both a short-term resistance and psychological barrier over the past two weeks. The key takeaway: ETH price is trying to reclaim stability after its recent downtrend, but the upside momentum remains tentative.
The Bollinger Bands are slightly narrowing, hinting that volatility is compressing. Historically, such squeezes often precede larger directional moves. If bulls manage to close daily candles above $3,100, it could trigger short-covering and invite a push toward the upper band near $3,300. However, failure to sustain above $3,000 risks another slide toward $2,850 and potentially $2,700, which align with support zones from early December.
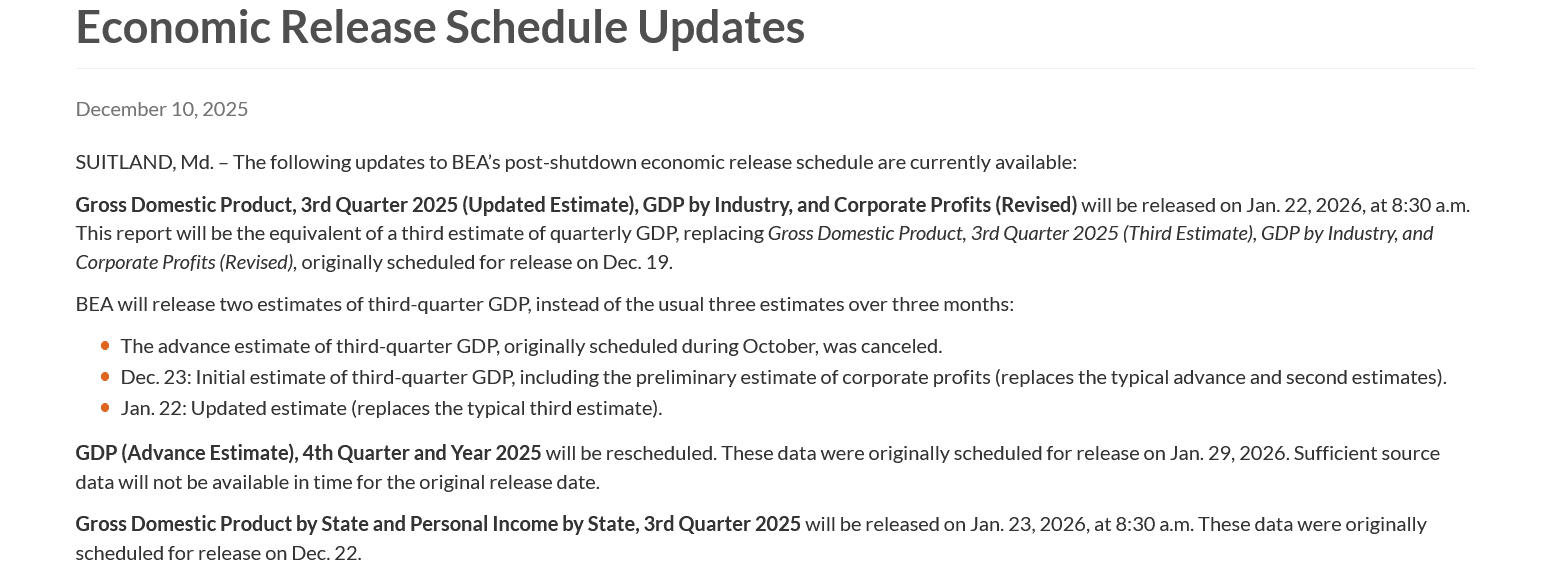
The Q3 GDP report and December consumer confidence number will test investor sentiment. Strong GDP growth could reinforce optimism about economic resilience, indirectly supporting risk assets like ETH. But if consumer confidence or jobless claims signal weakness, traders might rotate back into defensive positions.
In a low-liquidity holiday week, macro headlines often cause outsized reactions. A better-than-expected GDP reading might briefly push ETH higher as traders bet on sustained demand for digital assets amid stable growth. Conversely, any sign of economic slowdown could trigger risk-off moves across equities and crypto alike.
Ethereum price recent candles show modest buying interest returning, but volume remains thin. The 20-day SMA at $3,064 serves as a pivotal level—closing above it would strengthen the short-term bullish case. The next hurdle lies at $3,304, which coincides with the upper Bollinger Band and late-November resistance.
Below, the $2,820–$2,850 zone marks a strong support cluster. A break below that range would expose ETH price to deeper losses toward $2,600 and even $2,400, as visible from the dotted support levels in the chart.
Given the muted holiday volume, ETH price could continue oscillating between $2,950 and $3,100 until fresh liquidity returns next week. A decisive close above $3,100 would set the stage for a short-term breakout rally into the $3,250–$3,300 range, while rejection at that level might confirm the ongoing sideways structure.
Macro data will likely dictate the tone. If GDP surprises to the upside, ETH price may test the upper Bollinger Band before the year closes. But if sentiment weakens, the coin could revisit the lower end of its range near $2,850.
Ethereum price looks steadier than it did a few weeks ago, but conviction is still lacking. The chart suggests consolidation rather than a trend reversal. The most probable scenario this week is a contained range, followed by a stronger move post-holiday as traders reposition for January.
If $ETH closes the week above $3,100, momentum could carry it to $3,300–$3,400 in early January. But if it slips back below $2,900, expect another test of the lower support band before a meaningful recovery.
In short, the next few days may feel quiet—but under the surface, Ethereum price is coiling for its next big move.
Bitcoin (BTC), Ethereum (ETH), and Ripple (XRP) are approaching key technical levels at the time of writing on Monday as the broader crypto market stabilizes. Market participants are closely watching whether BTC, ETH, and XRP can sustain breakouts and achieve decisive daily closes above nearby resistance levels, which could signal the start of a short-term recovery.
Bitcoin price was retested and found support at the 78.60% Fibonacci retracement level at $85,869 on Thursday, and it recovered 3.67% over the next three days. As of Monday, BTC is approaching the descending trendline (drawn by connecting multiple highs since October 6).
If BTC breaks above the declining trendline and closes above the $90,000, it could extend the recovery toward the next resistance at $94,253.
The Relative Strength Index (RSI) reads 45, pointing upward toward the neutral level of 50, indicating early signs of fading bearish momentum. For the bullish momentum to be sustained, the RSI must move above the neutral level. Moreover, the Moving Average Convergence Divergence (MACD) indicator showed a bullish crossover on Saturday, further supporting the recovery thesis.
On the other hand, if BTC faces a correction, it could extend the decline toward the key support at $85,569.
Ethereum price was retested on Thursday and found support around the descending trendline, and it recovered nearly 6% over the next three days. As of Monday, ETH is approaching the daily resistance level at $3,017.
If ETH closes above $3,017 on a daily basis, it could extend the recovery toward the December 10 high at $3,447.
The RSI reads 47, pointing upward toward the neutral level of 50, indicating early signs of fading bearish momentum. For the bullish momentum to be sustained, the RSI must move above the neutral level. Moreover, the Moving Average Convergence Divergence (MACD) lines are converging, and a flip to a bullish crossover would further support the bullish outlook.

On the other hand, if ETH is rejected, it could extend the decline toward the key support at $2,749.
XRP was retested and found support around the lower trendline boundary of a falling wedge pattern on Friday, and recovered slightly the next day. As of Monday, XRP is approaching the daily resistance at $1.96.
If XRP closes above the daily resistance at $1.96 on a daily basis, it could extend the recovery toward the 50-day EMA at $2.13.
The RSI on the daily chart reads 42 below its neutral level of 50, indicating bearish momentum. The Moving Average Convergence Divergence (MACD) is showing a bullish crossover on Monday, indicating early signs of bullish momentum.

However, if XRP faces a correction, it could extend the decline toward Friday’s low of $1.77.
BitcoinWorld
Cardano Price Prediction: Will ADA Explode to $2 by 2030?
As the cryptocurrency market continues to evolve, investors are eagerly watching Cardano’s ADA token. With its unique proof-of-stake consensus mechanism and strong development roadmap, many are wondering: could ADA reach the coveted $2 mark in the coming years? This comprehensive analysis examines Cardano price predictions from 2026 through 2030, combining technical analysis, market trends, and expert insights to give you a clear picture of ADA’s potential trajectory.
Cardano stands as one of the most established blockchain platforms in the cryptocurrency space. Founded by Charles Hoskinson, co-founder of Ethereum, Cardano has built a reputation for its research-driven approach and peer-reviewed development process. As of current market conditions, ADA maintains a strong position among top cryptocurrencies by market capitalization, but what does this mean for future price movements?
The platform’s transition to a proof-of-stake consensus mechanism through its Ouroboros protocol has positioned it as an energy-efficient alternative to proof-of-work blockchains. This fundamental advantage, combined with ongoing development through the Basho and Voltaire eras, creates a solid foundation for potential growth.
Looking ahead to 2026, several factors will influence ADA’s price trajectory. Market analysts consider both technical indicators and fundamental developments when making their Cardano price prediction for this period.
Key factors for 2026 include:
Most conservative estimates suggest ADA could trade between $0.80 and $1.20 by 2026, assuming steady platform growth and favorable market conditions. More optimistic projections, based on accelerated adoption and successful implementation of Cardano’s roadmap, suggest potential highs approaching $1.50.
The year 2027 represents a crucial period for Cardano’s long-term trajectory. By this time, the platform should have fully implemented its Voltaire governance system, allowing ADA holders to participate directly in network decisions. This increased utility could significantly impact the ADA price.
| Scenario | Low Estimate | High Estimate |
|---|---|---|
| Conservative | $1.00 | $1.40 |
| Moderate | $1.20 | $1.80 |
| Optimistic | $1.50 | $2.20 |
These projections assume continued development success and growing institutional interest in proof-of-stake cryptocurrencies. The cryptocurrency forecast for 2027 heavily depends on Cardano’s ability to attract and retain developers, as well as the platform’s performance relative to competitors like Ethereum and Solana.
Looking further ahead to 2030, the Cardano 2030 outlook becomes both more speculative and potentially more exciting. Long-term predictions must account for technological advancements, regulatory landscapes, and broader economic factors that are difficult to forecast with precision.
Several scenarios could unfold:
The most compelling question remains: Will ADA hit $2? Based on current trajectories and assuming successful execution of Cardano’s development roadmap, reaching $2 by 2030 appears achievable, though not guaranteed. The $2 milestone represents approximately a 4x increase from current levels, which aligns with historical cryptocurrency growth patterns for established projects with strong fundamentals.
Several developments could propel ADA beyond current predictions:
Institutional Adoption: Increased investment from traditional financial institutions could dramatically increase demand for ADA. As proof-of-stake assets gain regulatory clarity, more institutional investors may enter the Cardano ecosystem.
Technological Breakthroughs: Successful implementation of Cardano’s scaling solutions and interoperability features could position ADA as a leading platform for decentralized finance and other applications.
Market Cycles: Cryptocurrency markets historically move in cycles. A major bull market coinciding with Cardano’s development milestones could create perfect conditions for significant price appreciation.
While the Cardano price prediction outlook appears promising, investors must consider potential challenges:
Competition: Cardano faces intense competition from other smart contract platforms. Ethereum’s continued development, along with emerging layer-1 and layer-2 solutions, could limit Cardano’s market share.
Regulatory Uncertainty: Changing regulatory landscapes, particularly regarding proof-of-stake assets and securities classification, could impact ADA’s price and adoption.
Execution Risk: Cardano’s development timeline has historically been deliberate. Any significant delays or technical challenges could affect market confidence and price performance.
Leading cryptocurrency analysts offer varied perspectives on ADA’s future. While some emphasize Cardano’s strong fundamentals and research-based approach, others caution about the competitive landscape. Most agree that Cardano’s success depends on execution of its roadmap and ability to attract developers and users to its ecosystem.
The overall cryptocurrency forecast for ADA remains cautiously optimistic, with many experts believing the platform’s unique approach could pay dividends in the long term, particularly as environmental concerns make proof-of-stake mechanisms more attractive to institutional investors.
Based on current Cardano price prediction models and market analysis:
1. Consider dollar-cost averaging rather than timing the market
2. Monitor Cardano’s development progress through official channels
3. Diversify within the cryptocurrency sector
4. Stay informed about regulatory developments affecting proof-of-stake assets
5. Set realistic expectations based on your investment horizon
What is the highest price Cardano could reach by 2030?
While predictions vary, some optimistic models suggest ADA could reach $5-$10 by 2030 under ideal conditions, though most analysts project more conservative targets in the $2-$4 range.
Who founded Cardano?
Cardano was founded by Charles Hoskinson, who also co-founded Ethereum. The project is developed by Input Output Hong Kong (IOHK).
How does Cardano differ from Ethereum?
Cardano uses a proof-of-stake consensus mechanism called Ouroboros, while Ethereum recently transitioned from proof-of-work to proof-of-stake. Cardano also emphasizes peer-reviewed research and formal methods in its development process.
What factors most influence ADA price?
Key factors include overall cryptocurrency market trends, Cardano platform adoption, technological developments, regulatory changes, and competition from other blockchain platforms.
Is Cardano a good long-term investment?
Many analysts view Cardano as a promising long-term investment due to its strong fundamentals and research-based approach, though all cryptocurrency investments carry significant risk and volatility.
The journey toward ADA reaching $2 involves multiple factors aligning favorably. Cardano’s deliberate development approach, combined with growing recognition of proof-of-stake advantages, creates a compelling case for long-term growth. While reaching $2 by 2030 appears within reach based on current projections, investors should remain aware of market volatility and the competitive landscape.
Cardano’s success ultimately depends on execution—transforming its technological promise into real-world adoption. As the platform continues to develop and the broader cryptocurrency market evolves, ADA’s price trajectory will reflect both Cardano’s specific achievements and general market conditions. For investors with a long-term perspective and risk tolerance, Cardano represents an intriguing opportunity in the evolving blockchain ecosystem.
To learn more about the latest cryptocurrency markets trends, explore our article on key developments shaping blockchain technology and digital asset adoption.
This post Cardano Price Prediction: Will ADA Explode to $2 by 2030? first appeared on BitcoinWorld.
XRP price today is showing signs of stability following recent volatility, with market data indicating that buyers are actively defending a key support zone around $1.92.
According to Binance trading data at the time of writing, XRP was trading near $1.92, reflecting a 0.31% increase over 24 hours, while daily trading volume exceeded $2.23 billion. Analysts note that this pattern suggests absorption at lower levels rather than panic selling or aggressive speculation.
Higher-timeframe technical analyst ChartNerd noted that XRP remains structurally intact, holding above the monthly 20-period exponential moving average (EMA). He explained on X: “$XRP still maintains a bullish structure above its monthly 20 EMA and multi-month trading range support. No confirmation breakdown has taken place.”
XRP stays above its monthly 20 EMA and multi-month support, with no confirmed breakdown, indicating continued bullish structure. Source: @ChartNerdTA via X
The 20-month EMA is closely followed by long-term traders as a key trend filter. Historically, XRP’s repeated defense of this level has often coincided with declining sell-side volume and gradual accumulation, rather than immediate reversals. While the EMA typically acts as structural support, breaks below it in past cycles have accelerated downside sharply. Holding above $1.92–$1.93 suggests that longer-term bullish positioning remains intact, even amid short-term fluctuations.
Historical price charts indicate that prior consolidation zones near monthly EMA support preceded meaningful upward moves. However, analysts caution that past patterns are not guarantees and should be interpreted alongside current volume and trendline behavior.
On lower timeframes, XRP has been navigating descending trendlines, yet downside momentum appears limited. Crypto market commentator Broke Doomer highlighted that repeated tests of support are being met with consistent buying pressure: “Each tap of support is getting bought,” he stated, adding that seller follow-through has diminished. “This is a strong low,” he noted, suggesting potential for a momentum shift if structure holds.

XRP holds $1.92 support, with analysts noting strong buying and potential to reclaim $2.20–$2.60. Source: @im_BrokeDoomer via X
This scenario aligns with observed absorption patterns, where short-term sellers exhaust themselves while buyers defend critical levels. Analysts emphasize that this does not confirm a trend reversal but signals stability at the current support zone.
Technical analyst CobraVanguard of TradingView noted that XRP could experience a corrective bounce if buyers continue to support current levels. He added that a break above the prevailing red trendline could open the door to previously identified higher price ranges. Until such confirmation occurs, XRP’s market remains reactive, balancing buying interest against resistance pressure.

XRP may see a minor bounce with buyer support, while a break above the red trendline could open higher price ranges. Source: CobraVanguard on TradingView
Examining intraday wick patterns and order flow, analysts observe that buying interest absorbs selling at $1.92, a key indicator of stabilization rather than panic liquidation. For short-term traders, this provides a reference point for bullish defense, while higher-timeframe holders monitor structural support.
XRP’s current price action reflects a market in balance, with buying pressure absorbing sellers near the $1.92 support level and long-term 20-month EMA. Analysts highlight that sustained defense of these levels supports broader structural integrity, but confirmation through a decisive breakout above descending resistance is still required.

XRP was trading at around 1.92, up 0.31% in the last 24 hours at press time. Source: XRP price via Brave New Coin
For traders, a sustained daily close below $1.92 would undermine the absorption thesis and suggest potential short-term weakness, while reclaiming key trendline resistance could strengthen the case for trend continuation. Observing volume, wick behavior, and higher-timeframe indicators will remain crucial as XRP navigates this critical zone.
Solana price trades near the crucial $120–$130 support zone as bearish sentiment and technical pressure persist, with participants watching closely to see whether price holds or breaks lower.
Solana price continues to trade under pressure as the price consolidates near the $125 level, a zone that has increasingly come into focus amid growing bearish sentiment across the market. While some investors view the pullback as an opportunity, multiple market watchers caution that technical structure has yet to show convincing signs of strength.
With sentiment deteriorating and price struggling to reclaim key levels, SOL’s near-term direction remains closely tied to how it behaves around current support.
Market sentiment around Solana has turned increasingly negative, a shift highlighted by Immortal. One widely shared post noted that broader market hostility towards SOL has resurfaced, framing the current pullback as another phase of pessimism rather than outright capitulation.
Market sentiment around Solana turns negative again. Source: Immortal via X
Historically, such sentiment extremes have often coincided with late-stage corrections, though sentiment alone does not confirm a price bottom. Instead, it adds context to the broader risk environment surrounding SOL at current levels.
Broader market risk has also weighed on Solana. A report shared by Coin Bureau referenced Fundstrat’s outlook for a potential crypto market correction in the first half of 2026. Under this scenario, downside targets for major assets were outlined, including a $50–$75 range for Solana.
While these projections represent a base-case scenario rather than a definitive forecast, they have contributed to caution across the altcoin market. Analysts emphasize that such macro views are conditional and depend heavily on broader liquidity and risk sentiment.

Fundstrat outlines bearish downside scenarios for major crypto assets. Source: Coin Bureau via X
From a technical perspective, analysts remain cautious. According to Crypto Chiefs, Solana is still trading within a descending channel, suggesting that the broader trend remains under pressure. The analysis noted that if the channel continues to hold, SOL could still explore levels below $120 before encountering stronger support.

Solana price trades inside a descending channel with downside risk below $120. Source: Crypto Chiefs via X
This structure reinforces the importance of the current support zone, with price behavior here likely to dictate whether SOL stabilizes or extends lower in the near term.
Adding to the cautious Solana outlook, Trader Chase highlighted that continued trading below the $126 level keeps bearish scenarios active. His chart shows SOL Solana price struggling beneath descending trendline resistance, with the potential for further downside if price fails to reclaim key overhead levels.

SOL remains capped below descending resistance. Source: Trader Chase via X
While the analysis outlines bearish continuation risks, it remains conditional on price action. A strong reclaim above resistance would be required to invalidate the current structure.
As of December 21, 2025, Solana is trading around $125, sitting just above a key support zone between $125 and $120. This area is acting as the primary demand region on the chart. If this support continues to hold, SOL could see a recovery move towards the $133 level, followed by the $140 resistance zone.

Solana current price is $125.69, down -0.14% in the last 24 hours. Source: Brave New Coin
However, a clear breakdown below $120 would weaken the structure. In that scenario, downside targets shift towards $111 initially, with $100 as the next major psychological level. Below that, the $90 region stands out as the next key support zone based on prior price reactions.
Solana price is navigating a technically sensitive period as price consolidates near the $120–$130 support zone amid bearish sentiment and unresolved structural pressure. While current levels have drawn attention from participants, confirmation through price action remains essential.
A sustained break below support could expose SOL to deeper downside, while holding this region may allow for some recovery. Until a clearer structure emerges, Solana’s outlook remains conditional, with participants closely watching how the price reacts around these key levels.
The market experts appear to be staying bullish on the Bitcoin price prediction to $100,000 despite the stagnant movement of the flagship crypto. For context, BTC price has continued to consolidate over the past few days and struggled to break through the $90,000 mark.
However, as per market analysts, the crypto might be nearing the end of its bearish phase, suggesting a strong recovery ahead. Considering that, the market experts are keeping close track of the fundamental developments in the market that may influence the movement of the broader market ahead.
For context, the Bank of Japan (BoJ) rate hike has recently caught the eyes of the traders. However, it seems that the news was already priced in and didn’t have any major impact on the BTC price.
On the other hand, the anticipation over a potential Santa rally for the Bitcoin USD price has further fueled market sentiment. So, here we explore the key Bitcoin price levels that may hint at the potential future movement of the asset.
The latest Bitcoin price prediction of $100k comes as BTC price recorded a slight gain of 0.5% today. During writing, BTC USD price exchanged hands at $88,600, but its trading volume fell 53% to $16 billion.
Notably, the crypto has consolidated between $87,850 and $89,027 in the last 24 hours. Over the past 30 days, the crypto has touched a high of $94,601 and a low of $80,659, reflecting the highly volatile scenario in the market.
Meanwhile, it seems that the waning institutional interest has also weighed on the broader market sentiment. For context, the US Spot Bitcoin ETF has recorded an outflow of $158.3 million on December 19.
The outflow was led by BlackRock IBIT, which alone has contributed $173.6 million to the overall outflow on December 19. Besides, the weekly outflow into the investment instrument was recorded at $497 million, with only one day of inflow.

Amid the topsy-turvy scenario in the market, experts have continued to back the $100k Bitcoin price prediction, which has caught the eyes of traders. For context, in a recent X post, analyst Ted noted that the current consolidation phase of the BTC USD price is likely to continue through the weekend.
In addition, he said that the next week would be “very crucial” for the Bitcoin price and may witness downside volatility. Despite that, the expert said that the crypto may witness a quick reversal following the downside trend.

His chart even hints at a potential BTC price surge to $98,000 or even $102,000 in the reversal phase. Echoing a similar sentiment, analyst Captain Faibik said that the Bitcoin correction is “complete,” hinting at a potential surge ahead.

Notably, the chart that he shared indicates a potential Bitcoin price surge to $120,000. This suggests that despite the consolidation phase now, BTC USD price is gearing up for a strong reversal ahead, potentially to target the $100k resistance.
The post Bitcoin Price Prediction to $100k: Here’s the Key Levels to Watch appeared first on The Coin Republic.
BitcoinWorld
Dogecoin Price Prediction 2026-2030: The Realistic Path to $1 Revealed
Will Dogecoin, the cryptocurrency that started as a joke, finally reach the elusive $1 mark? As we look toward 2026, 2027, and beyond, millions of investors are asking this crucial question. Our comprehensive Dogecoin price prediction analyzes market trends, adoption drivers, and technical factors to reveal whether DOGE can realistically achieve this milestone.
Dogecoin occupies a unique space in the cryptocurrency ecosystem. Originally created in 2013 by Billy Markus and Jackson Palmer as a lighthearted alternative to Bitcoin, DOGE has evolved into a serious digital asset with a massive community. The coin’s inflationary supply model, with 5 billion new coins minted annually, creates different economic dynamics than deflationary cryptocurrencies.
By 2026, several factors will influence Dogecoin’s price trajectory. Our analysis considers three potential scenarios:
| Scenario | Price Range | Key Drivers |
|---|---|---|
| Bullish | $0.45 – $0.75 | Major exchange adoption, Elon Musk integration |
| Moderate | $0.25 – $0.40 | Steady growth, retail adoption |
| Bearish | $0.10 – $0.20 | Market downturn, regulatory pressure |
The most likely outcome for our Dogecoin price prediction 2026 falls in the moderate range, assuming continued development and gradual adoption. The DOGE price forecast depends heavily on broader cryptocurrency market conditions and specific Dogecoin developments.
Looking further ahead to 2027, several developments could significantly impact Dogecoin’s value:
Our DOGE price forecast for 2027 suggests a range of $0.35 to $0.65 under favorable conditions. The Dogecoin 2026 foundation will be crucial for this growth phase.
The question on every investor’s mind: Can Dogecoin reach $1 by 2030? Let’s examine the mathematics and market dynamics required:
For Dogecoin to reach $1, its market capitalization would need to approach approximately $140 billion at current circulating supply levels. This represents significant growth but remains within the realm of possibility given cryptocurrency market expansion. Key requirements include:
Our Dogecoin 2030 analysis suggests that while challenging, the $1 target is achievable under optimal conditions. The DOGE $1 target represents more than just a price milestone—it symbolizes mainstream cryptocurrency acceptance.
The path to $1 depends on several interconnected factors. First, broader cryptocurrency adoption must continue accelerating. Second, Dogecoin needs to maintain its cultural relevance and community strength. Third, practical utility must increase through merchant adoption and technological improvements.
Historical patterns show that Dogecoin often follows Bitcoin’s market movements while amplifying them. This correlation means that a strong Bitcoin bull market could propel DOGE toward its $1 target faster than expected. However, the inflationary supply presents a constant selling pressure that must be overcome by demand.
While optimistic about Dogecoin’s potential, we must acknowledge significant challenges:
These factors create headwinds that could delay or prevent Dogecoin from reaching $1. Investors should consider these risks alongside the potential rewards.
Based on our Dogecoin price prediction analysis, here are practical steps for interested investors:
Remember that all cryptocurrency investments carry risk, and you should never invest more than you can afford to lose.
What is the most realistic Dogecoin price prediction for 2026?
Our analysis suggests a moderate range of $0.25 to $0.40 for Dogecoin in 2026, assuming steady growth and continued development.
Can Dogecoin realistically reach $1 by 2030?
Yes, but it requires optimal conditions including mass adoption, favorable regulations, and sustained community support. The DOGE $1 target is challenging but achievable.
Who are the key figures influencing Dogecoin’s price?
Elon Musk, CEO of Tesla and SpaceX, has significantly impacted Dogecoin through his public statements. The original creators, Billy Markus and Jackson Palmer, also remain influential figures in the community.
How does Dogecoin’s inflation affect its price potential?
The 5 billion new DOGE created annually creates constant selling pressure that must be overcome by increasing demand. This makes sustained adoption crucial for price appreciation.
What companies accept Dogecoin as payment?
Several companies have accepted Dogecoin, including Tesla for merchandise at various times, AMC Theatres, and various online retailers through payment processors.
Our comprehensive analysis reveals that Dogecoin’s journey to $1 is paved with both opportunity and challenge. The Dogecoin price prediction for 2026-2030 shows gradual appreciation potential, with the $1 target representing an ambitious but possible milestone by 2030. Success depends on continued community support, technological development, and broader cryptocurrency adoption.
Dogecoin has repeatedly defied expectations since its creation. While our DOGE price forecast provides data-driven projections, the cryptocurrency market remains unpredictable. The most important factor may be Dogecoin’s unique ability to capture public imagination—a quality that could propel it to heights that pure technical analysis cannot predict.
To learn more about the latest cryptocurrency market trends, explore our article on key developments shaping Bitcoin, Ethereum, and other major digital assets and their potential impact on meme coins like Dogecoin.
This post Dogecoin Price Prediction 2026-2030: The Realistic Path to $1 Revealed first appeared on BitcoinWorld.
BitcoinWorld
Cardano Price Prediction: Will ADA Explode to $2 by 2030?
As the cryptocurrency market continues to evolve, investors are eagerly watching Cardano’s ADA token. With its unique proof-of-stake consensus mechanism and strong development roadmap, many are wondering: could ADA reach the coveted $2 mark in the coming years? This comprehensive analysis examines Cardano price predictions from 2026 through 2030, combining technical analysis, market trends, and expert insights to give you a clear picture of ADA’s potential trajectory.
Cardano stands as one of the most established blockchain platforms in the cryptocurrency space. Founded by Charles Hoskinson, co-founder of Ethereum, Cardano has built a reputation for its research-driven approach and peer-reviewed development process. As of current market conditions, ADA maintains a strong position among top cryptocurrencies by market capitalization, but what does this mean for future price movements?
The platform’s transition to a proof-of-stake consensus mechanism through its Ouroboros protocol has positioned it as an energy-efficient alternative to proof-of-work blockchains. This fundamental advantage, combined with ongoing development through the Basho and Voltaire eras, creates a solid foundation for potential growth.
Looking ahead to 2026, several factors will influence ADA’s price trajectory. Market analysts consider both technical indicators and fundamental developments when making their Cardano price prediction for this period.
Key factors for 2026 include:
Most conservative estimates suggest ADA could trade between $0.80 and $1.20 by 2026, assuming steady platform growth and favorable market conditions. More optimistic projections, based on accelerated adoption and successful implementation of Cardano’s roadmap, suggest potential highs approaching $1.50.
The year 2027 represents a crucial period for Cardano’s long-term trajectory. By this time, the platform should have fully implemented its Voltaire governance system, allowing ADA holders to participate directly in network decisions. This increased utility could significantly impact the ADA price.
| Scenario | Low Estimate | High Estimate |
|---|---|---|
| Conservative | $1.00 | $1.40 |
| Moderate | $1.20 | $1.80 |
| Optimistic | $1.50 | $2.20 |
These projections assume continued development success and growing institutional interest in proof-of-stake cryptocurrencies. The cryptocurrency forecast for 2027 heavily depends on Cardano’s ability to attract and retain developers, as well as the platform’s performance relative to competitors like Ethereum and Solana.
Looking further ahead to 2030, the Cardano 2030 outlook becomes both more speculative and potentially more exciting. Long-term predictions must account for technological advancements, regulatory landscapes, and broader economic factors that are difficult to forecast with precision.
Several scenarios could unfold:
The most compelling question remains: Will ADA hit $2? Based on current trajectories and assuming successful execution of Cardano’s development roadmap, reaching $2 by 2030 appears achievable, though not guaranteed. The $2 milestone represents approximately a 4x increase from current levels, which aligns with historical cryptocurrency growth patterns for established projects with strong fundamentals.
Several developments could propel ADA beyond current predictions:
Institutional Adoption: Increased investment from traditional financial institutions could dramatically increase demand for ADA. As proof-of-stake assets gain regulatory clarity, more institutional investors may enter the Cardano ecosystem.
Technological Breakthroughs: Successful implementation of Cardano’s scaling solutions and interoperability features could position ADA as a leading platform for decentralized finance and other applications.
Market Cycles: Cryptocurrency markets historically move in cycles. A major bull market coinciding with Cardano’s development milestones could create perfect conditions for significant price appreciation.
While the Cardano price prediction outlook appears promising, investors must consider potential challenges:
Competition: Cardano faces intense competition from other smart contract platforms. Ethereum’s continued development, along with emerging layer-1 and layer-2 solutions, could limit Cardano’s market share.
Regulatory Uncertainty: Changing regulatory landscapes, particularly regarding proof-of-stake assets and securities classification, could impact ADA’s price and adoption.
Execution Risk: Cardano’s development timeline has historically been deliberate. Any significant delays or technical challenges could affect market confidence and price performance.
Leading cryptocurrency analysts offer varied perspectives on ADA’s future. While some emphasize Cardano’s strong fundamentals and research-based approach, others caution about the competitive landscape. Most agree that Cardano’s success depends on execution of its roadmap and ability to attract developers and users to its ecosystem.
The overall cryptocurrency forecast for ADA remains cautiously optimistic, with many experts believing the platform’s unique approach could pay dividends in the long term, particularly as environmental concerns make proof-of-stake mechanisms more attractive to institutional investors.
Based on current Cardano price prediction models and market analysis:
1. Consider dollar-cost averaging rather than timing the market
2. Monitor Cardano’s development progress through official channels
3. Diversify within the cryptocurrency sector
4. Stay informed about regulatory developments affecting proof-of-stake assets
5. Set realistic expectations based on your investment horizon
What is the highest price Cardano could reach by 2030?
While predictions vary, some optimistic models suggest ADA could reach $5-$10 by 2030 under ideal conditions, though most analysts project more conservative targets in the $2-$4 range.
Who founded Cardano?
Cardano was founded by Charles Hoskinson, who also co-founded Ethereum. The project is developed by Input Output Hong Kong (IOHK).
How does Cardano differ from Ethereum?
Cardano uses a proof-of-stake consensus mechanism called Ouroboros, while Ethereum recently transitioned from proof-of-work to proof-of-stake. Cardano also emphasizes peer-reviewed research and formal methods in its development process.
What factors most influence ADA price?
Key factors include overall cryptocurrency market trends, Cardano platform adoption, technological developments, regulatory changes, and competition from other blockchain platforms.
Is Cardano a good long-term investment?
Many analysts view Cardano as a promising long-term investment due to its strong fundamentals and research-based approach, though all cryptocurrency investments carry significant risk and volatility.
The journey toward ADA reaching $2 involves multiple factors aligning favorably. Cardano’s deliberate development approach, combined with growing recognition of proof-of-stake advantages, creates a compelling case for long-term growth. While reaching $2 by 2030 appears within reach based on current projections, investors should remain aware of market volatility and the competitive landscape.
Cardano’s success ultimately depends on execution—transforming its technological promise into real-world adoption. As the platform continues to develop and the broader cryptocurrency market evolves, ADA’s price trajectory will reflect both Cardano’s specific achievements and general market conditions. For investors with a long-term perspective and risk tolerance, Cardano represents an intriguing opportunity in the evolving blockchain ecosystem.
To learn more about the latest cryptocurrency markets trends, explore our article on key developments shaping blockchain technology and digital asset adoption.
This post Cardano Price Prediction: Will ADA Explode to $2 by 2030? first appeared on BitcoinWorld.
December 21, 2025 — XRP is ending the weekend in a familiar spot: hovering just below the psychological $2.00 mark while traders weigh a rare combination of tailwinds (institutional ETF demand and growing “real-world” utility narratives) against a market still prone to sudden selloffs.
As of today, XRP is trading around $1.91 with roughly $2.38B in 24-hour volume, and is down about 1% over the last 24 hours, according to CoinMarketCap’s live market data. [1]
That headline number, however, masks the more important story driving XRP price discussion on 21.12.2025: spot XRP ETFs are still pulling in steady inflows, yet the token can’t convincingly reclaim $2, a level that has become the market’s decision point heading into the last full trading week of the year. [2]
Below is a breakdown of the key XRP news, forecasts, and analyses dated Dec. 21, 2025, plus the context investors are using to interpret what comes next.
Today’s XRP pricing across major trackers is tightly clustered around the low-to-mid $1.90s:
Why the $2 level matters right now: multiple Dec. 21 analyses frame $2.00 as the pivot—not just a round number, but a “line in the sand” where market structure shifts from defensive consolidation to breakout attempts. [6]
One of the most-discussed XRP headlines today is the ETF data:
The “disconnect” traders are debating: despite that steady ETF bid, XRP has remained range-bound under $2.00. That gap between “institutional wrapper demand” and “spot price follow-through” is a big reason Dec. 21 coverage is so heavily focused on technical levels and near-term catalysts. [9]
Part of the ETF narrative is that major issuers are now competing to offer “regulated exposure” to XRP.
Franklin Templeton’s own press release describes the Franklin XRP ETF (ticker: XRPZ) as an NYSE Arca-listed product designed to track XRP performance (before fees/expenses), using the CME CF XRP-Dollar Reference Rate (New York Variant) as its benchmark measure. [10]
Notable details that matter for market perception:
Why this matters for XRP price: even skeptics of crypto can recognize what a product like this does—it lowers operational friction for institutions that can’t (or won’t) custody tokens directly. The market is now trying to figure out whether those flows are “sticky,” and whether they translate into sustained spot demand beyond the ETF wrapper.
A second major theme in today’s XRP coverage is utility expansion—specifically, the idea that XRP holders could eventually earn yield through protocol-native, institution-oriented lending rather than relying on external DeFi workarounds.
RippleXDev has publicly teased a coming “protocol-native” Lending Protocol for the XRP Ledger, describing fixed-term, fixed-rate, underwritten credit. [13]
Ripple engineer Edward Hennis has posted that amendments are expected to enter validator voting by late January (2026), and referenced Single Asset Vaults as part of the design (aimed at isolating risk). [14]
Dec. 21 market coverage ties this directly to XRP-holder expectations around “institutional-grade yield,” framing it as a potential next chapter for XRPL functionality if governance approval and rollout go smoothly. [15]
The market takeaway (today): XRP price isn’t just trading a chart—participants are increasingly trading a narrative about XRP as settlement infrastructure + regulated investment access + credit rails. Whether that narrative becomes a sustained driver depends on delivery timelines and real adoption, not headlines alone.
Today’s most explicit technical roadmap comes from FX Leaders’ Dec. 21 analysis:
Meanwhile, today’s ETF milestone coverage also flags $2.00 as the immediate retest zone, with additional resistance levels cited around $2.15 and $2.58. [19]
1) Bullish path (breakout):
2) Bearish path (breakdown):
Because XRP sits at a technical inflection point, forecasts published today are unusually wide—ranging from conservative “tight-range” expectations to bold upside calls hinging on ETFs and regulatory clarity.
A Dec. 21 Motley Fool piece highlights a bullish call from Standard Chartered’s Geoffrey Kendrick, who estimates XRP could reach $8 in 2026, citing regulatory clarity and the “recent approval” of spot XRP ETFs as catalysts. The author then argues a more “reasonable” 2026 target is $3. [21]
How to read it: This is less a precise forecast than a signal of how Wall Street-style narratives are forming around XRP—ETFs + clearer rules + payments use case = “institutional asset,” even if price action hasn’t caught up yet.
Changelly’s Dec. 21 update is far more cautious on near-term volatility, forecasting that for December 2025 XRP could trade with a maximum around $1.96, a minimum around $1.89, and an average around $1.93. [22]
For 2026, the same page projects a narrower band (minimum around $1.94, maximum around $2.07, with average estimates listed). [23]
How to read it: models like this tend to be mean-reversion oriented and can understate “headline risk” (both up and down). But they show why the $2 zone is so central—many projection frameworks cluster right around it.
FX Leaders’ Dec. 21 technical view is straightforward: XRP consolidates around the low $1.90s, but a move reclaiming resistance (including the ~$1.98 region) and then $2.00 could open the door to ~$2.15. [24]
How to read it: this forecast is not saying XRP “will” hit $2.15; it’s defining the level the market will likely target if the breakout conditions are met.
Even though the major legal milestones aren’t new today, they remain part of why analysts are more willing to discuss “institutional adoption” without an asterisk.
Reuters reported that the SEC ended its lawsuit against Ripple, leaving a $125 million fine intact, after the parties agreed to dismiss appeals tied to the case. [25]
The SEC itself also published a litigation release stating it filed a joint stipulation to dismiss its appeal and Ripple’s cross-appeal, resolving the civil enforcement action against Ripple and two executives. [26]
Why this still impacts XRP price psychology: for years, XRP’s trading has been uniquely sensitive to regulatory headlines. With that chapter largely closed, more “traditional” drivers—macro risk appetite, ETF flows, product rollout, and network utility—have more room to dominate the narrative.
XRP doesn’t trade in a vacuum. This week’s risk sentiment has been shaped by macro data and rate-cut expectations—drivers that can quickly overwhelm token-specific news.
Barron’s coverage of crypto’s reaction to U.S. inflation data this week underscores the continued volatility and “seller control” dynamic that analysts see across the market, even during rebounds. [27]
Translation for XRP: even strong XRP-specific headlines (ETF milestones, protocol upgrades) can struggle to lift price if the broader market is de-risking.
If you’re following XRP price into the final stretch of 2025, the biggest risks are not mysterious—and many are explicitly spelled out in institutional product disclosures:
This is why the market is so focused on observable signals right now: does XRP hold $1.88–$1.90 support, does it reclaim $2.00, do ETF inflows persist, and does the XRPL Lending Protocol progress toward validator voting without controversy?
As of Dec. 21, 2025, XRP’s roadmap into the next few days is unusually clean:
1. coinmarketcap.com, 2. www.tradingview.com, 3. coinmarketcap.com, 4. finance.yahoo.com, 5. www.coingecko.com, 6. www.fxleaders.com, 7. u.today, 8. u.today, 9. www.fxleaders.com, 10. www.franklintempleton.com, 11. www.franklintempleton.com, 12. www.franklintempleton.com, 13. x.com, 14. x.com, 15. u.today, 16. www.fxleaders.com, 17. www.fxleaders.com, 18. www.fxleaders.com, 19. u.today, 20. www.fxleaders.com, 21. www.fool.com, 22. changelly.com, 23. changelly.com, 24. www.fxleaders.com, 25. www.reuters.com, 26. www.sec.gov, 27. www.barrons.com, 28. www.franklintempleton.com, 29. www.franklintempleton.com, 30. www.fxleaders.com, 31. www.binance.com, 32. x.com

