The main tag of Cryptocurrency price Articles.
You can use the search box below to find what you need.
[wd_asp id=1]
The main tag of Cryptocurrency price Articles.
You can use the search box below to find what you need.
[wd_asp id=1]
Solana (SOL) is currently priced at $210.25 after hitting $212.55 earlier today. This surge follows strong network performance and increased investor interest, positioning SOL as one of the top-performing cryptocurrencies of the week. With momentum building, the big question is whether Solana can maintain this trajectory and hit the $220 mark.
The daily chart for Solana reveals a robust uptrend, with SOL breaking above key resistance levels. Here’s a breakdown of the technical outlook:

Solana’s surge is fueled by both technical robustness and fundamental expansion. Recent events, such as exceeding Ethereum in daily fees and a rise in institutional adoption, have strengthened market sentiment regarding SOL.
The existing momentum indicates that hitting the $220 mark is achievable if bulls keep their dominance. Nevertheless, traders must be alert for possible pullbacks, especially if Bitcoin’s surge begins to exhibit signs of deceleration.
Bitcoin (BTC) reached a new all-time high of $81,846 on Monday, while Ethereum (ETH) and Ripple (XRP) are following suit and nearing their crucial resistance levels; a strong close above these levels could fuel further rally for both assets.
Bitcoin reached an all-time high (ATH) of $81,500 on Sunday last week after rallying over 17% following Donald Trump’s decisive victory in the US presidential election. At the time of writing on Monday, it reaches a new ATH of $81,846.
If BTC continues its upward momentum, it would extend the rally to retest its 161.8% Fibonacci extension level (drawn from July’s high of $70,079 to August’s low of $49,072) at $83,062.
The Relative Strength Index (RSI) stands at 78, trading above its overbought level of 70. Traders should be cautious because the chances of a price pullback are increasing. If RSI exits overbought territory, it would give a clear selling signal. Another possibility is that the rally continues, and the RSI remains above the overbought level.
BTC/USDT daily chart
However, if BTC closes below $78,000, it could extend the decline and retest its key daily support at $73,072.
Ethereum’s price broke above the daily resistance level of $2,820 on Thursday and rallied over 7.7% until Sunday, retesting its weekly resistance at $3,236. At the time of writing on Monday, it trades slightly below $3,182.
If ETH closes above the weekly resistance at $3,236, it would extend the rally by 9.8% to retest its July 22 high of $3,562.
The RSI stands at 75, trading above its overbought 70, like Bitcoin’s.
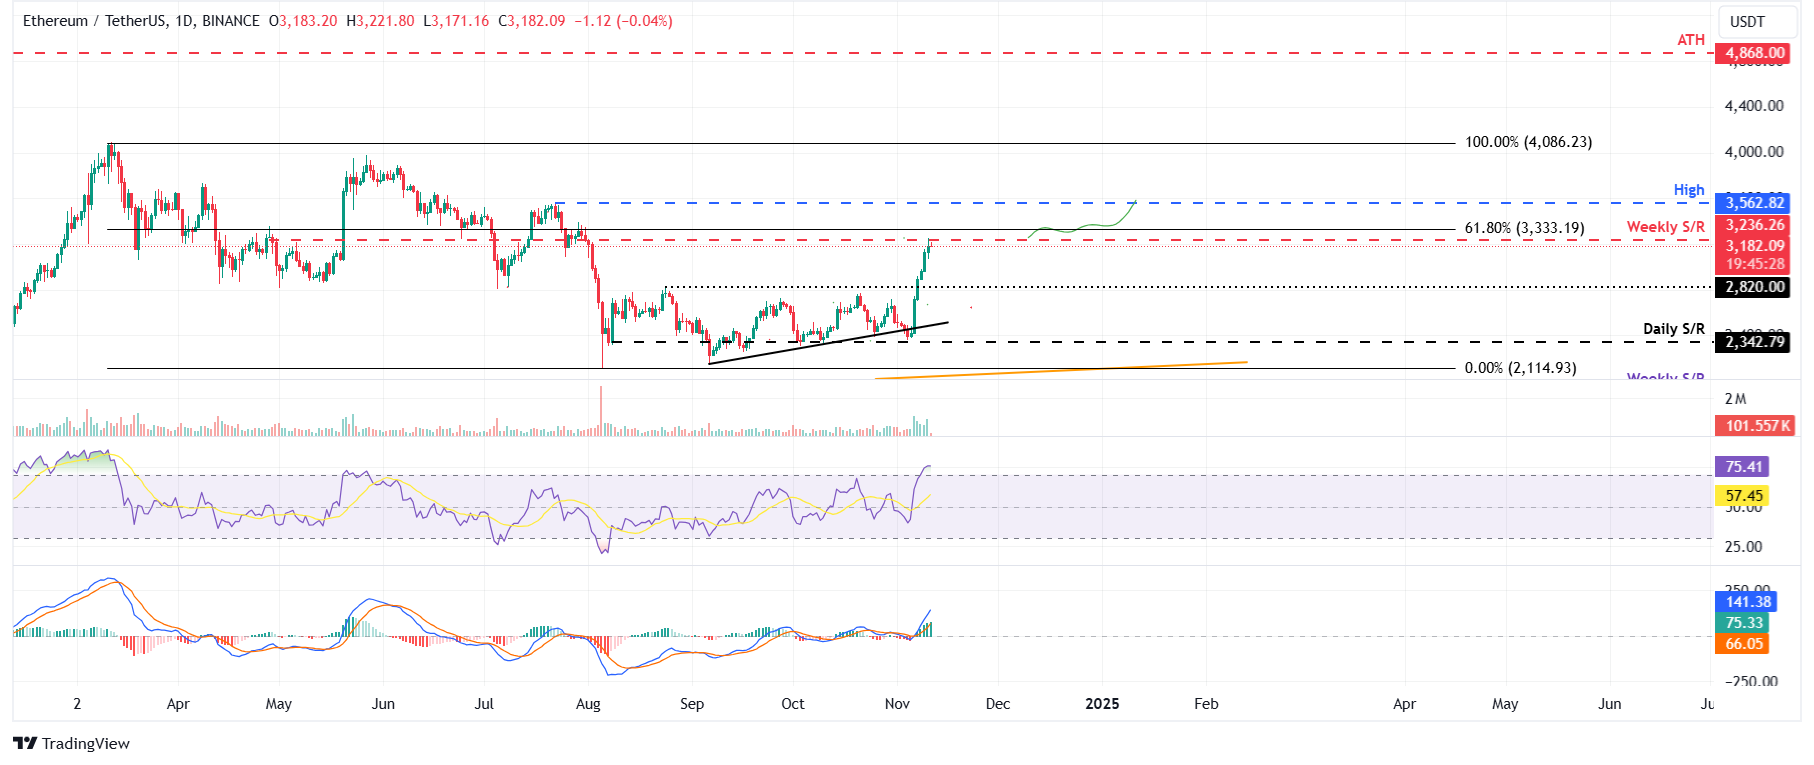
ETH/USDT daily chart
If the weekly resistance continues to hold as resistance, ETH would decline to retest its next daily support at $2,820.
Ripple price broke above the daily resistance level at $0.544 and its 200-day Exponential Moving Average (EMA) at $0.548 on Thursday and rallied over 6.3% in three days. As of Monday, it trades slightly above around $0.595.
If XRP continues its upward momentum, it could extend the rally to retest its daily resistance at $0.626. A successful close above this level could extend an additional rally of 4% to retest its July 31 high of $0.657.
The RSI stands at 70, around its overbought level. If the RSI tilts down, traders should be cautious because the chances of a price pullback increase.
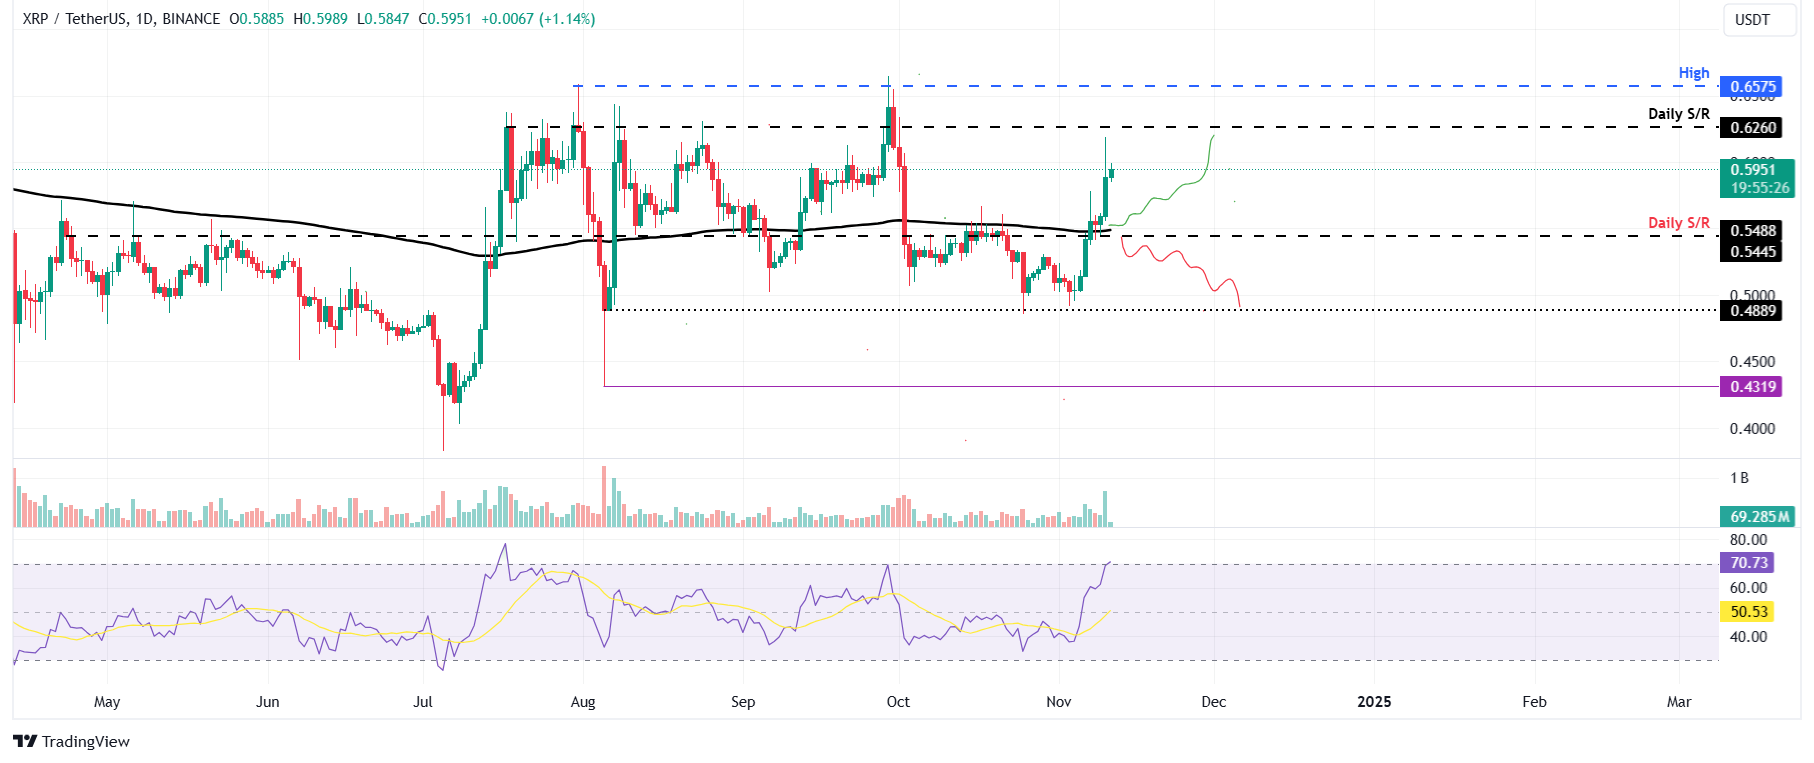
XRP/USDT daily chart
However, if the 200-day EMA at $0.548 fails, XRP could extend the decline to retest its next key support at $0.488.
Bitcoin is the largest cryptocurrency by market capitalization, a virtual currency designed to serve as money. This form of payment cannot be controlled by any one person, group, or entity, which eliminates the need for third-party participation during financial transactions.
Altcoins are any cryptocurrency apart from Bitcoin, but some also regard Ethereum as a non-altcoin because it is from these two cryptocurrencies that forking happens. If this is true, then Litecoin is the first altcoin, forked from the Bitcoin protocol and, therefore, an “improved” version of it.
Stablecoins are cryptocurrencies designed to have a stable price, with their value backed by a reserve of the asset it represents. To achieve this, the value of any one stablecoin is pegged to a commodity or financial instrument, such as the US Dollar (USD), with its supply regulated by an algorithm or demand. The main goal of stablecoins is to provide an on/off-ramp for investors willing to trade and invest in cryptocurrencies. Stablecoins also allow investors to store value since cryptocurrencies, in general, are subject to volatility.
Bitcoin dominance is the ratio of Bitcoin’s market capitalization to the total market capitalization of all cryptocurrencies combined. It provides a clear picture of Bitcoin’s interest among investors. A high BTC dominance typically happens before and during a bull run, in which investors resort to investing in relatively stable and high market capitalization cryptocurrency like Bitcoin. A drop in BTC dominance usually means that investors are moving their capital and/or profits to altcoins in a quest for higher returns, which usually triggers an explosion of altcoin rallies.
Four prominent crypto entities could trigger a significant rally for XRP, potentially taking the asset’s price to $10 per token.
XRP has witnessed slight gains over the past few days after Donald Trump emerged as the winner of the just-concluded U.S. presidential election.
Recall that XRP’s price crashed significantly after the SEC filed an appeal notice in the Ripple lawsuit last month as part of efforts to overturn Judge Analisa Torres’ verdict, which gave the company a partial victory.
Before the filing, XRP was trading around $0.60 on October 2, when the SEC filed the appeal notice. However, the token’s price plummeted to $0.5102 the following day, marking a decline of around 14.96% in less than 48 hours. Since the October 3 plunge, XRP witnessed a slight uptick, currently trading around the $0.55 price range.
Currently, XRP is up 6.4% over the past week, with the token changing hands at $0.5514.
Amid the recent uptick, several analysts expressed confidence about XRP’s potential to secure a spot-based exchange-traded fund (ETF). Over the past months, XRP has made significant strides towards getting an ETF, thanks to Grayscale Investments, Bitwise, Canary Capital, and 21Shares.
These four companies have brought XRP an inch closer to having its own ETF, like other top cryptocurrencies, such as Bitcoin (BTC) and Ethereum (ETH).
As reported last month, Grayscale relaunched its XRP Trust, a closed-end fund that grants institutional investors exposure to the cryptocurrency. Following the fund’s launch, Grayscale revealed a four-stage growth cycle that could transform the XRP Trust into a spot ETF.
One month later, the asset manager filed with the SEC to convert its Digital Large Cap Fund (GDLC), containing five cryptos like XRP, to a spot ETF.
Prior to Grayscale’s filing with the SEC, crypto asset manager Bitwise had submitted an XRP ETF application with the regulator on October 1. The company first applied with the state of Delaware to launch an XRP ETF. A few hours after the Bitwise ETF filing appeared on Delaware’s Division of Corporations website, the company officially applied with the SEC to launch an ETF for XRP.
Additionally, Canary Capital joined the list of companies seeking to introduce an XRP ETF into the market. On October 8, the investment company submitted an S-1 filing to the SEC, confirming plans to launch a spot-based ETF tied to XRP.
Furthermore, 21Shares also applied to launch an exchange-traded fund for the seventh-biggest cryptocurrency by market capitalization.
While it remains unclear whether the SEC would approve any of these applications, investors have debated how the fund could positively impact the token’s price.
Some market observers assert that the product will likely attract institutional capital into the XRP ecosystem, boosting the token’s price to jaw-dropping targets, such as $10.
With XRP currently trading at $0.5514, the token must surge 1,713% to reach the $10 target. At that price, a 100,000 XRP portfolio worth $55,140 today would soar to $1 million.
Even though the $10 prediction requires XRP’s price to increase by 1,713% from the current level to reach the target, many analysts believe the forecast is realistic.
Last month, popular community figure General Radahn predicted that Grayscale’s relaunch of XRP Trust could potentially take the token’s price to $10.
In August, widely followed market watcher EGRAG emphasized that XRP’s price could surge to $10.4 if Bitcoin clinches a target of $80,000. However, the analyst suggested that both assets must maintain a correlation of $0.00013 before the prediction could play out.
In the same month, analyst Spectre left XRP enthusiasts stunned after they projected that the token would hit the $10 target in the 2024/2025 market cycle.
Interestingly, Oliver Michel, the CEO of Frankfurt-based exchange Tokentus Investment AG, mentioned factors such as the Ripple IPO, XRP ETF, SEC lawsuit resolution, and growing adoption of the Ripple payments solution as catalysts that could take XRP’s price to $10 this year. Besides the widespread adoption of Ripple’s payment solution, the other three factors have yet to play out.
Whether XRP hit the $10 price target in this market cycle remains to be seen. However, with Bitwise, Grayscale, Canary, and 21Shares interested in launching ETFs for XRP, combined with factors such as its legal clarity and increased use in cross-border payments, the token could hit the $10 target in the near future.
It is imperative to note that nothing is guaranteed in the crypto world. Hence, this article is for informational purposes and should not be taken as investment advice.
DisClamier: This content is informational and should not be considered financial advice. The views expressed in this article may include the author’s personal opinions and do not reflect The Crypto Basic opinion. Readers are encouraged to do thorough research before making any investment decisions. The Crypto Basic is not responsible for any financial losses.
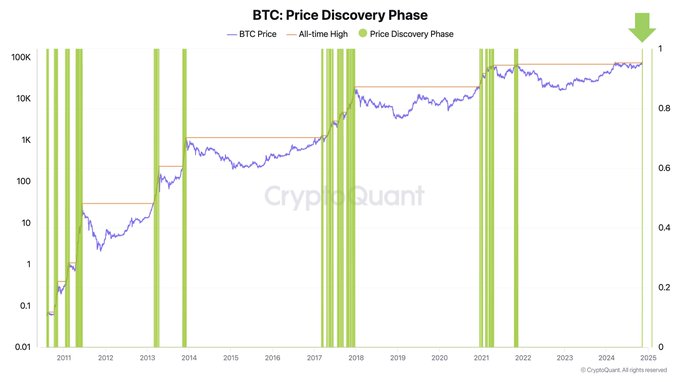
Bitcoin price has reached a new all-time high, hitting $80,000 as of November 10, marking a milestone for the cryptocurrency.
This upward movement has pushed Bitcoin into what many analysts describe as the “price discovery” phase, where BTC’s future price trajectory is largely uncharted. However, market experts are divided on whether this rally will continue or if Bitcoin is primed for a correction in the near term.
Bitcoin price climb to $80,000 has created an atmosphere of both excitement and caution within the cryptocurrency community. With 100% of Bitcoin wallet addresses now in profit, according to data shared by Ki Young Ju, CEO of CryptoQuant, many see this as a pivotal moment in Bitcoin’s price journey.
“We often see a correction when the price reaches these levels,” Ju commented, hinting that major investors might start taking profits soon. However, should the bullish rally continue, BTC price may continue its rally towards $100k, according to a Bitcoin price prediction.
The sharp rise in Bitcoin’s value has also triggered the “Extreme Greed” level on the Bitcoin Fear and Greed Index, which now stands at 78. Historically, this level of market sentiment often precedes price pullbacks as overbought conditions become more likely. Analysts warn that the intense bullish sentiment may soon invite selling pressure, especially if investors look to secure profits after significant gains.
Trading volume and open interest in Bitcoin derivatives have both surged alongside the recent price increase. Data indicates a 33.31% rise in trading volume, now totaling $78.12 billion, which suggests heightened interest and activity. Open interest, the measure of total outstanding derivatives contracts, has also increased by 4.16% to $48.78 billion.
This surge in trading volume, coupled with increasing open interest, often signals that new money is entering the market.

Many traders view this as supportive of the current uptrend, as it suggests a strong flow of capital backing Bitcoin’s price rise. However, some analysts warn that the combination of high volume and open interest can also precede volatility, as larger players may capitalize on market momentum to make strategic moves.
As BTC price breaches the $80,000 mark, technical analysts are keeping an eye on several key price levels. Immediate support is expected around the $75,000 to $76,000 range, which served as a recent resistance zone before Bitcoin’s breakout. If Bitcoin retraces, this level could act as a foundation for a potential bounce. Additional support may be found around the $70,000 to $72,000 area, where BTC consolidated for some time in prior trading sessions.
On the upside, the $80,500 level represents the first major resistance. Should Bitcoin break above this threshold, further resistance could emerge between $82,000 and $85,000. These levels align with historical highs and psychological milestones, where traders might again encounter selling pressure.

Market indicators are showing signs that Bitcoin may be reaching an overbought state. The Average Directional Index (ADX) stands at 33.14, indicating a strong upward trend. Typically, an ADX reading above 25 signifies a healthy trend, and the current level suggests robust momentum in Bitcoin’s price movement.
However, the Money Flow Index (MFI) is near the overbought range, currently sitting at 71.03. An MFI above 80 generally indicates overbought conditions, which can precede short-term corrections or consolidations. As a result, some analysts are warning that Bitcoin may experience a pullback or a period of sideways movement if buying momentum slows.
Kelvin Munene Murithi
Kelvin is a distinguished writer with expertise in crypto and finance, holding a Bachelor’s degree in Actuarial Science. Known for his incisive analysis and insightful content, he possesses a strong command of English and excels in conducting thorough research and delivering timely cryptocurrency market updates.
Disclaimer: The presented content may include the personal opinion of the author and is subject to market condition. Do your market research before investing in cryptocurrencies. The author or the publication does not hold any responsibility for your personal financial loss.
Bitcoin, the leading cryptocurrency, soared to a new all-time high of $80,100 on November 10, triggering a broader market breakout. While most major altcoins followed the same momentum, the meme cryptocurrency experienced a high-momentum rally driven by its inherent volatility and appeal among speculative traders. With an 80% weekly surge, the Dogecoin price rallied to a 3-year high of $0.297.
By press time, DOGE price had traded at $0.26 with an intraday gain of 3.2%. According to Coingecko, the asset market cap holds at $38.4 Billion with a 24-hour trading volume of $12.7 Billion.
Since early September, the dog-themed memecoin Dogecoin witnessed a steady recovery, initiated at the bottom support of $0.091. The formation of fresh higher highs and lows backed by increasing training volume accentuates the buyers’ conviction to drive a sustained uptrend.
However, the cryptocurrency market experienced an accelerated recovery this week following Donald Trump’s victory as the 47th President of the United States. Thus, the Dogecoin price records a sharp $0.148 to $0.268, registering a growth of 80%.
An analysis of the weekly chart shows the massive green candle gives a breakout from the $0.228 neckline of a cup and handle pattern. This pattern begins with the “cup,” created by a rounded bottom following a decline, signifying a gradual recovery phase as selling pressure subsides and buyers return. The subsequent “handle” forms a brief consolidation or pullback near the resistance level, recuperating the exhausted bullish breakout.
If the breakout is sustained, the Dogecoin price prediction could target $0.4, accounting for a 53% potential surge.

According to Santiment data, whale wallets holding between 100 billion and 1 billion coins have significantly increased their accumulation, rising from 2.68 million coins to 30.56 million coins.
This substantial increase highlights strong confidence among large investors in the asset’s long-term potential. Historical data shows whale accumulation has often coincided with major market bottoms, indicating a potential trend reversal for Dogecoin price.

On the contrary, if the Dogecoin price fails to sustain above the C&H neckline, the sellers could strengthen their grip over these assets and prolong the sideways trend.
Dogecoin’s rally was fueled by Bitcoin’s all-time high of $80,100, triggering a broader market breakout. The surge was further supported by the completion of a cup and handle pattern
If the breakout from the cup and handle pattern is sustained, Dogecoin’s price could target $0.40
Santiment data shows whale wallets holding between 100 billion and 1 billion coins have increased their accumulation from 2.68 million to 30.56 million coins. Such whale activity often signals confidence in long-term growth and aligns with market bottom signals, suggesting a potential trend reversal.
Sahil Mahadik
Sahil is a dedicated full-time trader with over three years of experience in the financial markets. Armed with a strong grasp of technical analysis, he keeps a vigilant eye on the daily price movements of top assets and indices. Drawn by his fascination with financial instruments, Sahil enthusiastically embraced the emerging realm of cryptocurrency, where he continues to explore opportunities driven by his passion for trading
Disclaimer: The presented content may include the personal opinion of the author and is subject to market condition. Do your market research before investing in cryptocurrencies. The author or the publication does not hold any responsibility for your personal financial loss.
Most major altcoins witnessed a renewed recovery trend in November amid the U.S. election buzz and Donald Trump’s victory. The pioneer cryptocurrency, Bitcoin, entering price discovery further cemented the bullish narrative in the broader market. Among the top performers, the Cardano price recorded an 83% weekly surge, and still enough room for future growth.
By press time, the ADA price had traded at $0.58, with an intraday gain of 28.5%. According to Coingecko, the asset’s market cap was boosted to $20.58 billion, while 24-hour trading volume was at $2.53 billion.
In the last six days, the layer-1 cryptocurrency Cardano recorded an upright recovery from $0.326 to $0.58— an 83% price increase. An analysis of the daily chart showed this recovery with the increasing size of green candles and trading volume, indicating a sustained uptrend.
The strong momentum may be attributed to several factors, with the first being the potential impact of the 2024 U.S. election and Donald Trump becoming the 47th president. Additionally, Cardano’s recent partnership with BitcoinOS has enabled it to access $1.3 trillion in Bitcoin liquidity, significantly enhancing its decentralized finance (DeFi) ecosystem.
As per tradingview chart, the ADA price also breaches a key downsloping resistance of a triangle pattern. This breakout signals the buyers’ escape from a six-month consolidation, offering suitable support to drive a higher rally.
However, today’s surge in Cardano price is likely triggered by founder Charles Hoskinson’s plans to work with the U.S. government under Donald Trump on cryptocurrency legislation.
The aforementioned reasons provide a major boost for Cardano’s adoption and demand for its native cryptocurrency, positioning for further gains.

According to Santiment data, the ADA whale holding 100 Million 1 Billion coins has significantly increased their accumulation from 2.06 to 2.93 since mid-April. Despite the prevailing downtrend, the large holders’ buying indicates their confidence in Cardano’s further growth.
Generally, this signal coincides with major market bottoms and reverses trends.
On the contrary, the recent surge in Cardano price is fueled by the aforementioned factors one after another. Thus, a rally of the same momentum is less likely to continue without more external factors.

Moreover, a sharp price increase is often followed by a short corrective phase for buyers to regain strength. If this happens, the ADA price could revert lower to seek support at key daily EMAs (20, 50, 100, and 200).
Cardano’s price shows room for growth due to factors like a bullish pattern breakout, whale accumulation, key partnerships, and plans to collaborate with the U.S. government on crypto legislation
Following the breakout from a six-month downsloping triangle, Cardano’s price targets $0.8 as the next level
Larger holders accumulation reflects their confidence in Cardano’s long-term potential and often aligns with market bottom signals.
Sahil Mahadik
Sahil is a dedicated full-time trader with over three years of experience in the financial markets. Armed with a strong grasp of technical analysis, he keeps a vigilant eye on the daily price movements of top assets and indices. Drawn by his fascination with financial instruments, Sahil enthusiastically embraced the emerging realm of cryptocurrency, where he continues to explore opportunities driven by his passion for trading
Disclaimer: The presented content may include the personal opinion of the author and is subject to market condition. Do your market research before investing in cryptocurrencies. The author or the publication does not hold any responsibility for your personal financial loss.
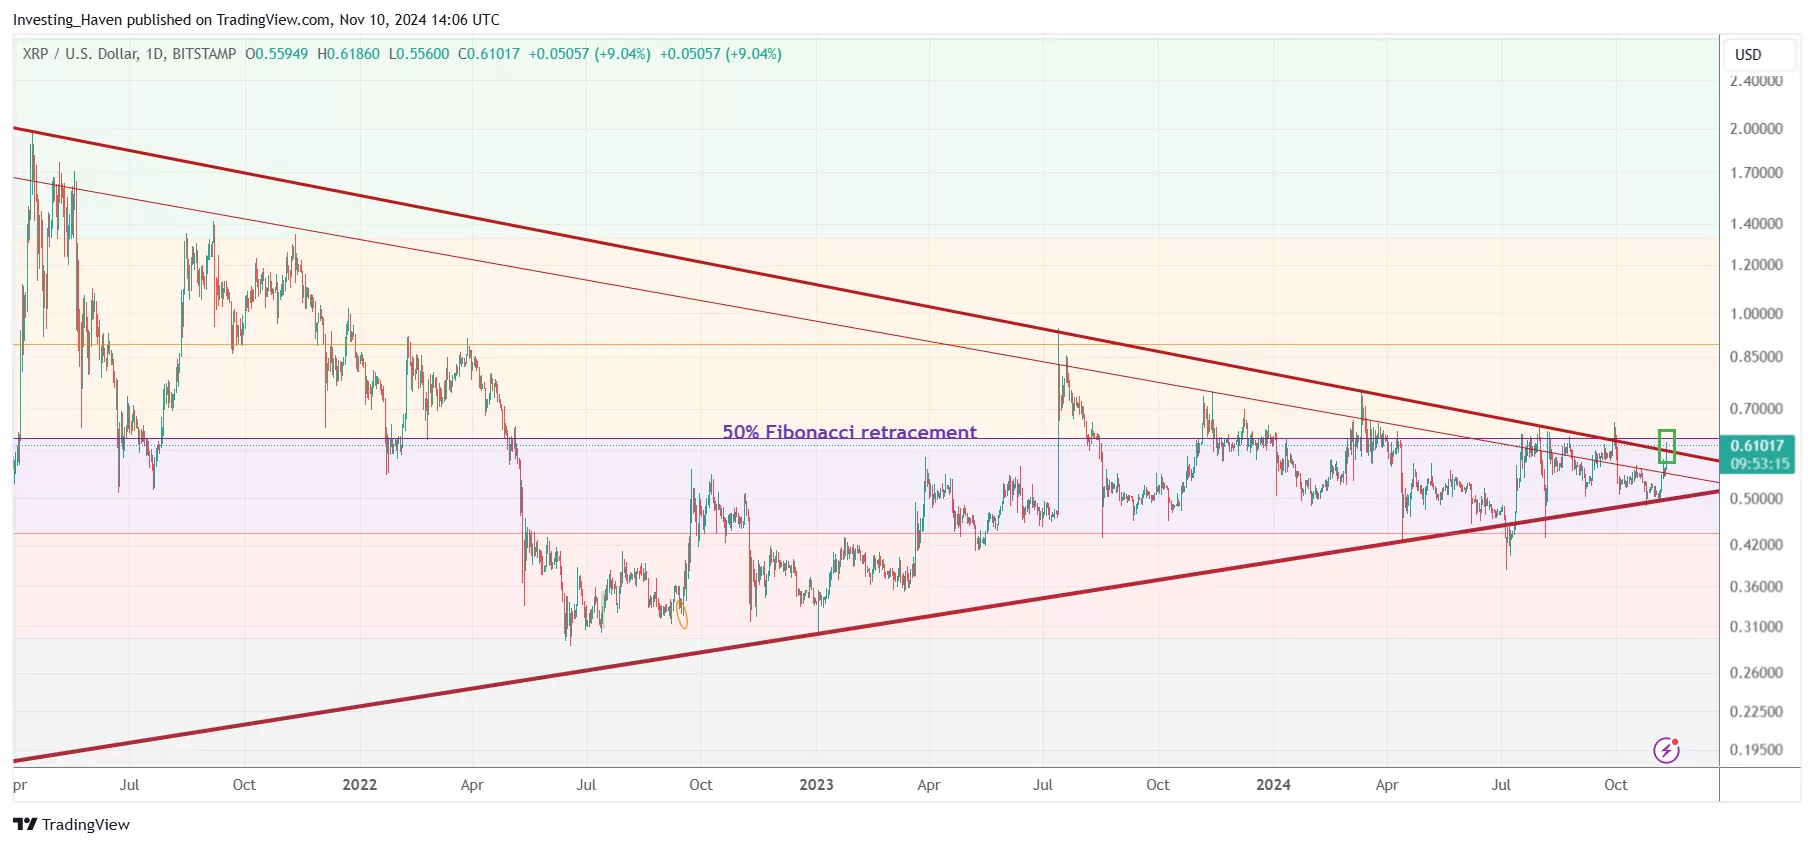
DOGE clears its 50% Fibonacci level, today, and in doing so it overtakes XRP in terms of market cap ranking. As this is happening, XRP is testing its 50% Fibonacci point, suggesting a massive XRP breakout is underway.
RELATED – XRP prediction 2025 to 2030
If XRP moves above its 50% Fibonacci level, it will accelerate its move higher.
It looks like DOGE and XRP are ready to move much higher, in dollar value, in the coming weeks and months.
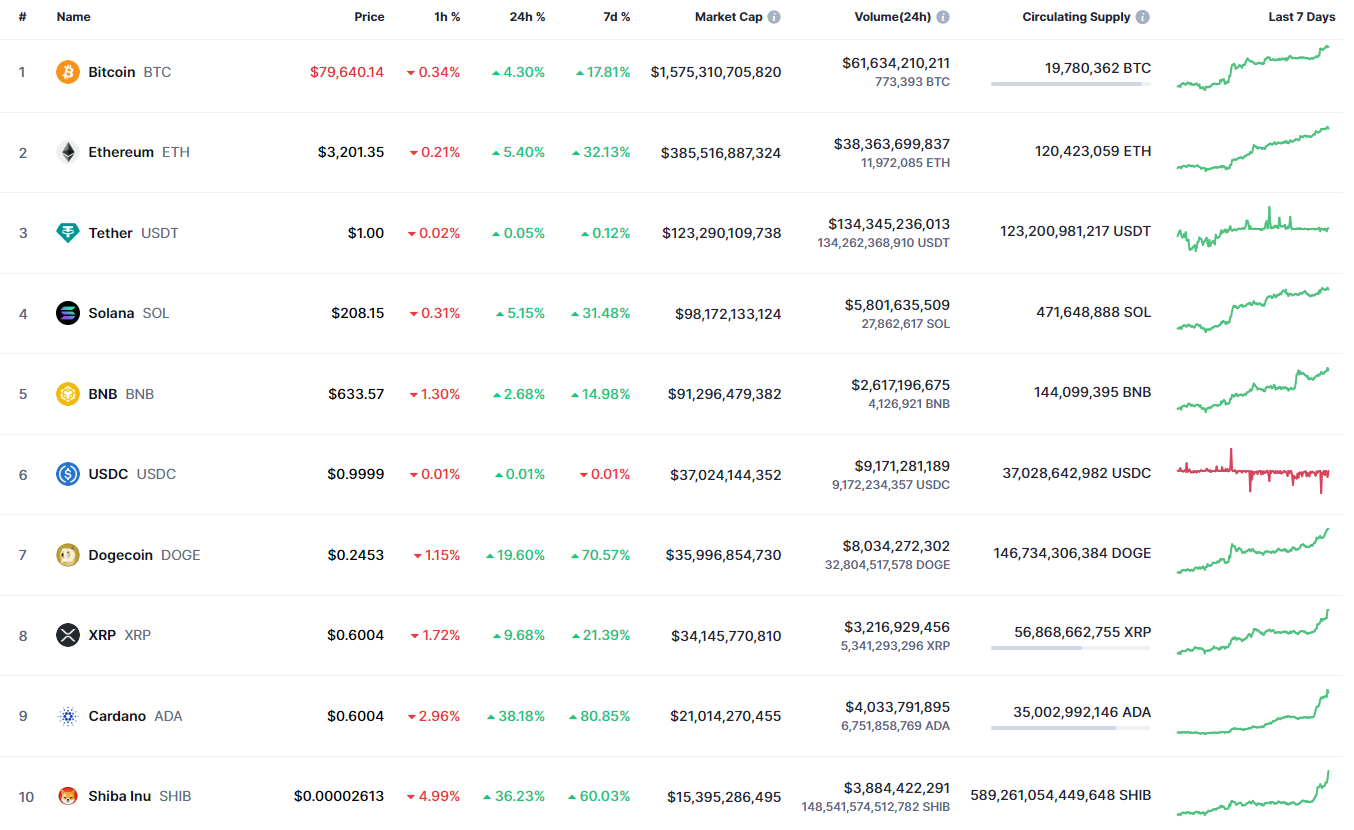
At the time of writing, this is the top 10 in terms of market capitalization:
BTC
ETH
USDT
SOL
BNB
DOGE
USDC
XRP
ADA
SHIB
XRP dropped in this top 10 list in recent days.
The market cap of DOGE, USDC, XRP are somehow related.
However, DOGE staged an amazing come back since Nov 9th.
The million dollar question is whether XRP will follow DOGE higher, as DOGE is a bullish momentum barometer indicating that alt season 2025 is here.
November 9th, 2024, is a day that DOGE enthusiasts will never forget.
That’s the day when DOGE cleared its 50% Fibonacci retracement level at $0.188.
As seen on below chart, the final purple line specifically, the $0.188 level represents half the retracement since the previous cycle highs printed in April/May of 2021.
DOGE is likely going to move to ATH in 2025, is what we wrote in our latest DOGE price prediction 2025 research update.

XRP, until today the laggard among the 10 largest cryptocurrencies, is likely going to turn its flat trend around.
Most likely, XRP is preparing a breakout above its 50% Fibonacci retracement level, following DOGE’s path higher.
Now, the big difference between DOGE and XRP is that XRP will unleash tremendous bullish energy once it clears $0.625, its secular breakout level.
Why? Because the long term XRP chart shows that XRP is working on a double breakout:
DOGE started a powerful breakout but XRP is twice as powerful if/when it succeeds clearing $0.625.
That’s why we believe XRP’s breakout is massive in terms of impact.
So, the above analysis brings up the question whether crypto investors should pick one of the two tokens: DOGE vs. XRP.
Our viewpoint is very different – why not DOGE and XRP?
In the end, DOGE is the leading meme coin while XRP is the laggard that might benefit from the suppression by the SEC. If anything, a suppressed market, when it gets rid of suppressive dynamics, will unleash tremendous energy.
Case in point: Solana, in 2022 suppressed by the SEC, became a leader since 2023, now the 4th largest cryptocurrency.
Read: Could XRP Be ‘The Next Solana’
Frankly, while we are super bullish on DOGE, something tells us that XRP will catch up as SEC suppression might end soon, making us equally bullish on XRP.
Why not DOGE + XRP, for some large cap diversification?
Solana has been on an uptrend since rebounding from the $122 mark in September. Recently, the SOL token broke past descending logarithmic resistance to test the psychological $200 level. This breakout also hints at a possible parallel rally alongside BTC. Moreover, technical analysis indicates that Solana’s RSI is at 72, signaling the beginning of a parabolic run.
However, despite SOL’s bullish outlook, analysts also caution that the Solana price might pull back to around $180 in the short term. Once its support level has been tested, the altcoin will resume its uptrend momentum, aiming for high price targets, including the $500 mark, as outlined by Inmortalcrypto. With its recent price performance, Solana has already claimed the fourth-largest market cap position, outshining Binance Coin.
Solana’s price is nearing the $206 mark as it trades around the $204 mark, having recorded a weekly surge of over 18%. This signals rising confidence in the altcoin’s high-speed blockchain. Moreover, the SOL token has also recorded a significant YTD of over 374%, with current technical indicators suggesting the token is experiencing a third wave of a bullish cycle that started several weeks ago.
This phase is usually marked by the strongest uptrend momentum, with support near $175 key to preventing a temporary dip. However, Solana’s break past the $200 mark will likely spark fresh highs for the SOL token. Additionally, the 2024 US election marked a significant increase in pro-crypto lawmakers, with over 250 crypto-supportive representatives in Congress. This move signals growing legislative support for digital assets.
With the pro-crypto wave and Solana’s solid technical indicators, including the MACD and signal lines, which have produced a bullish crossover, expectations remain high for Solana as analysts welcome the idea of further gains according to its impressive chart, which could see the SOL price prediction for 2024 surpass market expectation. Moreover, the 50 and 200-day SMA lines have confirmed a golden crossover, a sign of a continuous bullish trend.
Lunex Network gears to be more than just another decentralized exchange. The project operates a fully non-custodial platform, allowing seamless transactions of over 50K assets. This means near-instant transfers within major blockchains, including Ethereum, Solana, and Bitcoin.
The project also offers a unique portfolio tracker for effortless asset management across different classes, including stocks, crypto, and bonds. This tracker has built-in data feeds and analytics, giving users the most relevant information. Lunex Network’s premium subscription service, Lunex Pro, also grants access to advanced trading features and tools, including cashback on each transaction and AML wallet checks.
These features have already contributed to an LNEX price surge of over 66%, from an initial starting price of just $0.0012 to $0.002.
You can find more information about Lunex Network (LNEX) here:
Website: https://lunexnetwork.com
Socials: https://linktr.ee/lunexnetwork
Disclaimer: The opinions expressed by our writers are their own and do not represent the views of U.Today. The financial and market information provided on U.Today is intended for informational purposes only. U.Today is not liable for any financial losses incurred while trading cryptocurrencies. Conduct your own research by contacting financial experts before making any investment decisions. We believe that all content is accurate as of the date of publication, but certain offers mentioned may no longer be available.
The market keeps setting new peaks, according to CoinMarketCap.
The rate of Binance Coin (BNB) has risen by 2.68% over the last 24 hours.
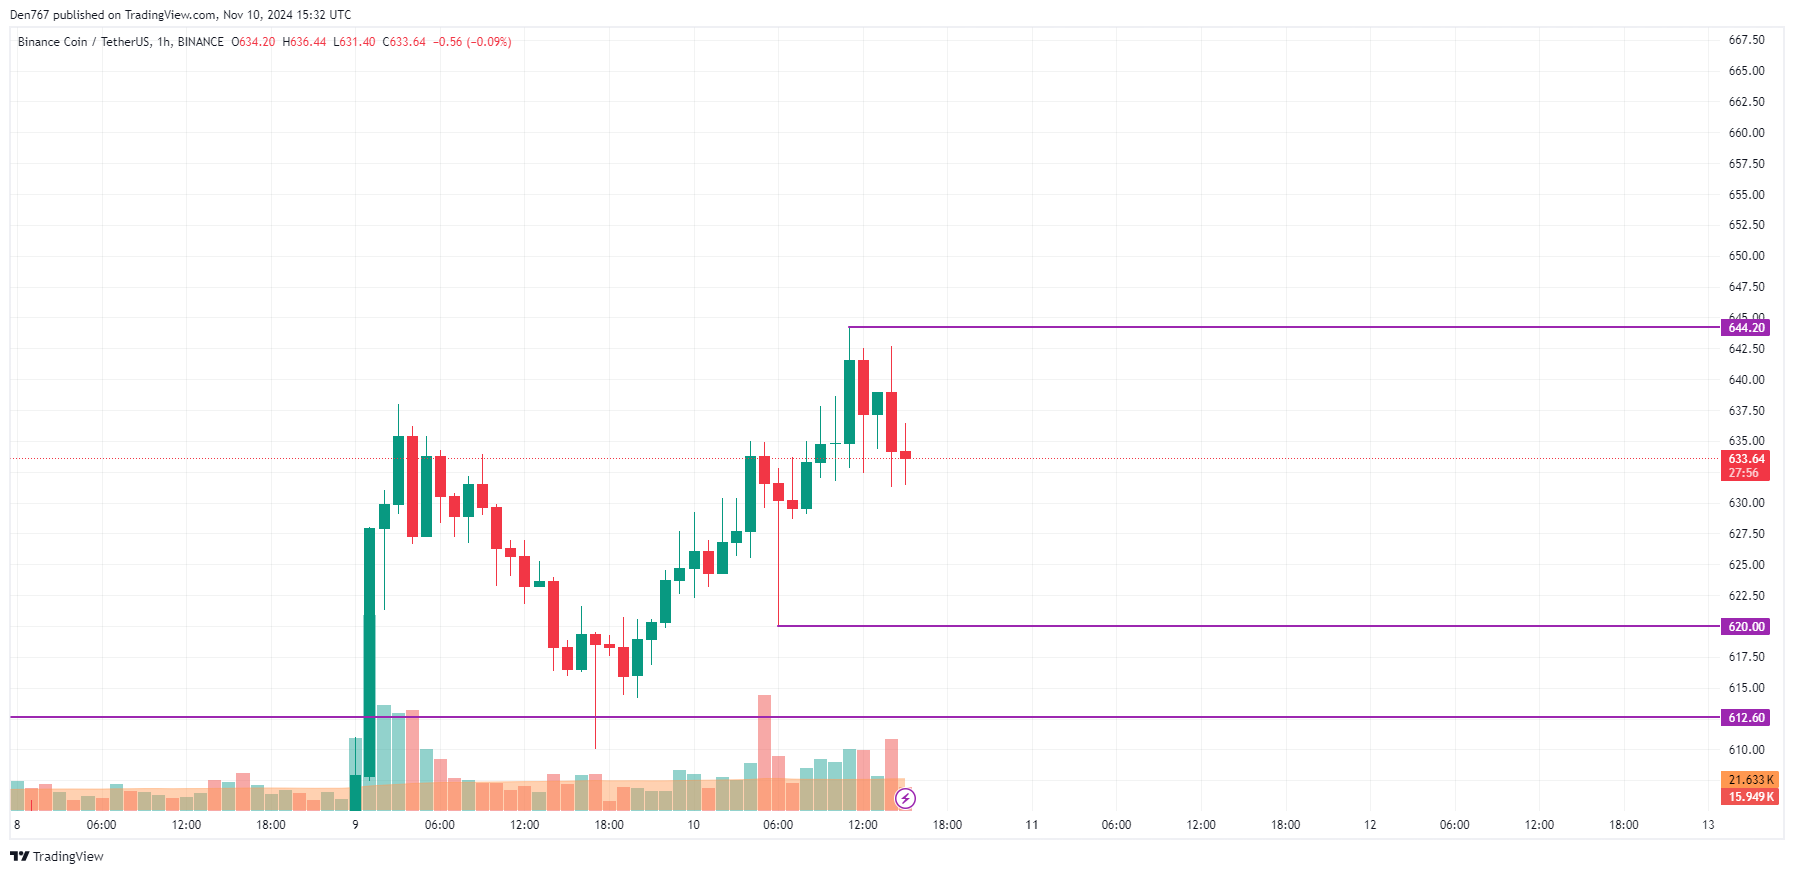
On the hourly chart, the price of BNB might have set a local resistance level of $644.20. As most of the daily ATR has been passed, any sharp moves are unlikely to happen by the end of the day.
On the bigger time frame, one should pay attention to the candle closure in terms of the level formed by the false breakout.
Related
If it happens far from it, there is a chance of a correction to the $610-$620 zone.
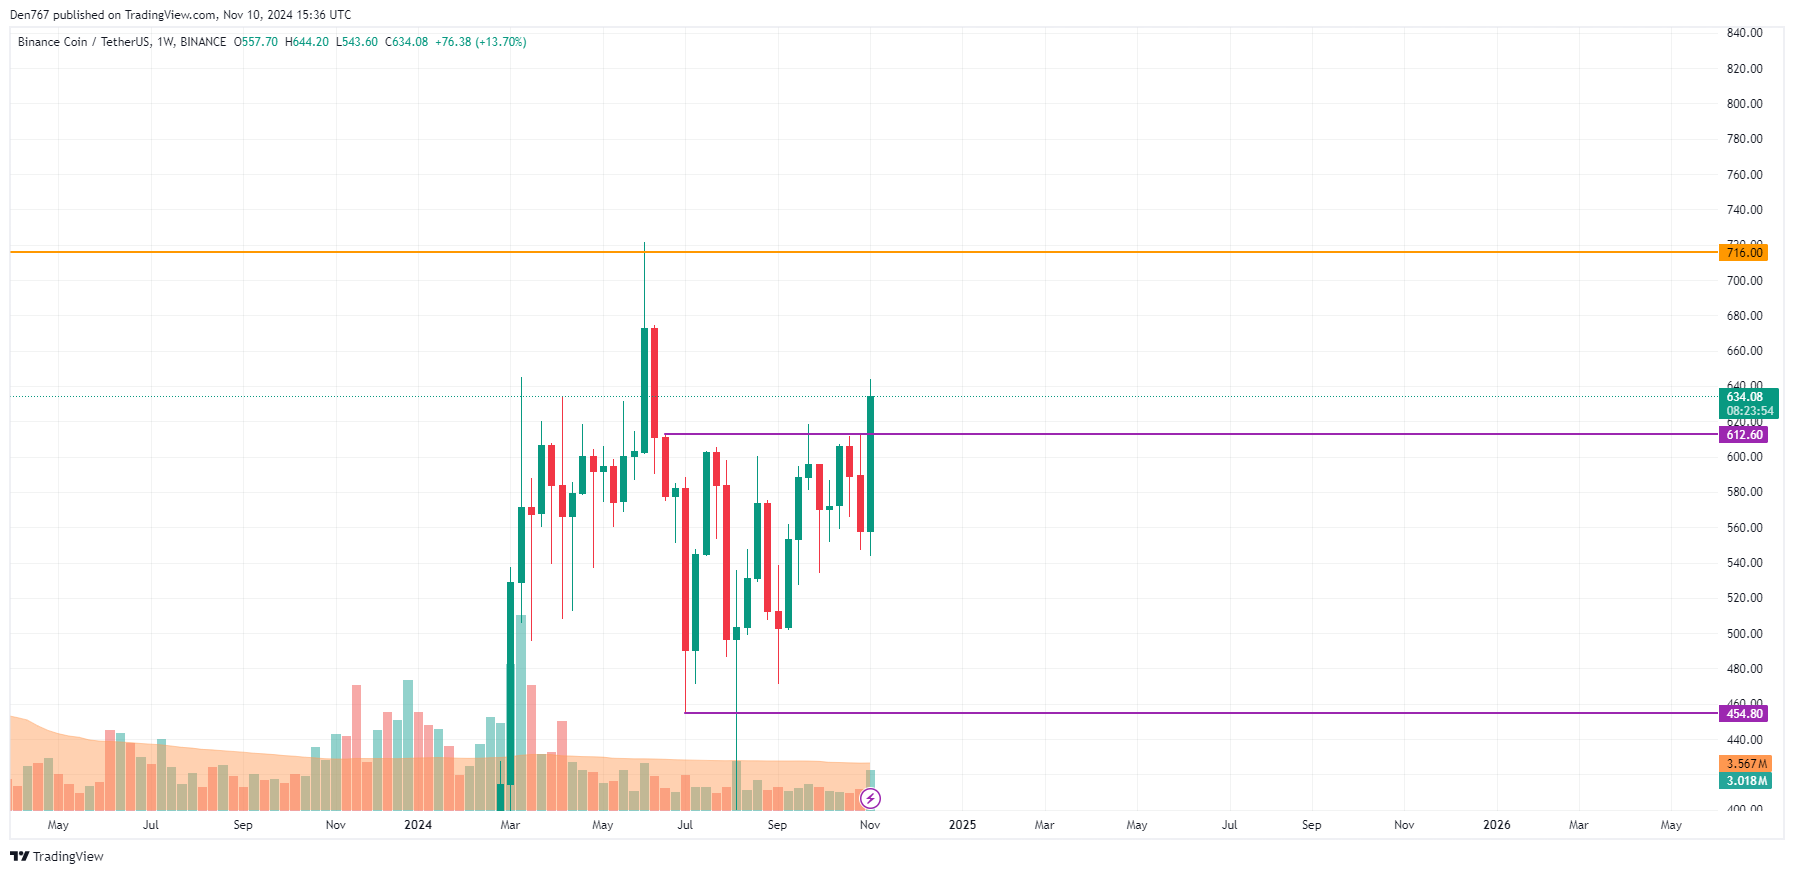
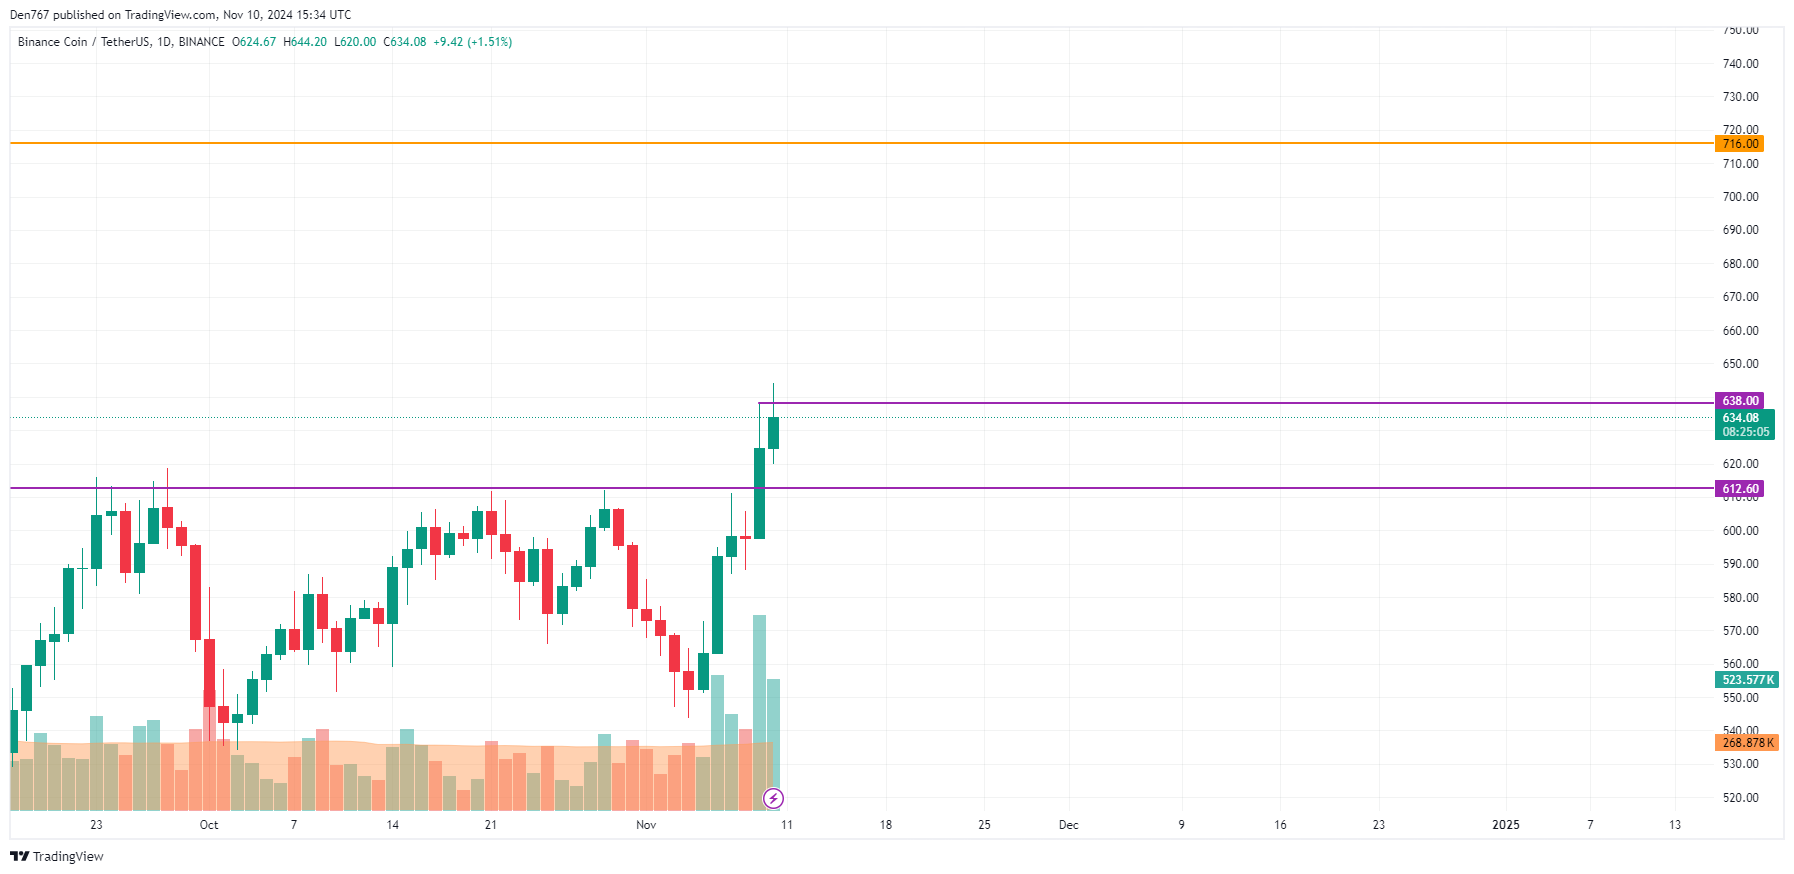
A more bullish picture is on the weekly chart. If the bar closes around the current prices and far from the $612.60 level, the growth may continue to the vital zone of $700 by the end of the month.
BNB is trading at $634.48 at press time.
With DOGE’s outstanding October performance as a background, a well-known crypto analyst has produced an amazing projection for November. Based on this analyst’s calculations, DOGE might surge to $1 by the end of the month, a 400% increase over its present price. The crypto world has been caught aback by this forecast since, for DOGE, a $1 price point would represent a major turning point considerably above most near-term projections. These elements notwithstanding, critics still exist. While DOGE’s price might rise, some analysts contend that a 400% increase to $1 in one month looks too ambitious even if the price might expand. Still, the crypto sector has witnessed comparable explosive increases before, hence this prediction is hotly contested. Although the expected surge of Dogecoin takes the front stage, Rexas Finance (RXS) is another rising star in the crypto scene that might outperform DOGE’s November gains. Strong presale performance and real-world asset tokenizing features of this fast-growing token have been generating waves.


 in November")
✓ Share: