The main tag of Cryptocurrency price Articles.
You can use the search box below to find what you need.
[wd_asp id=1]
The main tag of Cryptocurrency price Articles.
You can use the search box below to find what you need.
[wd_asp id=1]
Solana (SOL) is trading above $141 at the time of writing on Thursday. The general outlook remains bearish despite a knee-jerk recovery from $130, which marked the previous day’s low.
Solana is experiencing steady inflows into Exchange Traded Funds (ETFs). According to SoSo data, US-listed SOL ETFs recorded inflows of nearly $56 million on Wednesday, bringing cumulative net inflows to $476 million.
Bitwise’s BSOL ETF was the best-performing product, with approximately $36 million in inflows, followed by Grayscale’s GSOL with nearly $13 million and Fidelity’s FSOL with $5 million.
Solana ETFs have not experienced outflows since their October 28 debut, underscoring the growing interest in altcoin investment products.
On the other hand, retail demand has not picked up since mid-October, when the cryptocurrency market experienced one of its largest single-day liquidation events.
CoinGlass data shows Solana’s futures Open Interest (OI) averaging $7.2 billion, down from $10 billion on November 1. The OI sits significantly below its $17 billion record peak achieved on September 19.
Since OI reflects the notional value of outstanding futures contracts, a steady increase is needed to support a near-term rebound. However, if risk-off sentiment persists and OI continues to decline in the coming days, the likelihood of Solana falling below $130 will increase.

Solana hovers above $141 on the daily chart at the time of writing on Thursday. The token also sits well below falling moving averages, with the 50-day Exponential Moving Average (EMA) at $173 and the 200-day EMA at $180 capping rebounds. The Moving Average Convergence Divergence (MACD) indicator remains in negative territory and has been improving toward the zero line, suggesting fading bearish pressure.
The Relative Strength Index (RSI) at 38 reflects subdued momentum beneath the 50 midline. However, a steady rebound into the bullish region would indicate that bullish is increasing and bolster the uptrend above the 50- and 200-day EMAs.

Still, the descending trend line from $261 limits the upside, with resistance seen near $166. Furthermore, the prior rising support from $125 was broken around $149, reinforcing the bearish tone.
A break above $160 round-number resistance could open a recovery above the 100-day EMA at $182, whereas failure to reclaim the broken support would keep sellers in control and maintain pressure under the moving average cluster.
An Exchange-Traded Fund (ETF) is an investment vehicle or an index that tracks the price of an underlying asset. ETFs can not only track a single asset, but a group of assets and sectors. For example, a Bitcoin ETF tracks Bitcoin’s price. ETF is a tool used by investors to gain exposure to a certain asset.
Yes. The first Bitcoin futures ETF in the US was approved by the US Securities & Exchange Commission in October 2021. A total of seven Bitcoin futures ETFs have been approved, with more than 20 still waiting for the regulator’s permission. The SEC says that the cryptocurrency industry is new and subject to manipulation, which is why it has been delaying crypto-related futures ETFs for the last few years.
Yes. The SEC approved in January 2024 the listing and trading of several Bitcoin spot Exchange-Traded Funds, opening the door to institutional capital and mainstream investors to trade the main crypto currency. The decision was hailed by the industry as a game changer.
The main advantage of crypto ETFs is the possibility of gaining exposure to a cryptocurrency without ownership, reducing the risk and cost of holding the asset. Other pros are a lower learning curve and higher security for investors since ETFs take charge of securing the underlying asset holdings. As for the main drawbacks, the main one is that as an investor you can’t have direct ownership of the asset, or, as they say in crypto, “not your keys, not your coins.” Other disadvantages are higher costs associated with holding crypto since ETFs charge fees for active management. Finally, even though investing in ETFs reduces the risk of holding an asset, price swings in the underlying cryptocurrency are likely to be reflected in the investment vehicle too.
(The technical analysis of this story was written with the help of an AI tool)
Bitcoin’s recent price tumble has been a topic of intense discussion in the crypto community. As of November 20, Bitcoin’s price hit a new weekly low below HK$89,000. Despite this, some key players, like Michael Saylor, maintain an optimistic view on Bitcoin investments. This continuous downfall in Bitcoin’s value, coupled with market volatility and declining ETF inflows, poses crucial questions for investors. Our analysis dives into these market trends, investor sentiments, and the optimistic approach of leaders like Saylor.
As of November 20, Bitcoin (BTCUSD) has seen its price fall to approximately HK$91,461.6, a significant 1.56% decline compared to the previous day. The day’s range spanned from a low of HK$88,483.12 to a high of HK$92,948.0, marking a new low in its recent trends. The Relative Strength Index (RSI) stands at 28.01, indicating that Bitcoin is in the oversold territory. Technical indicators suggest a strong downward trend, reflected by its ADX score of 37.94.
This consistent drop could worry investors focused on short-term gains, yet Bitcoin maintains a Year-to-Date (YTD) increase of 11.39%. Analysts suggest this volatility is partly due to global economic uncertainties affecting investor sentiment and trading volumes. For real-time data, follow discussions on platforms like Twitter where the sentiment shifts could be gauged.
Despite the decline, Michael Saylor, chairman of MicroStrategy (MSTR), is bullish on Bitcoin’s long-term potential. Saylor believes that Bitcoin is the future of large-scale financial strategies, viewing current market conditions as a buying opportunity rather than a setback.
MicroStrategy’s stock price (MSTR) recently dropped by 9.82%, closing at HK$186.5, leading some investors to re-evaluate their positions. However, Saylor’s firm continues to hold a substantial Bitcoin inventory, confident in the asset’s potential to rebound and appreciate significantly over the long term.
ETF outflows have also contributed to Bitcoin’s recent price pressure. Many analysts suggest that profit-taking and risk-off sentiments are driving these outflows. This shift in investor sentiment is perceptible in the trading volumes, which have been significantly high, showing increased market activity but little price recovery.
Platforms like Robinhood (HOOD), despite being involved in crypto trading, saw a 3.38% increase in stock price, closing at HK$118.16. This indicates investor optimism in platforms that facilitate crypto trades, even amidst market downtrends. This mixed sentiment is critical for investors to monitor; understanding market mood is essential for navigating the current crypto landscape.
For investors in Hong Kong and worldwide, Bitcoin’s price decline presents a complex picture. The short-term technical indicators emphasize caution. However, the long-term investor perspective, fueled by optimists like Michael Saylor, remains resilient.
Predictions indicate a potential rebound with quarterly forecasts estimating Bitcoin to possibly rise to HK$138,747.08, though this remains speculative. Diversifying portfolios and maintaining a keen eye on market signals could provide advantages in these volatile times.
Investors should leverage platforms like Meyka for real-time insights and predictive analytics to navigate these changes effectively.
Bitcoin’s price decline has fueled varying sentiments among investors and market analysts. The technical indicators suggest caution in the short term, but long-term believers like Michael Saylor see this as an opportunity masked by temporary volatility. ETF outflows add another layer of complexity, making it essential for investors to stay informed and vigilant. As we move forward, platforms providing real-time financial insights, such as Meyka, become invaluable resources for investors aiming to strategically navigate the ever-changing crypto landscape. Adoption strategies, risk management, and keen analysis will be crucial for successful investment outcomes.
Bitcoin’s decline to around HK$91,461.6 has stirred uncertainty among investors. ETF outflows and global economic factors contribute to a cautious outlook in the short term, further reflected in heightened volatility.
Michael Saylor maintains a bullish stance on Bitcoin. He sees current market dips as buying opportunities, confident in Bitcoin’s long-term potential to outperform traditional assets.
ETF outflows can drive down Bitcoin’s price by reducing investment inflows and escalating risk-off sentiment. This creates pressure on price recovery amidst enlarged trading volumes.
Platforms like Meyka provide investors with real-time insights and predictive analytics to better understand market trends, manage risks, and capitalize on potential investment opportunities.
Disclaimer:
The content shared by Meyka AI PTY LTD is solely for research and informational purposes.
Meyka is not a financial advisory service, and the information provided should not be considered investment or trading advice.
Dogecoin Price Prediction (https://www.forbes.com/digital-assets/assets/dogecoin-doge/) only matters when it stops being a meme and becomes a conversation about behavior, liquidity and who is actually pressing the buttons during busy hours. Recent sessions have been a little less crazy, with volatility spread out across the day instead of all in one messy spike, and that changes how traders frame any serious Dogecoin Price Prediction. In that calmer backdrop Pepenode (PEPENODE) (https://pepenode.io/) has started to show up on a few watchlists as a secondary meme play, not a replacement, quietly sitting in the corner while DOGE sucks up all the headlines.
Market Weather Around DOGE
Across the bigger caps the mood has moved from panic to curiosity and that matters a lot for any coin that lives on narrative. Some desks say the most reliable follow through still shows up at the overlap of Europe and the US, when books refill, spreads tighten and big tickets clear without blowing up the chart. For DOGE that means structure has a say again, instead of just emotion. Sudden spikes still happen but they are meeting more liquidity and slightly more disciplined exits than a few weeks ago.
Order Flow And What Traders Actually Look At
Behind every Dogecoin (https://www.binance.com/en/academy/articles/what-is-dogecoin) Price Prediction that’s worth the name there’s usually a boring little checklist that the more experienced traders run through almost on autopilot. They look at whether spot leads futures during real moves or just chases, how much size the book can absorb before slippage gets painful and whether volume is building up gradually or coming in bursts. On-chain activity, such as unique active wallets and the persistence of transactions after a green candle, helps separate short lived hype from sustained participation. Even social chatter gets graded, with many people quietly filtering out obvious bots and recycled memes.
Key Zones And Short Term Dogecoin Scenarios
Most desks have the same map, even if they never post the screenshot. Underneath the noise is a band of support that has already been tested a few times without breaking, and a region of old supply that’s now an obvious ceiling for any near term move. Between those levels three simple paths keep coming up in conversations. The first is a slow grind higher with annoying pullbacks that still respect supports. The second is a sideways chop that wears everyone out. The third is a clean break of the floor which usually forces traders to reset their Dogecoin view entirely.
Where Pepenode (PEPENODE) Fits In The Meme Hierarchy
Pepenode (PEPENODE) (https://pepenode.io/) has been popping up in conversations whenever people talk about rotating part of their meme exposure into something earlier in its story but not completely detached from reality. Some traders describe it as a satellite position to a core DOGE holding, a smaller bet that might move faster when risk appetite improves, while still respecting basic market hygiene. What makes Pepenode interesting to a few desks is not only the branding but the attempt to build a rhythm that people can actually follow, instead of dumping every announcement into one noisy weekend spree and then going quiet for months.
Liquidity, Listings And Community Behaviour Around Pepenode
For a younger meme coin like Pepenode, liquidity and community behaviour often matter more than any single headline. Traders look at how tight the spreads are during busy hours, how quickly the order books refill after a big move and whether new listings show up on venues that real money actually uses. Some holders mention that communication has been reasonably transparent so far, with updates that admit delays instead of pretending everything is perfect. Growth in smaller wallet cohorts and the willingness of early participants to stick around after the first wave of excitement fades may end up being more important than one big green day.
Risk Management Habits That Keep Traders In The Game
Whether it’s DOGE or Pepenode, the boring part still decides who survives the next dip. Many traders write down their invalidation level before entering, then size the position so that a normal drawdown hurts the ego but not the life savings. Adds tend to happen on pullbacks into planned areas rather than on candles that are already vertical. Partial profit taking around prior highs, psychological round numbers or key moving averages helps keep a sense of control. Leverage, if it appears at all, is treated like a tool in a workshop, not a reckless button for slow evenings.
Red Flags That Kill Any Dogecoin Price Prediction
Even the most careful Dogecoin Price Prediction can be shredded in one ugly session when a few obvious warning signs line up. A sudden drainage of liquidity in Bitcoin or Ethereum, combined with thin books, usually hits meme names first, which often shows up as gappy price action and painful slippage at realistic size. Regulatory headlines or exchange specific rumours can freeze risk appetite regardless of chart patterns. Another red flag appears when on-chain usage quietly fades while perpetual funding and aggressive long positioning stay elevated, a mix that suggests speculation outruns real demand. In that environment trimming exposure usually makes more sense than inventing a new narrative.
Simple Workflow For DOGE And Pepenode
Some traders stay sane by building a very simple workflow and repeating it instead of improvising after every tweet. They have a clean DOGE chart with only a couple of moving averages, mark the key support and resistance zones and review price at fixed times instead of staring all day. Pepenode sits on a neighboring screen for relative strength checks, especially during risk on windows when liquidity feels healthier. A lightweight watchlist of on-chain and volume indicators, plus a short journal of entries and exits, often does more for performance than any complicated model that nobody actually updates.
What Could Surprise To The Upside
Surprises don’t have to be negative. A good improvement in macro risk appetite, a few sessions where majors trend cleanly without brutal intraday reversals and some real transaction activity on the Dogecoin network could all be positive for a more bullish Dogecoin Price Prediction. In that environment a smaller meme like Pepenode might get some spillover attention if it proves it can handle increased size without blowing up. None of this is guaranteed but traders who have mapped these catalysts out in advance usually react faster than those who discover them live on the chart.
Conclusion: Dogecoin Price Prediction With Pepenode As A Satellite
Right now the most realistic Dogecoin Price Prediction is more of a conditional statement than a prophecy. If supports hold, majors are orderly and on-chain usage doesn’t collapse, DOGE can continue to grind higher in uneven steps that annoy impatient traders and reward those who plan their adds. In that same window Pepenode (PEPENODE) (https://pepenode.io/) can be a satellite play for those who understand the extra risk and track depth. Trade the tape you see, not the cartoon in your head, size positions so you can sleep and let consistency do more work than any single lucky screenshot.
Buchenweg 15, Karlsruhe, Germany
For more information about Pepenode (PEPENODE) visit the links below:
Website: https://pepenode.io/
Whitepaper: https://pepenode.io/assets/documents/whitepaper.pdf
Telegram: https://t.me/pepe_node
Twitter/X: https://x.com/pepenode_io
Disclosure: Crypto is a high-risk asset class. This article is provided for informational purposes and does not constitute investment advice.
CryptoTimes24 is a digital media and analytics platform dedicated to providing timely, accurate, and insightful information about the cryptocurrency and blockchain industry. The enterprise focuses on delivering high-quality news coverage, market analysis, project reviews, and educational resources for both investors and enthusiasts. By combining data-driven journalism with expert commentary, CryptoTimes24 aims to become a trusted global source for emerging trends in decentralized finance (DeFi), NFTs, Web3 technologies, and digital asset markets.
This release was published on openPR.
Cardano price has slipped into a key long-term support zone, drawing attention as participants assess whether this deep pullback sets the stage for its next major recovery move.
Cardano price has dropped into fresh 90-day lows, and the market is finally starting to treat this move as a full capitulation phase. What makes this moment interesting is that these deep pullbacks have historically marked the same zones where Cardano begins building its strongest recoveries. With sentiment washed out and positioning heavily reset, ADA is entering one of those rare periods where long-term opportunity and short-term pressure are converging.
Cardano price is trading around $0.48, up 2.87% in the last 24 hours. Source: Brave New Coin
Market sentiment around ADA has slipped into full capitulation territory, with price sitting at fresh 90-day lows while Alex expresses clear despair. These conditions often appear late in a downtrend, and historically, ADA has shown its strongest rebounds from similar exhaustion phases. The broader conversation across the ADA community hints that many retail participants have already exited, leaving repositioning opportunities for patient buyers who understand Cardano’s long-cycle behavior.

Cardano price has now slipped into a deep capitulation zone at 90-day lows, a level where past cycles have often sparked sharp recovery phases. Source: Alex via X
The tone across social platforms reflects a classic oversold environment: fear is high, conviction is low, and short-term emotions are overshadowing fundamentals. These phases rarely last long, but they do create conditions where accumulation becomes more favorable for long-term participants.
Santiment’s 30-Day MVRV metric shows ADA sliding into the “Extreme Buy Zone,” where previous negative-MVRV stretches have produced outsized recovery moves. The chart highlights that most recent buyers are underwater, a typical bottom-building condition where selling pressure becomes depleted. Historically, when ADA enters this area, volatility follows, often to the upside.
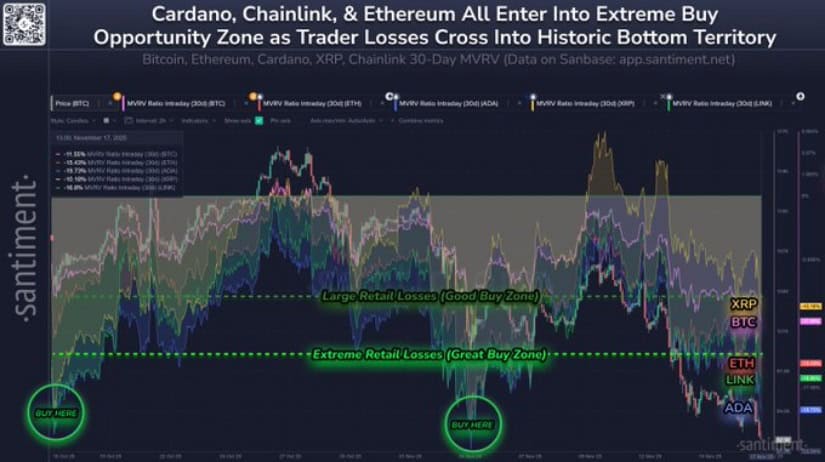
ADA’s 30-Day MVRV has dropped into the Extreme Buy Zone, a level that has repeatedly triggered strong rebound phases in past cycles. Source: Coin Bureau via X
This on-chain context reinforces that the current drawdown is less about fundamentals and more about market positioning. As broader altcoins like LINK and ETH also dip into negative MVRV zones, the data suggests a synchronized value pocket forming across major L1 ecosystems, with ADA sitting closer to the deeper end of that zone.
TapTools’ chart shows Cardano price pressing into a long-term structural support around $0.45, a level that has historically acted as a cycle reset point. Price is trading below the 25-day and 99-day moving averages, showing clear momentum loss, but the multi-year support band sitting just below current levels has repeatedly produced strong medium-term reactions.
This is the area where long-term participants typically accumulate, especially when confluence aligns across moving averages, volume behavior, and historical trend reversals. If this support does its job again, ADA could stabilize and form a base for its next structural expansion.
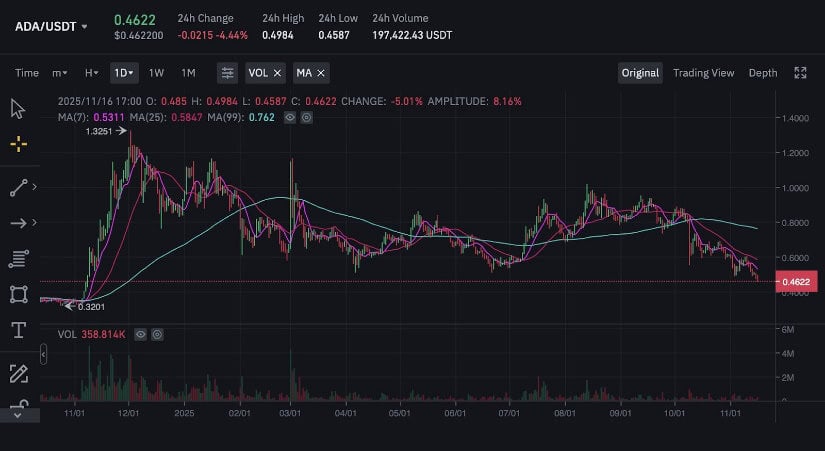
ADA is now testing a long-term support band near $0.45, a zone that has repeatedly triggered strong trend resets in previous cycles. Source: TapTools via X
Cardano’s weekly structure, shared in the Smcapitalclub’s chart, reveals a key demand block sitting just beneath current price, aligning perfectly with the long-term accumulation zone. Even if ADA prints a small bounce from here, the macro trend still leans towards a continuation into the lower part of the demand region unless buyers step in aggressively.

ADA’s weekly chart highlights a key demand block pointing towards the $0.36–$0.40 zone, the next major liquidity region on Smcapitalclub’s structure. Source: Smcapitalclub via X
Targets on the chart show the next major level between $0.36 and $0.40, where previous consolidation and liquidity buildup occurred. If Cardano price fully taps that region, it would complete a textbook cycle repetition, creating conditions for a stronger multi-week reversal. This remains the key area to watch for a sustainable trend shift.
ADA’s community sentiment is beginning to stabilize, while analyst Sssebi warns that selling at these levels historically leads to regret. The chart shows Cardano price grinding down a clean descending structure, but also highlights oversold conditions and weakening downside momentum.
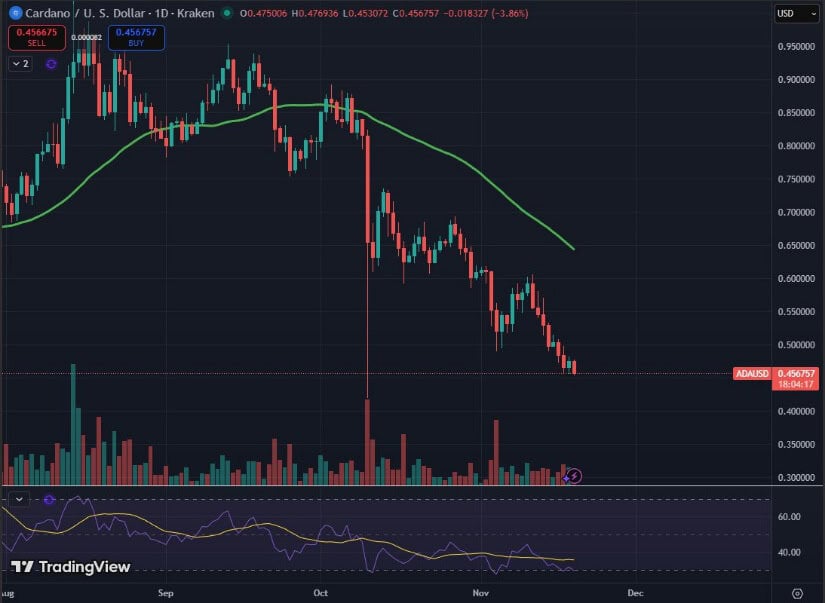
ADA’s community sentiment is stabilizing, with many warning that selling at these oversold levels has historically proven premature. Source: Sssebi via X
The conversation in the community is shifting towards accumulation rather than panic. Long-term stakers and analysts emphasize that Cardano tends to move in sharp cycles; the deepest sell-offs often happen right before trend resets. This aligns with the broader on-chain and technical context, indicating exhaustion rather than a fresh bearish continuation.
Cardano price now sits at the intersection of macro support, on-chain value zones, and sentiment capitulation, the same ingredients that shaped previous mid-cycle reversals. ADA charts show room for one more liquidity sweep towards the $0.36–$0.40 zone, but the broader structure looks increasingly mature for a reset.
What matters from here is whether ADA can stabilize, reclaim its short-term moving averages, and rebuild structure in this high-value region. With a negative MVRV flashing opportunity and long-term support approaching, the risk-reward profile strengthens for patient accumulation while volatility remains elevated.
The mix of institutional optimism and market caution has heightened attention among traders, analysts, and long-term holders.
While ETF launches can introduce fresh liquidity, their impact often varies depending on macroeconomic conditions, investor risk appetite, and prior market positioning. Historical cases show that some ETF debuts have caused strong price moves, while others have resulted in muted market reactions, highlighting the need for measured expectations.
Several asset managers, including Franklin Templeton and Bitwise, are launching XRP ETFs this week. Franklin Templeton’s ETF, listed under the ticker EZRP, is scheduled to debut on the CBOE on November 18, shortly after Canary Capital’s XRP ETF recorded $58 million in first-day trading volume. Bitwise is planning its second major crypto ETF on November 20, following a successful Solana ETF rollout last month.
Franklin Templeton’s XRP ETF (EZRP) goes live on Tuesday, followed by Bitwise on November 20, marking a potentially significant week of institutional liquidity inflows. Source: Diana via X
According to ETF strategists cited on TradingView and market research desks, the presence of established financial brands can attract institutional participation. However, they caution that inflows depend not just on the ETF launch itself but also on broader market sentiment and liquidity conditions.
ETF analysts note that while early inflows are possible, these events do not guarantee sustained upward price movement. ETF launches may catalyze demand, but historical patterns suggest that outcomes can vary depending on macroeconomic conditions and market positioning. Market Sentiment and $2 Support
XRP currently trades around $2.21, only slightly above the psychological $2 support zone. On-chain metrics, such as Glassnode’s Net Unrealized Profit/Loss (NUPL), show long-term holders shifting from “belief/denial” to “optimism/anxiety.” NUPL transitions can indicate changes in investor conviction and potential caution before price rallies or corrections, making it a useful tool for gauging market sentiment.

Long-term XRP holders have shifted from euphoria to denial, with growing anxiety as the price teeters near $2. Source: Ali Martinez via X
Social media commentary reflects a spectrum of expectations. For instance, EGRAG Crypto, a technical analyst on X, noted, “XRP could decline slightly before a potential rally, given the current support dynamics,” while trader Javon Marks referenced prior ETF cycles to highlight that structured liquidity inflows could lead to substantial upside—but emphasized that uncertainty remains.
Analysts generally highlight that holding the $2 support level is critical, as a breach could trigger broader short-term downside pressure.
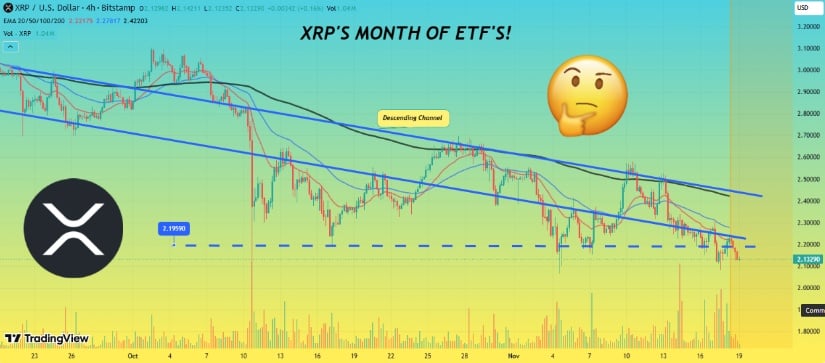
Technical analysts observing XRP note that the price is forming a bullish pattern within a descending channel, with higher lows supporting potential upward movement. A breakout above $2.195 is often cited as an early confirmation signal for continuation toward $2.24–$2.30, though analysts stress that these projections rely on price respecting lower support bands.
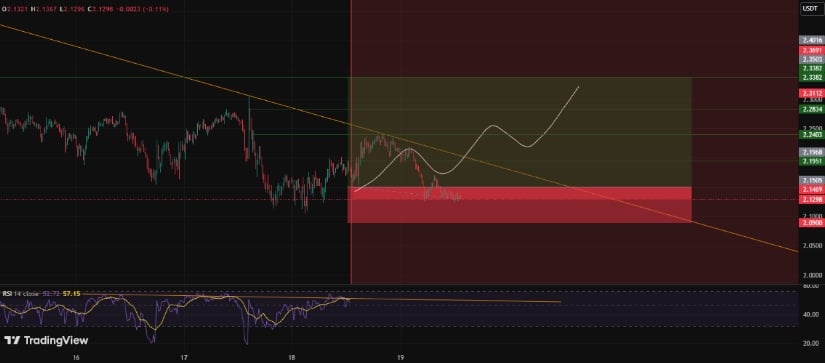
XRP/USDT is holding strong support at 2.10–2.12, with a bullish structure aiming for 2.195–2.330, while maintaining a stop-loss at 2.090. Source: mastercrypto2020 on TradingView
Chart analysts caution that a close below $2.09 would invalidate bullish setups, potentially signaling further downside. Such assessments are derived from standard technical analysis methods, including trendline validation and channel breakout measurements, and should be interpreted alongside broader market context.
Recent market data shows short-term anomalies, such as a “flash wick” on Kraken moving XRP/USD briefly from $2.18 to $2.1979. TradingView contributors note that such wicks often reflect isolated liquidity imbalances rather than lasting structural price changes.
XRP remains resilient above $2.10, with ETF launches and technical patterns hinting at a potential bullish breakout. Source: Rocksorgate on TradingView
Additionally, on-chain tracking revealed a $95 million XRP transfer to Binance, which could indicate repositioning by larger holders (“whales”). Analysts caution that while large transfers can precede significant moves, these events are not always predictive and should be viewed in combination with ETF flows, technical levels, and overall market conditions.
Bitcoin’s recent decline (~14% from $115,000 to ~$94,000–$95,000) has added broader market pressure, but XRP has maintained relative resilience above key support levels.
Traders, long-term holders, and institutional observers are monitoring several key factors this week:
ETF inflows: Potentially increasing liquidity, but outcomes vary.
Support levels: $2 remains a critical threshold; breaches could trigger short-term downside.
Technical confirmations: Breakouts above $2.195 could suggest upward momentum, but descending-channel dynamics must be respected.
Market sentiment and on-chain metrics: Tools like NUPL offer insight into long-term holder positioning, but signals are probabilistic, not deterministic.
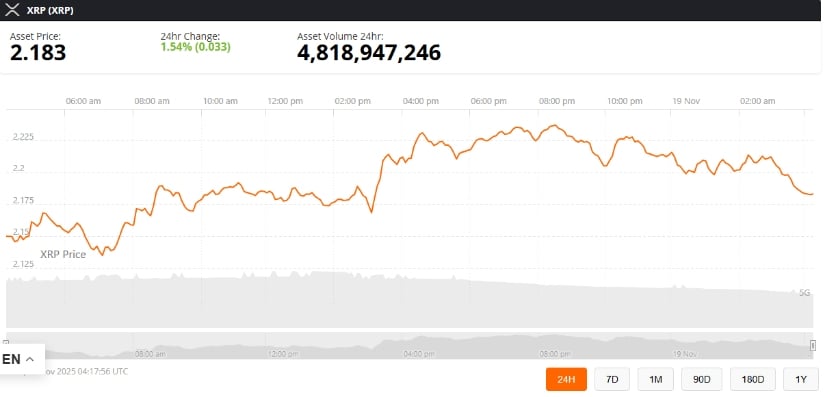
XRP was trading at around 2.18, up 1.54% in the last 24 hours at press time. Source: XRP price via Brave New Coin
While ETF launches provide a catalyst for renewed institutional interest, analysts emphasize balanced expectations. “The market structure is improving, but risks remain—both from macro volatility and the possibility that ETF-driven demand is partially priced in,” noted a senior ETF strategist.
For now, attention centers on EZRP’s debut on November 18 and Bitwise’s follow-up launch, as XRP’s ability to stabilize near $2 will determine whether renewed institutional liquidity translates into meaningful price action.
Solana price is showing renewed strength, rebounding sharply from key support as participants watch for signs of a broader trend reversal.
Solana price is starting to stand out again, breaking away from the broader market slowdown with a sharp push back into strength. After days of pressure, buyers are finally stepping in with confidence.
Solana Price is leading the broader crypto rebound, posting one of the strongest 24-hour recoveries among top assets. Momentum has shifted firmly back into green territory, with price climbing more than 7% while most majors still lag behind. This kind of relative strength often signals early rotation, especially when a coin begins reclaiming levels quicker than the rest of the market.
Solana’s strong 24-hour rebound places it among the market’s top performers. Source: The Solana Floor via X
The move above $140 also aligns with the start of a broader sentiment recovery after weeks of sustained selling pressure. With SOL climbing the leaderboard again, The Solana Floor is beginning to reassess whether this could mark the early stages of a momentum reset.
On-chain data and chart structure both point towards $130 acting as a potential cyclical bottom. The zone has shown reactive buying multiple times, while intraday liquidity sweeps have failed to produce continuation to the downside, often an early sign of exhaustion among sellers.

Solana’s on-chain strength and repeated reactions from the $130 zone signal a potential cyclical bottom forming. Source: Cointelegraph via X
The on-chain metrics add conviction: network volumes remain elevated, staking activity continues rising, and long-term holder accumulation is strengthening. This blend of technical support + improving on-chain sentiment increases the probability of a recovery towards the $180–$200 region if momentum extends.
Hardy’s chart highlights a developing daily bullish divergence, with price forming lower lows while RSI begins to curl upward. This type of structure often appears near local bottoms.
Technically, the next reaction zones sit at $150, $175, and the major reclaim level at $200. The drawn projection suggests a rounded bottom forming between $132 to $139, which, if confirmed, typically transitions into a mid-trend reversal.
As long as Solana price defends the support wick region around $135, the divergence setup remains valid.
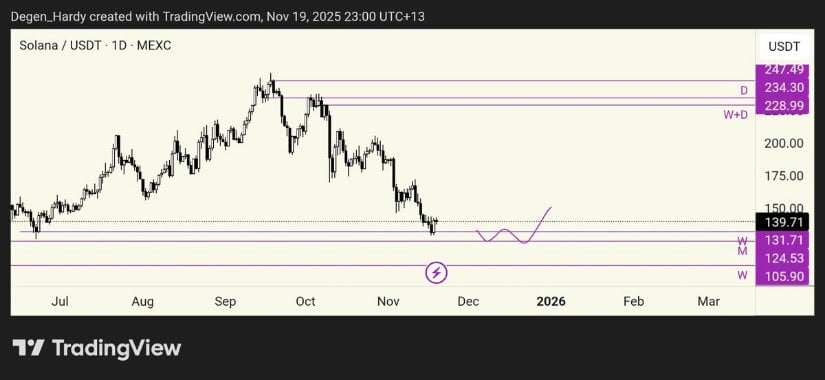
SOL’s chart captures a clean bullish divergence developing on the daily timeframe, hinting at a potential mid-trend reversal. Source: Hardy via X
Crypto analyst TraderSZ believes that SOL’s performance relative to ETH and BNB is beginning to show early signs of rotation. The ratio chart has bounced from a multi-month floor and is attempting to reclaim its immediate resistance band.

Solana’s ratio charts against ETH and BNB are rebounding from a multi-month floor, hinting at early rotational strength. Source: TraderSZ via X
A move above 0.046–0.047 on the SOL/ETH pair would confirm the start of a new dominance leg. Meanwhile, the SOL/BNB structure shows a similar early recovery, indicating that SOL may be gearing up to outperform majors if momentum continues.
Heatmap data shared by TED shows that most downside liquidity has already been cleared out during the recent selloff, an important structural shift. Above current price, the next dense cluster sits in the $170 to $200 region, meaning that any upside continuation is likely to gravitate toward this zone.

Heatmap data reveals a heavy liquidity pocket between $170 and $200, acting as the key upside magnet for SOL. Source: TED via X
This range contains heavy resting orders, previous inefficiencies, and major stop-loss pockets, making it the first meaningful upside magnet once SOL stabilizes above the lower range. If markets show even a mild rebound, liquidity mechanics alone could pull SOL towards these levels.
Solana’s latest rebound shows a shift in both technicals and market sentiment. The $130–$140 zone continues to act as strong structural support, on-chain data points towards accumulation, divergences are forming, and liquidity above price is stacked in the $170–$200 band.
If buyers maintain control above support and Solana price continues outperforming majors, a move back to the $180 to $200 region becomes increasingly realistic. For now, the recovery is still early, but the structure for a broader trend reversal is finally aligning.

Bitcoin was trading at $89,090, down 4% over the past 24 hours with $71 billion in daily trading volume, as per a Bitcoin Magazine report. The cryptocurrency remains 4% below its weekly high of $93,662 and only slightly above its seven-day low of $88,800, as per the report. With 19.95 million BTC in circulation out of 21 million, Bitcoin’s market value now sits at $1.78 trillion, reported Bitcoin Magazine.
The weakness spilled into crypto equities: Coinbase Global dropped 4.9%, Bitfarms fell 7.5%, Strategy slipped 10.3%, Riot Platforms lost 3.7%, Hut 8 Mining declined 3.3%, and Mara Holdings fell 6.6%, as per the report.
A major driver of the sell-off came from Bitcoin ETF flows. BlackRock’s spot Bitcoin ETF, IBIT, saw a record $523.2 million in outflows on Tuesday, its largest single-day withdrawal since launching in January 2024, as per the report. The exit came even though Bitcoin briefly rallied above $93,000 earlier in the week.On average, IBIT investors bought in at about $90,146, leaving many underwater at current prices.While short-term moves remain heavily sentiment-driven, analysts say broader trends are being shaped by liquidity conditions, as per the report. Sentiment indicators are sitting near multi-year lows, suggesting weaker trading activity but potentially more appealing entry points for long-term buyers, reported Bitcoin Magazine.
Bitcoin miners have also started adjusting to the volatility. After a period of heavy selling, miners have shifted to modest accumulation over the last 30 days following recent capital raises, a sign they are choosing to hold more mined BTC instead of selling, as per the report.
Liquidity Amplifies Crypto Market VolatilityDespite the turbulence, observers say Bitcoin’s underlying fundamentals remain intact. Liquidity trends and continued institutional participation point to the Bitcoin price stabilizing near the $90,000 range as markets digest recent volatility, reported Bitcoin Magazine.
But thin liquidity is amplifying every move. Nicolai Søndergaard of Nansen told Bitcoin Magazine that market depth has dropped by about 30% since the October 10 liquidation, as per the report. With less depth, even small sell orders can push prices sharply lower, especially with leverage in the system.
Søndergaard said, “When liquidity is this thin, it takes far less capital to push the market in either direction, and when you layer leverage on top, volatility becomes inevitable,” as quoted by Bitcoin Magazine.
The mood turned noticeably bearish after Bitcoin fell below the $96,000 weekly support level last week. Analysts from Bitcoin Magazine Pro and Feral Feral Analysis warned that a rebound would be difficult, citing heavy resistance above $94,000 and persistent selling pressure, as per the report.
They highlighted strong support between $83,000 and $84,000, with another key zone at $69,000–$72,000, saying a move into the mid-$80,000s was increasingly likely, reported Bitcoin Magazine. On the upside, even a short squeeze would have met major resistance at $106,000–$109,000, as per the report. Analysts noted that only a weekly close above $116,000 would start to challenge the prevailing downtrend, as per Bitcoin Magazine.
Why is Bitcoin price down right now?
Bitcoin is falling mainly because of weak sentiment, thin liquidity, and large ETF outflows that triggered more selling.
Why are crypto-related stocks falling too?
Crypto equities like Coinbase and Riot tend to move with Bitcoin, so the decline dragged them down as well.
The best support level of Dogecoin is at $0.08, with 27.4 bn coins being concentrated there. This is an indicator of good price stability and gets the currency ready to take the next big step.
Dogecoin is still unbelievably strong, with huge support at 0.08. Based on the current on-chain data, there are 27.4 billion coins of Dogecoin at this level, which is the largest support area of the cryptocurrency.
The cluster provides a reliable floor price that attracts steady buying interest and cushions against price volatility.
Dogecoin is pegged at $0.08 and offers a decent foundation on which subsequent price dynamics will be anchored.
According to market watchers on X like Ali Charts, this zone is important in the ongoing demand using heatmaps and technical analysis.
Source – X
You might also like: Dogecoin News: Grayscale Set to Debut Historic Dogecoin ETF Next Week
At a current price of over $0.15, Dogecoin has been performing consistently strongly as it sits on the resistance levels above its critical support wall of $0.08.
In spite of the recent decrease in trading volumes, which is indicative of reduced speculative trading in the short term, the fundamental price structure remains intact.
The market cap of Dogecoin is approximately 24 bn, with its support zones containing more than 27 bn coins.
Price floors such as the $0.08 fortress are of great importance since the supply of Dogecoin grows with unlimited issuance.
This amount of accumulation minimizes the selling pressure in the market decline and increases the confidence of probable growth.
The coin price tends to retrace toward powerful support areas, and repeated spikes and dips reveal the $0.08 cluster as the anchor.
The price movement of Dogecoin is exhibiting a strong technical position. Strong buying interest at $0.08 implies that buyers will mitigate sudden sell-offs and drive a steady increase toward resistance around $0.20 or higher if volume rises.
This hotspot of support serves as a catapult, holding the price cushioned far above it. The trend is indicating a balanced perspective with supply-demand forces centered at $0.08.
Cardano continues to face steady downward pressure as traders monitor weakening momentum across major timeframes. The market keeps pushing ADA toward new lows as volatility increases and buyers fail to reclaim important levels. The current structure shows a market driven by caution, with traders responding to each failed bounce by reducing exposure.
ADA trades near $0.4689 after rejecting several recovery attempts on the mid-range oscillators. The 20-SMA stays above the market and acts as firm dynamic resistance. Moreover, lower highs continue to form across the 4-hour cha…
Read The Full Article Cardano Price Prediction: ADA Extends Its Downtrend as Exchange Outflows Build On Coin Edition.
Ripple (XRP) is largely in bearish hands, trading at $2.12 at the time of writing on Wednesday. A bearish wave is stirring volatility in the broader cryptocurrency market amid a prolonged sell-off.
Since XRP hit a record high of $3.66 on July 18, the path of least resistance has generally been downward. Macroeconomic uncertainty, profit-taking, and the lack of prominent price catalysts are some of the factors weighing on the cross-border token.
If risk-off sentiment persists amid weak derivatives and spot markets, the current decline could extend below the critical $2.00 level.
RippleX researcher J. Ayo Akinyele stated that the XRP Ledger has made significant progress over the years, from powering payments and enabling the settlement of real-world assets (RWAs) to supporting real-time liquidity across global markets.
Akinyele argued that the launch of the Canary XRP Exchange Traded Fund (ETF) last week is a sign that adoption is growing, backed by institutional demand. However, the protocol must first figure out how to generate staking rewards and distribute them fairly. The Head of Engineering at RippleX added that native staking on the XRP Ledger could be the next step.
David Schwartz, Ripple’s Chief Technology Officer (CTO), replied to Akinyele’s post in X, saying that he has been mulling over how XRP is used in Decentralised Finance (DeFi).
“With programmability initiatives and smart contract discussions underway, it seemed like a good time for us to also discuss what other DeFi capabilities natively could look like,” Schwartz stated.
Retail demand for XRP has not picked up following the October 10 deleveraging event, which liquidated over $19 billion in crypto assets in a single day.
CoinGlass data on the XRP derivatives market shows the futures Open Interest (OI) averaging $3.85 billion on Wednesday, slightly up from Tuesday’s $3.6 billion but significantly below the $4.17 billion recorded on November 1.

A steady increase in OI is required to support XRP’s short-term recovery, indicating that investors have confidence in the token and the ecosystem and are willing to increase their risk exposure.
Meanwhile, XRP OI-Weighted Funding Rate has risen to 0.0090% on Wednesday from Tuesday’s 0.0005%, as traders increasingly pile into long positions.
The cross-border remittance token must hold above $2.07-$2.10 short-term support to improve risk appetite. Otherwise, signs of further weakness may reinforce the bearish outlook.

XRP teeters above support between $2.07 and $2.10 at the time of writing on Wednesday as bears tighten their grip. The Relative Strength Index (RSI) is at 37 and falling toward oversold territory on the daily chart, which asserts the bearish outlook.
Similarly, the Moving Average Convergence Divergence (MACD) indicator has maintained a sell signal since Sunday. The MACD line in blue remains below the red signal line, suggesting risk-averse action for investors.

A break below XRP’s immediate support at $2.07-$2.10 could validate an extended correction below the critical $2.00 level. The next key area to watch is $1.90, which was last tested in June.
Still, a trend reversal is possible from the current $2.07-$2.10 support if investors increase their exposure while anticipating a steady rebound toward the 50-day Exponential Moving Average (EMA) at $2.46.
An Exchange-Traded Fund (ETF) is an investment vehicle or an index that tracks the price of an underlying asset. ETFs can not only track a single asset, but a group of assets and sectors. For example, a Bitcoin ETF tracks Bitcoin’s price. ETF is a tool used by investors to gain exposure to a certain asset.
Yes. The first Bitcoin futures ETF in the US was approved by the US Securities & Exchange Commission in October 2021. A total of seven Bitcoin futures ETFs have been approved, with more than 20 still waiting for the regulator’s permission. The SEC says that the cryptocurrency industry is new and subject to manipulation, which is why it has been delaying crypto-related futures ETFs for the last few years.
Yes. The SEC approved in January 2024 the listing and trading of several Bitcoin spot Exchange-Traded Funds, opening the door to institutional capital and mainstream investors to trade the main crypto currency. The decision was hailed by the industry as a game changer.
The main advantage of crypto ETFs is the possibility of gaining exposure to a cryptocurrency without ownership, reducing the risk and cost of holding the asset. Other pros are a lower learning curve and higher security for investors since ETFs take charge of securing the underlying asset holdings. As for the main drawbacks, the main one is that as an investor you can’t have direct ownership of the asset, or, as they say in crypto, “not your keys, not your coins.” Other disadvantages are higher costs associated with holding crypto since ETFs charge fees for active management. Finally, even though investing in ETFs reduces the risk of holding an asset, price swings in the underlying cryptocurrency are likely to be reflected in the investment vehicle too.

 Pops Up")
