The main tag of Cryptocurrency price Articles.
You can use the search box below to find what you need.
[wd_asp id=1]
The main tag of Cryptocurrency price Articles.
You can use the search box below to find what you need.
[wd_asp id=1]
Cardano price is hovering above a key support zone, with participants watching closely to see whether it stabilizes for a rebound or breaks lower into deeper downside levels.
Cardano price is once again drifting into a critical support zone, and the market is watching closely to see whether this level can still hold the broader structure together. Momentum has cooled, lower highs continue to stack, and buyers haven’t shown any real strength yet, raising the question of whether ADA is preparing for a deeper slide or gearing up for a rebound.
Cardano’s broader structure continues to lean weak as price grinds lower from a clear sequence of lower highs and lower lows. The recent rejection near $0.60 fed straight into another breakdown, pushing Cardano price back towards the mid-$0.50 region where demand has repeatedly thinned out. Volume remains muted, and each bounce is getting shallower, a sign buyers are struggling to regain momentum.
Cardano price is trading around $0.53, down -2.75% in the last 24 hours. Source: Brave New Coin
If ADA loses the $0.51 to $0.53 band, the next meaningful liquidity pocket sits closer to $0.48. Until the trend breaks above previous LH zones, sentiment stays defensive and rallies remain vulnerable to quick reversals.
Activity around the BodegaCardano prediction stats shows the community is still hopeful for higher levels even as price trades near support. Although ADA has tested the lower range, the majority of votes continue to lean towards avoiding a deeper drop under $0.48, suggesting traders still expect a relief phase rather than a breakdown.

Cardano sentiment remains tilted bullish, with most participants expecting ADA to hold above key support and avoid a deeper breakdown. Source: BodegaCardano via X
This optimism doesn’t cancel the technical risks, but it does highlight lingering confidence that ADA could stabilize and reclaim the mid-$0.60s if buyers step in soon. The community positioning acts as a sentiment buffer even while charts remain fragile.
The recent structure from Sssebi shows Cardano price reacting from the same demand region that sparked a strong rally earlier this year. Two clear lows have now formed around the $0.52 zone, a level that previously produced a sharp upward leg. If this holds as a potential double bottom, early signs of recovery can emerge quickly.
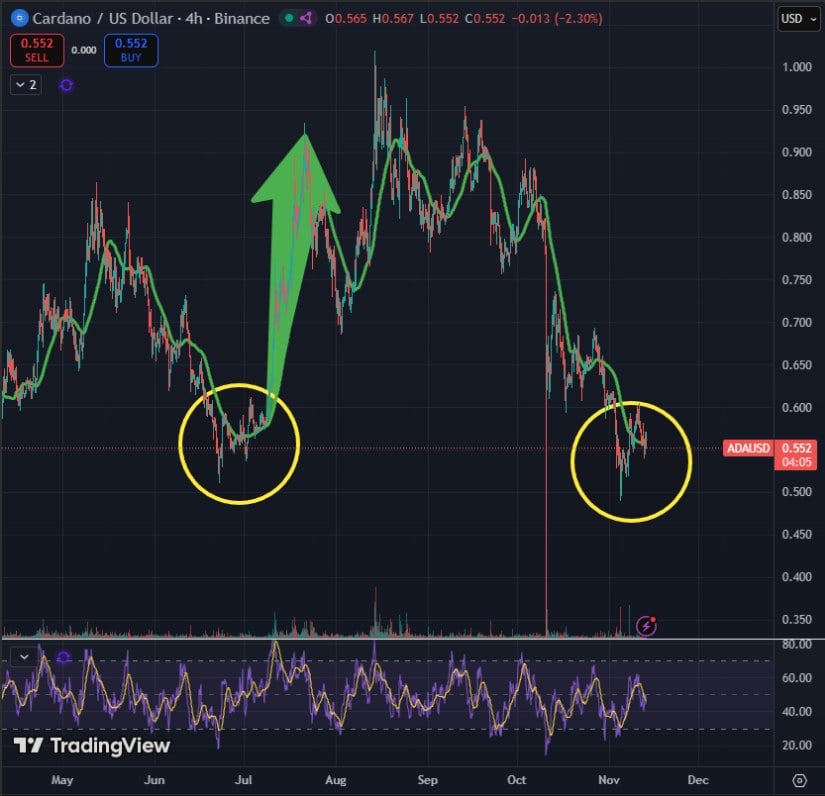
Cardano’s price is testing the same demand zone that triggered a major rally earlier this year, with chart now hinting at a potential double-bottom setup. Source: Sssebi via X
Momentum indicators are also flattening out, hinting at seller exhaustion. A reclaim of $0.58 and then $0.64 would confirm strength, turning this pattern into a genuine reversal setup rather than just another reactionary bounce.
ADA’s trend remains compressed under a descending line, with multiple rejections forming a clean downside structure. Price is currently hanging near $0.50 to $0.53 support, the same zone that prevented a deeper slide earlier. Crypto analyst Mr. CryptoCeek highlights that holding here keeps targets open towards $0.68 and $0.75, especially if RSI continues pushing out of oversold territory.
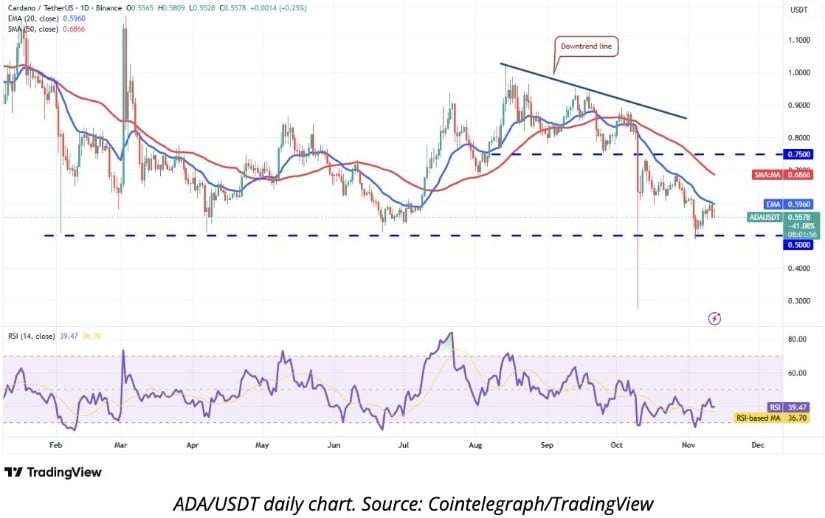
ADA’s battle to hold its $0.50–$0.53 support zone as price compresses under a descending trendline. Source: Mr. CryptoCeek via X
But the risk is clear, if this support breaks, the chart opens room towards $0.40, which aligns with the next major inefficiency area. Bulls now need a clean defense and a break above the trendline to shift momentum back in their favour.
Cardano price is sitting at a technically sensitive zone where both sentiment and structure are competing forces. While on-chain and community indicators show faith in a rebound, the ADA chart still demands caution. A clean defense of $0.50 to $0.53 could stabilize the market and open a path towards mid-range targets, but a failure here exposes a deeper slide towards $0.40. The next reaction at support will define ADA’s short-term direction.
XRP is entering a decisive technical phase this week as traders track a symmetrical triangle pattern that closely resembles Bitcoin’s consolidation before its 2024 breakout.
With ETF inflows gradually stabilizing, improving regulatory clarity, and an emerging Elliott Wave structure on lower timeframes, XRP now sits at a critical junction that could dictate its next major move in November 2025.
While community excitement often spikes around similar setups, the current structure is supported by a broader mix of technical and fundamental catalysts now converging at the same moment.
A recent market comparison highlights structural similarities between Bitcoin’s breakout from its $24,000 consolidation zone in early 2024 and XRP’s ongoing triangle formation near $2.65. The chart, shared by market watcher Steph_iscrypto, points to a near-identical symmetrical triangle that previously preceded a strong Bitcoin rally.
XRP’s $2.65 symmetrical triangle mirrors Bitcoin’s 2024 breakout, hinting at a potential explosive move. Source: @Steph_iscrypto via X
However, symmetrical triangles—especially on high-liquidity assets—carry a breakout success rate that varies depending on market conditions. Historically, Bitcoin’s triangles following periods of heavy liquidity inflows show a higher probability of continuation, but XRP’s past attempts have been mixed. Several triangle formations over the last decade have failed due to regulatory pressure, thinning liquidity, or broader market risk-off shifts.
This time, the backdrop differs: U.S. regulatory clarity, ETF access, and a notable uptick in institutional order flow provide structural support that XRP did not benefit from in earlier cycles. These conditions strengthen the case for a breakout but do not guarantee follow-through without volume confirmation at the upper boundary of the pattern.
XRP’s regulatory landscape shifted significantly after Ripple and the SEC reached a $125 million settlement in August 2025—an outcome documented in court filings that officially ended years of uncertainty over the asset’s status. With appeals dismissed, U.S. exchanges and asset managers resumed direct engagement with XRP products.
This led to the launch of seven spot XRP ETFs on November 13, 2025, which collectively generated approximately $58 million in first-day volume, according to issuer dashboards and exchange data. While XRP declined around 8% in a classic “sell-the-news” move, ETF demand offers a longer-term liquidity base rather than a short-lived speculative spike.
Additional buying activity from Japan and South Korea, two markets with historically strong XRP adoption, has also contributed to steadier inflows over the past month. This cross-regional demand helps create a more consistent liquidity profile—an important factor when evaluating whether a triangle breakout can sustain momentum.
The XRP/BTC pair has become a critical sentiment gauge for traders assessing whether XRP can outperform Bitcoin in the near term. Analyst @jaydee_757 highlighted a potential weekly resistance break supported by a bullish MACD crossover—an indicator that often signals strengthening relative momentum when confirmed on higher timeframes.

A weekly breakout on the XRP/BTC chart could signal XRP outperforming Bitcoin, according to the trader’s technical setup. Source: @jaydee_757 via X
A close above the long-term descending trendline would mark XRP’s most notable structural shift against Bitcoin since mid-2021. From a technical standpoint, this matters because XRP rallies historically perform better when its BTC pair trends upward, reflecting improving capital rotation rather than isolated spot-price volatility.
Still, traders generally look for multi-week confirmation and consistent volume before treating such shifts as trend reversals rather than temporary spikes.
On the 4H chart, analysts tracking Elliott Wave behavior identify a developing Wave 3, with the 1.618 Fibonacci extension projecting a move toward $2.62. This target also aligns with the upper boundary of the symmetrical triangle, making it a key confluence zone.
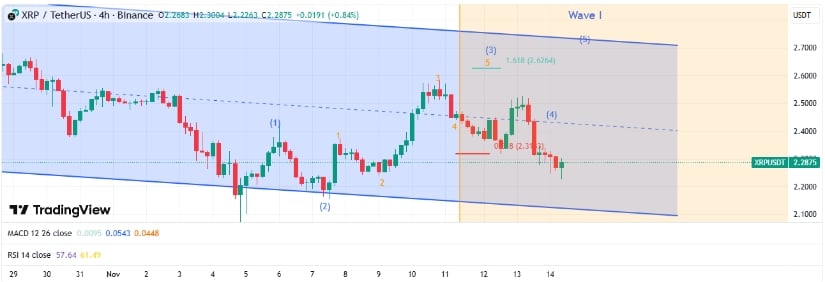
XRP Elliott Wave analysis shows Wave 3 targeting $2.62, with $2.31 as key invalidation for the bullish setup. Source: abdulahalkasid on TradingView
A decisive close below $2.31 would invalidate the current impulse count and shift expectations toward a corrective scenario. Historically, XRP has seen multiple invalidations of early wave structures during periods of low liquidity or uneven ETF inflows, so risk management remains important for traders tracking the setup.
For readers evaluating breakout legitimacy, common confirmation metrics include volume expansion at the triangle’s upper boundary, wick-to-body candle strength, and funding rate normalization during upside volatility.
Beyond charts, several fundamentals provide context for the current setup:
These elements collectively strengthen—but do not guarantee—XRP’s ability to mirror Bitcoin’s prior price performance.
XRP sits at a pivotal point where technical structure, fresh regulatory clarity, ETF-supported liquidity, and improving XRP/BTC momentum intersect. While the symmetrical triangle resembles Bitcoin’s 2024 pattern, XRP still needs a clear breakout above the $2.62 zone, supported by volume and confirmation candles, to validate the bullish thesis.

XRP was trading around 2.27, down 7.73% in the last 24 hours at press time. Source: XRP price via Brave New Coin
As the asset nears the apex of its compression zone, traders are preparing for a potential volatility spike—whether it materializes as an upward breakout or another period of extended consolidation depends on the strength of incoming liquidity and the reactions around key support levels such as $2.31.
According to CoinMarketCap data, the cryptocurrency trades at $0.1621, down more than 20% in the past 30 days and 7% in the last 24 hours. The trading volume of the token shot up 48% as the nearest resistance stands at the 20-day EMA at $0.17.
The weekly chart reveals that Dogecoin has slipped out of its long-standing ascending channel and is now retesting the upper boundary of a major demand zone between $0.12 and $0.17. Historically, DOGE prices have rebounded from this level, even during broader market downturns.
As per the weekly chart below, the RSI shows a hidden bullish divergence, with the indicator printing lower lows while price forms higher lows, an early sign that bearish momentum may be decelerating.
This divergence often marks the tail end of correction cycles rather than the beginning of deeper pullbacks.
If the price succeeds in holding the $0.17 zone, a rebound toward the $0.22 area becomes increasingly likely.
Source: TradingView
A sustained breakdown below $0.17 could expose the price to deeper tests of the $0.15 and $0.12, which form the final layers of strong support visible on the chart.
On the other hand, holding this area could allow DOGE to begin building the structure required for a larger macro rally towards the $1 mark.
While Dogecoin aims for $1, Maxi Doge ($MAXI) is carving out its own lane as a meme coin built for traders who want more than just memes – they want real alpha.
MAXI is creating a tight-knit community where retail traders share high-potential setups, uncover hidden gems, and rally together in a market often controlled by whales.

With $4 million already raised in its presale, this ERC‑20 Doge-themed token isn’t just riding hype, it’s building a movement on Ethereum’s secure, battle-tested infrastructure.
MAXI doesn’t pretend to fix the global financial system, it gives everyday traders a voice, a platform, and a shot at making serious gains.
To purchase the token at the current price of $0.000268, visit the official Maxi Doge website and connect a supported wallet, such as Best Wallet.
You can swap existing crypto or use a debit/credit card to complete the payment.
However, hurry because prices increase in 1 day, 16 hours.
Disclaimer: Coinspeaker is committed to providing unbiased and transparent reporting. This article aims to deliver accurate and timely information but should not be taken as financial or investment advice. Since market conditions can change rapidly, we encourage you to verify information on your own and consult with a professional before making any decisions based on this content.

A crypto journalist with over 5 years of experience in the industry, Parth has worked with major media outlets in the crypto and finance world, gathering experience and expertise in the space after surviving bear and bull markets over the years. Parth is also an author of 4 self-published books.
Cardano Price Prediction 2025-2030: Will ADA Achieve the $2 Breakthrough?
As the cryptocurrency market continues to evolve, investors are eagerly watching Cardano’s ADA token and wondering about its potential to reach the coveted $2 milestone. With blockchain technology advancing rapidly and institutional adoption growing, understanding the factors that could drive ADA’s price becomes crucial for any serious cryptocurrency investor. This comprehensive analysis examines the technical foundations, market trends, and adoption metrics that will shape Cardano’s journey through 2025 and beyond.
The cryptocurrency forecast for Cardano depends on multiple interconnected factors. Market sentiment, technological developments, and broader economic conditions all play significant roles in determining ADA price movements. The Cardano ecosystem has been steadily growing, with increasing numbers of decentralized applications and smart contract deployments creating real utility for the token.
Technical analysis provides valuable insights into potential price movements. When examining historical data and chart patterns, several key levels emerge that could influence future ADA price action. The blockchain technology underlying Cardano continues to mature, with regular updates and improvements enhancing network capabilities.
| Year | Conservative Prediction | Moderate Prediction | Bullish Prediction |
|---|---|---|---|
| 2025 | $0.80 – $1.20 | $1.20 – $1.60 | $1.60 – $2.00 |
| 2026 | $1.00 – $1.50 | $1.50 – $2.20 | $2.20 – $3.00 |
| 2030 | $2.50 – $4.00 | $4.00 – $7.00 | $7.00+ |
Several critical elements will determine whether ADA can achieve its $2 target and beyond. The development of the Cardano ecosystem, regulatory clarity, and market adoption rates all contribute to the overall cryptocurrency forecast. Blockchain technology advancements within the Cardano network, particularly scalability improvements and interoperability features, could significantly impact long-term price potential.
A thorough market analysis reveals how Cardano positions itself against other major blockchain platforms. While Ethereum remains the dominant smart contract platform, Cardano’s research-driven approach and proof-of-stake consensus mechanism offer distinct advantages. The ADA price must be considered within the context of the broader cryptocurrency market, where investor sentiment and macroeconomic factors often drive short-term movements.
The continuous evolution of Cardano’s blockchain technology plays a crucial role in long-term price appreciation. Recent upgrades have enhanced smart contract capabilities, improved transaction speeds, and reduced costs. These technical improvements directly influence the utility and value proposition of ADA, making accurate Cardano price prediction dependent on understanding these fundamental developments.
While the potential for significant returns exists, investors must acknowledge the risks associated with cryptocurrency investments. Market volatility, regulatory uncertainty, and technological challenges could impact the accuracy of any Cardano price prediction. A balanced market analysis should consider both upside potential and downside risks when evaluating ADA as an investment opportunity.
What is the founder’s vision for Cardano?
Cardano was founded by Charles Hoskinson, who previously co-founded Ethereum. His vision focuses on creating a more secure and sustainable blockchain platform through peer-reviewed research and evidence-based development.
How does Cardano’s technology differ from competitors?
Cardano utilizes a unique proof-of-stake consensus mechanism called Ouroboros, which was developed through academic research and formal verification methods. This approach aims to provide greater security and energy efficiency compared to proof-of-work systems.
Which companies are building on Cardano?
Several notable projects and companies are developing on Cardano, including EMURGO, one of the founding entities of the Cardano protocol, and various decentralized finance and NFT platforms that leverage Cardano’s blockchain technology.
What role does the Cardano Foundation play?
The Cardano Foundation oversees protocol development and ecosystem growth, working to drive adoption and form partnerships across various industries while ensuring the platform’s long-term sustainability.
The journey to $2 for ADA represents a significant milestone that reflects both technological achievement and market acceptance. While short-term volatility may present challenges, the fundamental strengths of Cardano’s blockchain technology and growing ecosystem provide a solid foundation for long-term growth. Investors should maintain realistic expectations while recognizing the transformative potential of well-researched blockchain platforms in the evolving digital economy.
To learn more about the latest cryptocurrency markets trends, explore our article on key developments shaping Cardano institutional adoption and market liquidity.
This post Cardano Price Prediction 2025-2030: Will ADA Achieve the $2 Breakthrough? first appeared on BitcoinWorld.
Ripple (XRP) edges lower, trading above $2.25 at the time of writing on Friday. The token’s short-term outlook reflects a sticky risk-off sentiment in the broader cryptocurrency market.
VeChain (VET) is trading at $0.0156 at the time of writing on Friday amid high volatility across the cryptocurrency market. Risk-off sentiment has pushed investors to the sidelines over the last few weeks, citing macroeconomic uncertainty and a lack of strong price catalysts.

Bitcoin (BTC) is trading above $97,000 at the time of writing on Friday amid a sticky bearish wave in the broader cryptocurrency market. Both institutional and retail demand remain muted, making it difficult for BTC to sustain recovery.

Solana price prediction remains in the spotlight as SOL moves back toward the key $145–$150 support zone. The token weakened on Thursday as momentum cooled across the crypto market. Traders are watching to see whether this support can hold or whether a deeper slide may unfold.
The decline adds pressure at a critical moment. Analysts say the recent pattern of lower highs, light volume, and fading bounce strength shows lack of buyer conviction. This makes the $150 zone more important than ever.
Solana is trading just above the $145–$150 demand region, an area that has produced multiple rebounds over recent months. But this time, the structure looks weaker. Candles show compression. Volume is thinning. The reaction strength is soft. These factors suggest buyer fatigue rather than accumulation.
Market analysts earlier mapped out $118–$125 as the next valid support range if the current level breaks down. The wide gap between both zones highlights the rising downside risk. Beneath current prices, the volume profile is thin, meaning any breakdown could accelerate quickly.
On higher timeframes, some traders also pointed to a developing head-and-shoulders formation. The neckline sits around $120–$125. While patterns like these often produce false signals in crypto, they still serve as caution indicators. They help explain why sellers continue defending lower highs and why upside attempts have stalled below $170.
The $170–$177 resistance band remains the key line for a confirmed trend reversal. Analysts expect any relief bounce toward $162–$168 to be limited unless SOL reclaims $177 with clean volume. The Elliott Wave structure also reflects overlapping lower waves, signaling no established reversal yet.
Another bearish factor is the loss of a major multi-month trendline. Since breaking this structure, Solana’s upside attempts have been shallow. Fibonacci projections now outline awareness levels at $125, $81, and even $40–$50 under extreme conditions. These are not predictions but scenario-based markers to show how wide the downside can stretch in a weakening market.

Despite short-term technical weakness, institutional demand remains firm. Solana-focused ETFs such as BSOL and GSOL continue receiving net inflows, showing long-term appetite is stable. Historically, consistent ETF inflows help strengthen macro recovery phases.
Even so, near-term movement is still directed by technical factors. The divergence between ETF demand and actual price action reflects this. Until Solana breaks back above the $170–$177 resistance, bullish sentiment cannot take control. For now, traders remain cautious and focused on structural confirmation.
In conclusion, Solana price prediction depends heavily on the $145–$150 support level. A strong defense could set the stage for recovery, while a breakdown may trigger a deeper extension toward $125 or lower. Traders await clearer structure before trusting any bullish momentum.
The $145–$150 range is the critical support area. A break below it could expose $118–$125.
A clear reclaim of $170–$177 with strong volume is needed for a confirmed trend reversal.
No. It only confirms if Solana breaks below the $120–$125 neckline.
Yes. Persistent BSOL and GSOL inflows support long-term sentiment even when short-term charts weaken.
It depends on buyers defending $145–$150. A bounce may follow, but confirmation comes only above $177.
This article is for informational and educational purposes only. It is not financial advice, investment advice, trading advice, or any form of recommendation. Cryptocurrency markets are highly volatile and carry significant risk. Always conduct your own research and consult a licensed financial professional before making investment decisions. The author and publisher are not responsible for any financial losses.
Reuters. (2025). Crypto markets soften as traders monitor support zones. Published Nov. 12, 2025.
Associated Press. (2025). Digital asset volatility continues amid shifting market sentiment. Published Nov. 10, 2025.
CNN Business. (2025). Crypto technical trends show mixed signals for major tokens. Published Nov. 11, 2025.
iNews covers the latest and most impactful stories across
entertainment,
business,
sports,
politics, and
technology,
from AI breakthroughs to major global developments. Stay updated with the trends shaping our world. For news tips, editorial feedback, or professional inquiries, please email us at
[email protected].
Get the latest news first by following us on
Google News,
Twitter,
Facebook,
Telegram
, and subscribe to our
YouTube channel.
The market keeps setting new local lows, according to CoinMarkertCap.
The rate of Binance Coin (BNB) has dropped by 4.83% over the last 24 hours.
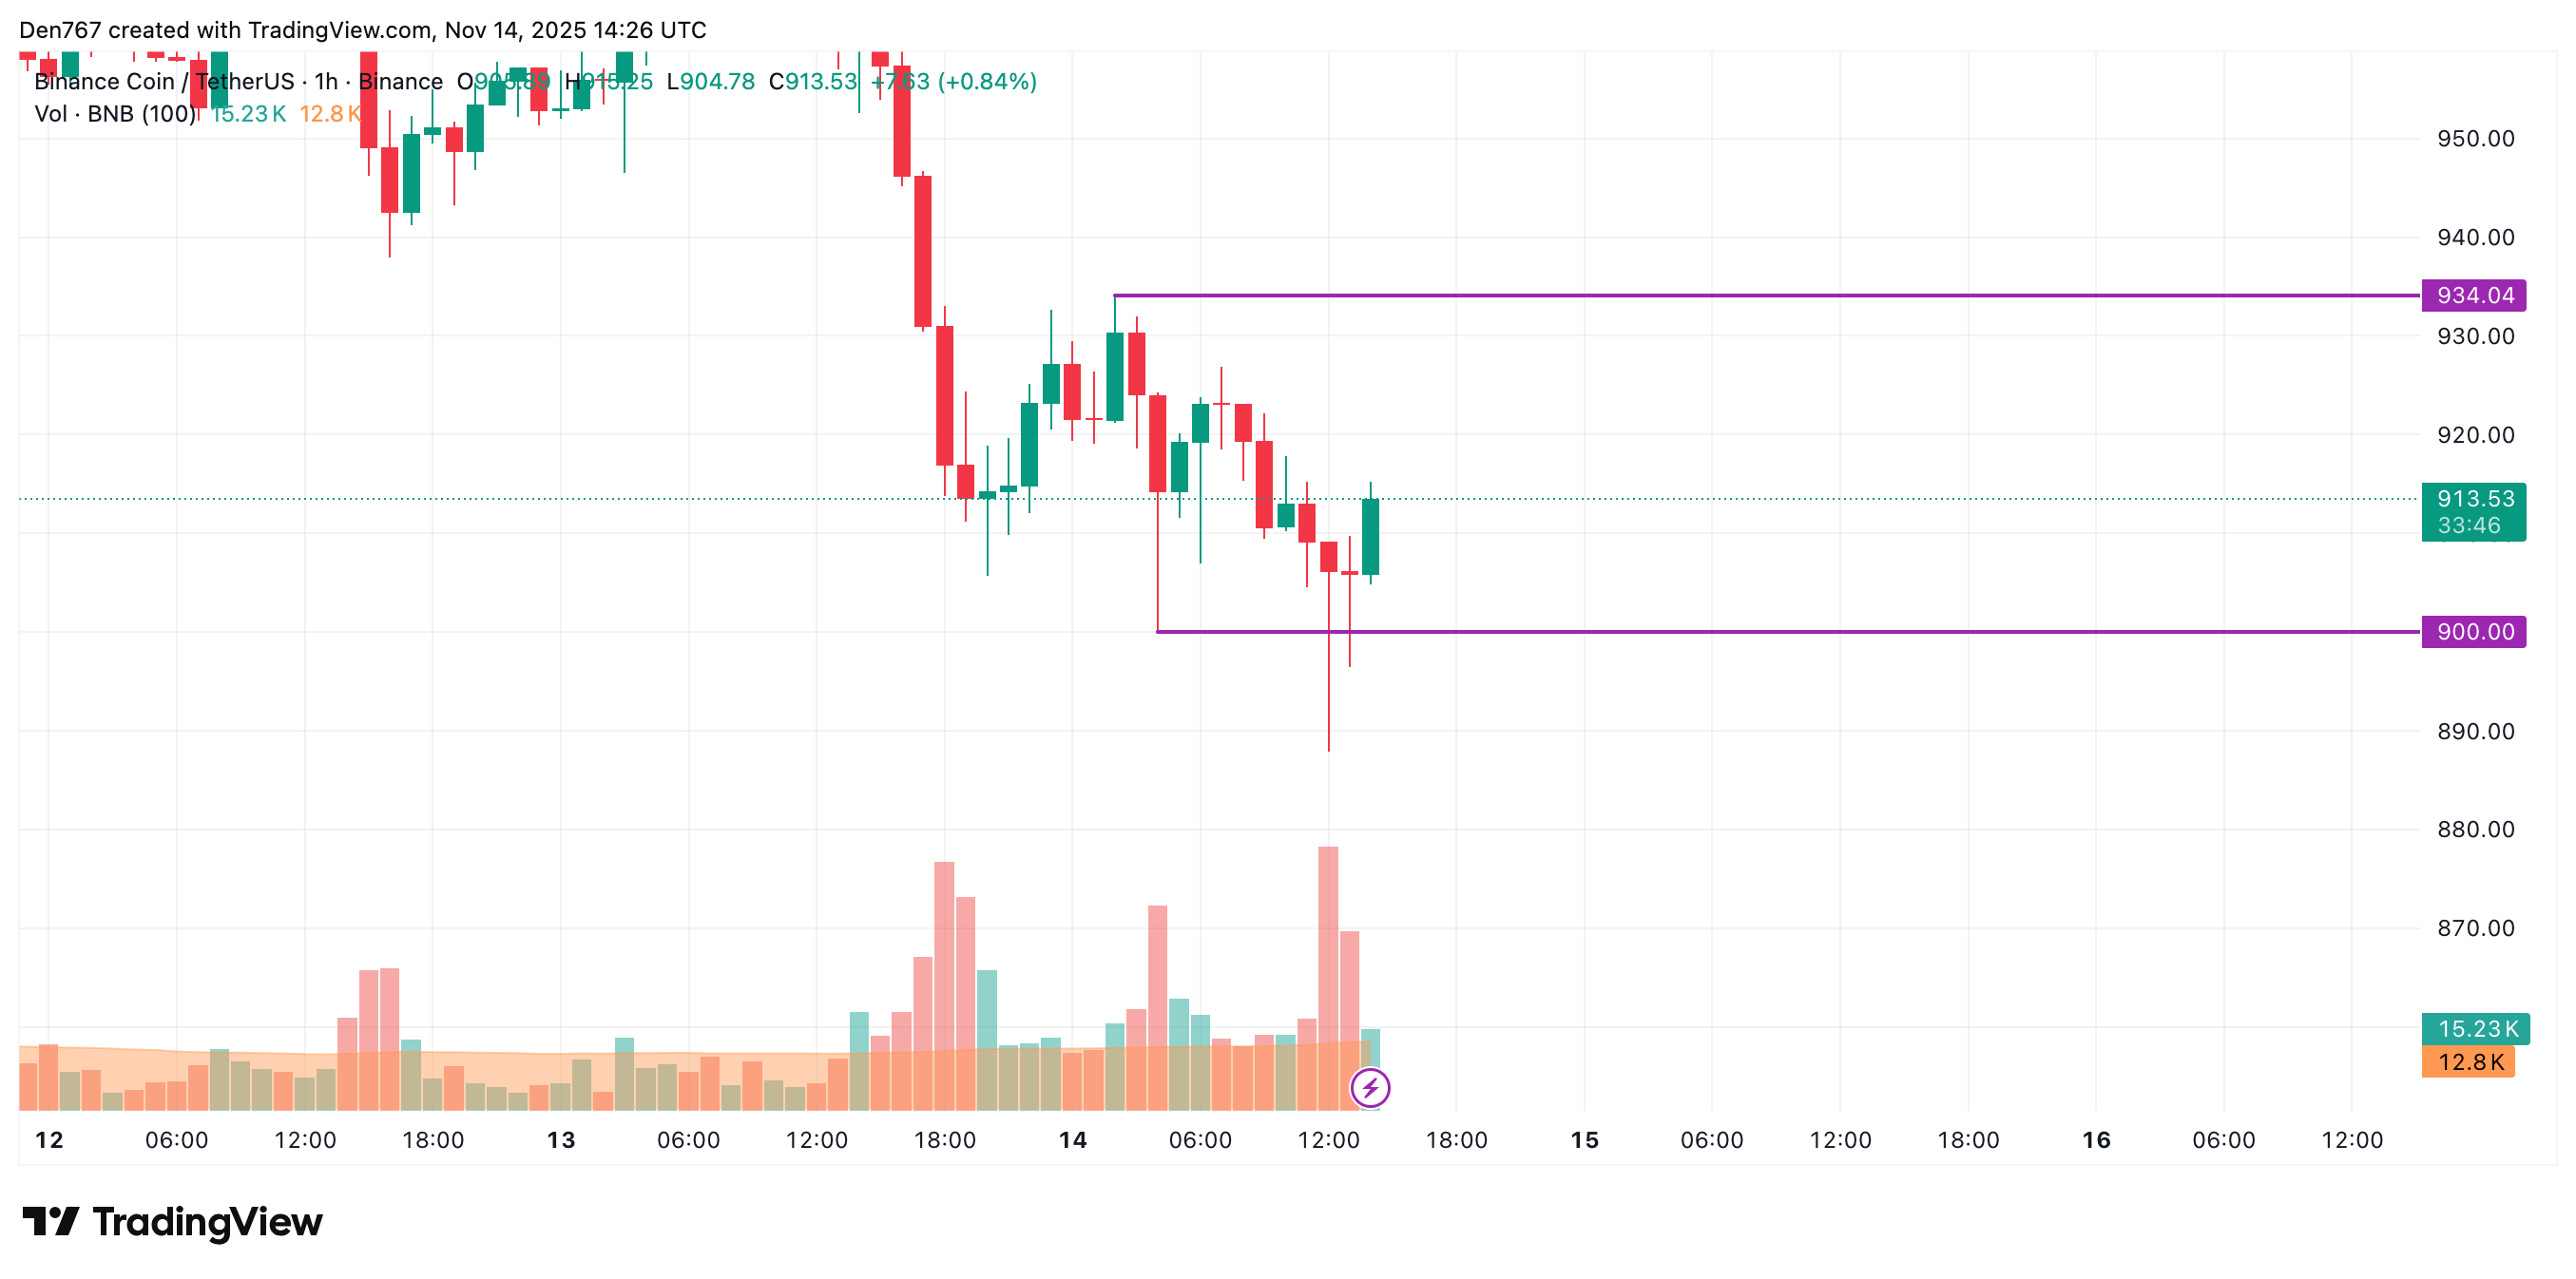
On the hourly chart, the price of BNB has made a false breakout of the local support of $900. However, one should focus on the daily bar’s closure in terms of that mark. If it happens far from that, traders may expect a bounce off to the resistance.
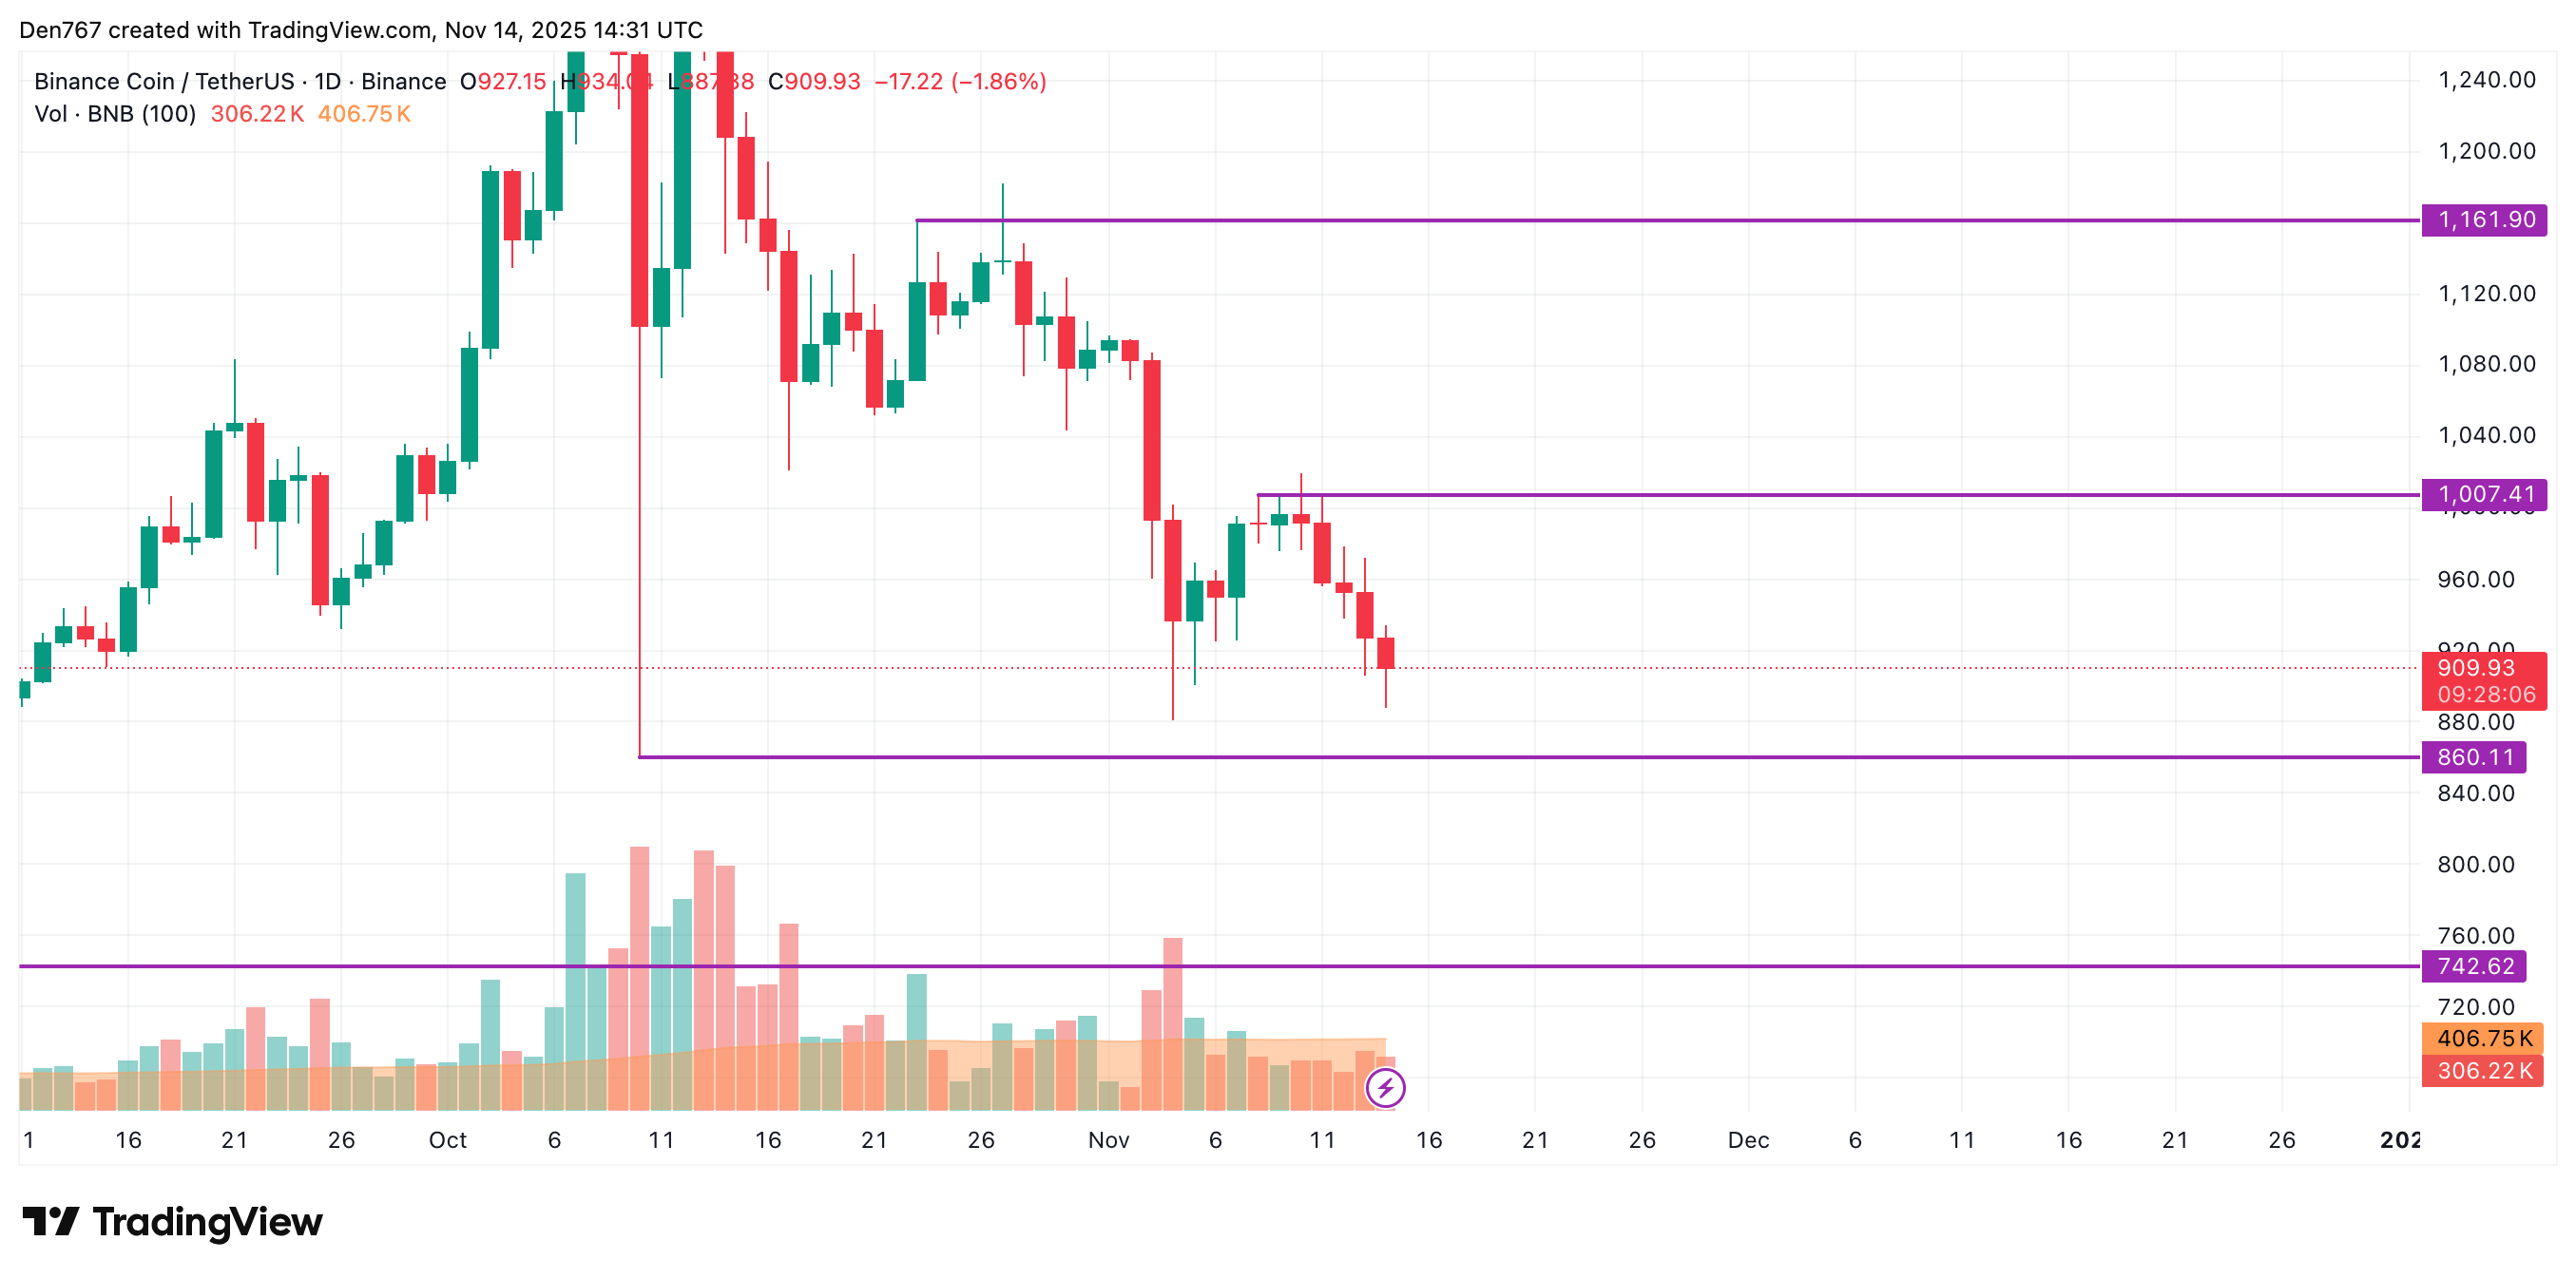
On the longer time frame, there are no reversal signals yet. The rate of the native exchange coin keeps going down after a false breakout of the $1,007 resistance.
You Might Also Like
However, if the daily candle closes far from its low, there is a chance to see local growth to the $950 range.
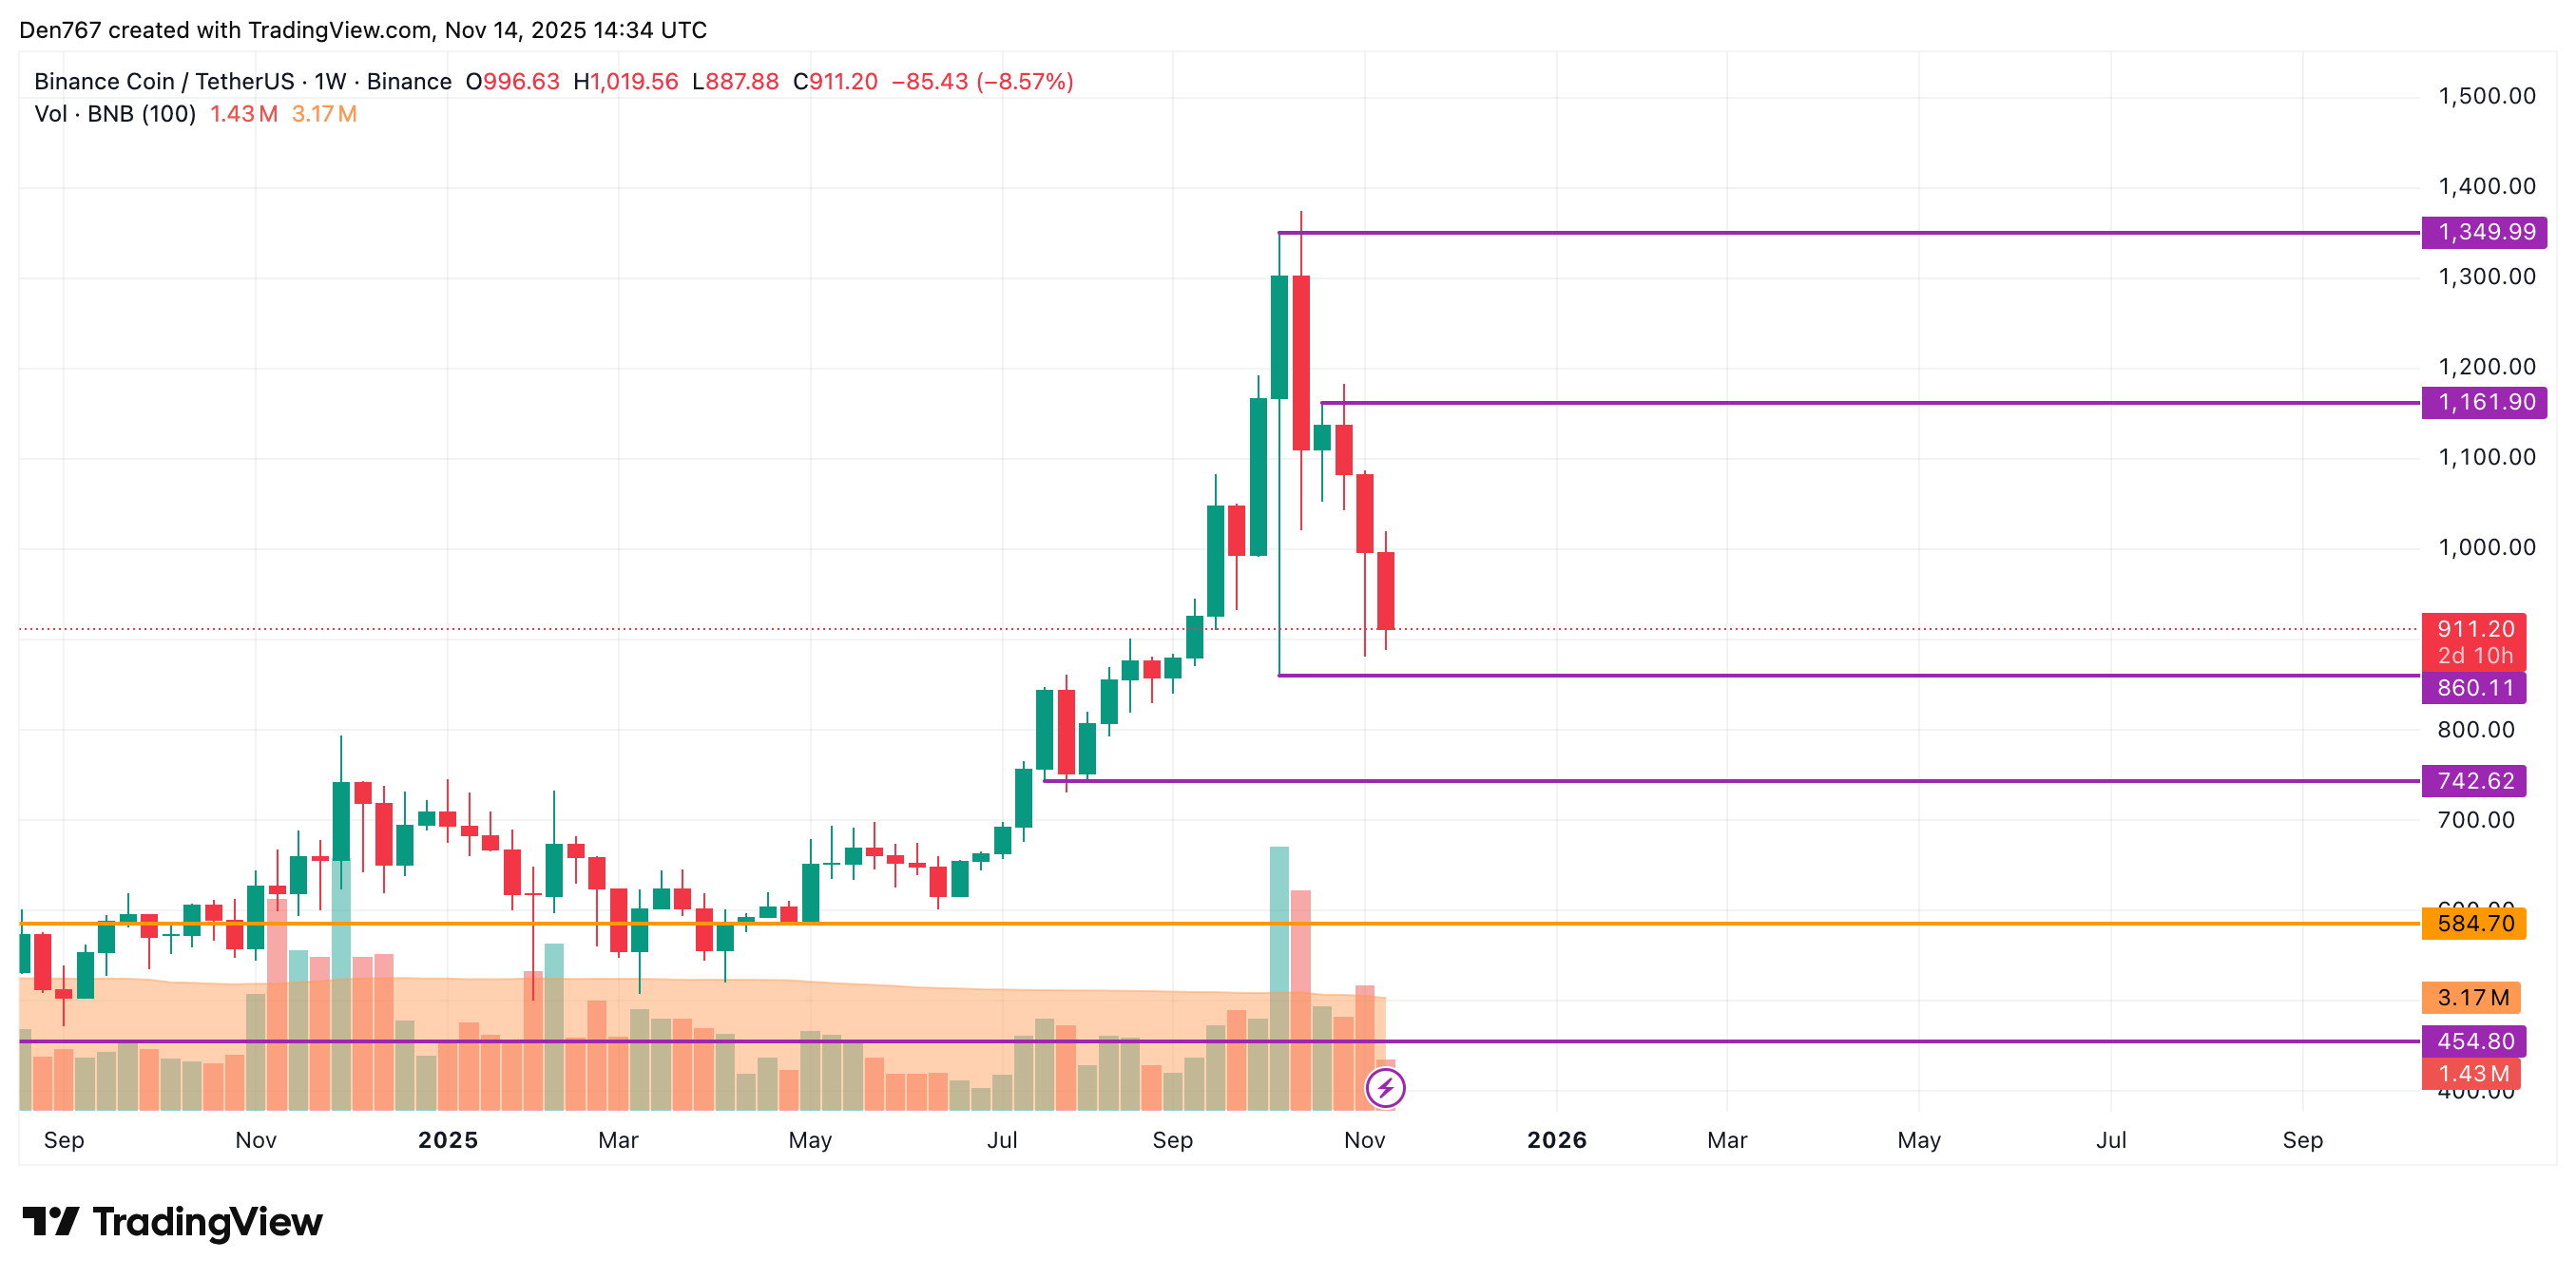
From the midterm point of view, the situation is similar. One should pay attention to the closest level of $860. If the bar closes below it, the decline is likely to continue to the $750-$800 range.
BNB is trading at $915.65 at press time.
Many investors initially blamed fewer expected Federal Reserve rate cuts for the pullback. But analysts at Citigroup say the real reason may lie elsewhere, and despite the recent slump, they remain optimistic about Bitcoin’s long-term path, as per The Motley Fool report.
According to Citi strategists led by Dirk Willer, the recent decline appears linked to falling liquidity in the US financial system rather than interest rate expectations, as per the report.
ALSO READ: Global debt hits insane $338 trillion — the biggest bubble in human history?
The bank highlights two key factors: bank reserves held at the Federal Reserve and the US Treasury’s General Account (TGA), which acts as the government’s main checking account, as per The Motley Fool report. The TGA and bank reserves generally move in opposite directions, and as the TGA swelled this year, bank reserves dropped, as per the report.
Willer explained that Bitcoin is especially sensitive to liquidity changes, saying, “Traditionally, falling reserves have also impacted equities negatively, but this did not happen prior to this week. But it is plausible that bitcoin is a more sensitive instrument for pure liquidity, especially with equities caught up in the fundamentally driven AI narrative,” as quoted by The Motley Fool.ALSO READ: Synopsys layoffs: Silicon Valley chip-design giant to sack 2,800 jobs as turbulence spreads
The Federal Reserve’s ongoing quantitative tightening has also pulled money out of the financial system, as per the report. Bank reserves have declined notably since 2022, and Bitcoin’s price has shown a clear correlation with that drop, according to The Motley Fool.
There are indications that liquidity pressures may start to ease.
The Federal Reserve has signaled it will stop tapering its balance sheet in December, suggesting bank reserves are nearing what it considers “ample” levels, reported The Motley Fool.
After the debt ceiling was raised earlier in 2025, the TGA was temporarily drained but has since been replenished, reaching more than $940 billion as of November 5, and Citi views this level as sufficient, as per the report.
With these shifts, Citi expects liquidity to stabilize and potentially improve, as Willer said, “This would suggest that liquidity conditions should improve going forward, which should support bitcoin, and could also get the NDX (Nasdaq 100) Santa rally back on track,” as quoted by The Motley Fool.
Despite the recent downturn, Citi remains bullish. In October, the bank issued a 12-month price target of $181,000 for Bitcoin, driven by its rising status as a store of value and the ongoing “digital gold” narrative, as per the report.
Why is the Bitcoin price falling today?
Citi analysts say the drop is mainly due to falling liquidity in the US financial system.
What is Bitcoin’s price prediction according to Citi?
Citi expects Bitcoin to recover and potentially reach $181,000 in the next year.
Jessie A Ellis
Nov 14, 2025 07:33
MATIC price prediction shows potential 53% rally to $0.58 if resistance breaks, with December 2025 targets ranging $0.45-$0.58 based on technical analysis.
Polygon (MATIC) finds itself at a critical juncture as it trades at $0.38, testing the pivotal $0.58 resistance level that could determine its trajectory through the end of 2025. With mixed signals from technical indicators and divergent analyst forecasts, our MATIC price prediction examines the key scenarios ahead for this layer-2 scaling solution.
• MATIC short-term target (1 week): $0.35-$0.42 range (-7.9% to +10.5%)
• Polygon medium-term forecast (1 month): $0.35-$0.45 range with breakout potential to $0.58
• Key level to break for bullish continuation: $0.58 resistance
• Critical support if bearish: $0.35, then $0.33
The analyst community shows notable divergence in their Polygon forecast outlook. Blockchain.News presents the most optimistic MATIC price prediction, targeting $0.45-$0.58 by December 2025 – representing a potential 18% to 53% upside from current levels. This bullish scenario hinges on MATIC successfully breaking the critical $0.58 resistance that has capped recent rallies.
Contrasting this optimism, CoinCodex delivers a bearish short-term outlook with their MATIC price target of $0.133 by November 17, 2025 – a concerning 65% decline. This prediction stems from the Fear & Greed Index sitting at 26 (Fear territory) and prevailing bearish market sentiment.
Coinbase takes a conservative long-term approach, projecting MATIC to reach $0.22 by 2030 based on a modest 5% annual growth rate. While this represents a 27.6% increase over five years, it suggests limited explosive growth potential.
The current Polygon technical analysis reveals a cryptocurrency in transition. MATIC trades at $0.38, positioned between its immediate support at $0.35 and the crucial $0.58 resistance level. The RSI reading of 38.00 sits in neutral territory, neither oversold nor overbought, providing room for movement in either direction.
The MACD histogram shows bearish momentum at -0.0045, while the MACD line trades below its signal line, confirming short-term bearish pressure. However, the Stochastic oscillator readings (%K: 25.19, %D: 19.74) suggest MATIC may be approaching oversold conditions, potentially setting up for a bounce.
Within the Bollinger Bands framework, MATIC trades in the lower portion with a %B position of 0.29, indicating the price is closer to the lower band ($0.31) than the upper band ($0.56). This positioning often precedes either a significant bounce or a breakdown below support.
The moving average structure tells a concerning story for medium-term bulls. MATIC trades below all major moving averages: SMA 20 ($0.43), SMA 50 ($0.45), and significantly below the SMA 200 ($0.69). This configuration typically indicates a bearish trend, though the proximity to shorter-term averages suggests potential for quick reversals.
The primary bullish MATIC price prediction centers on a successful break above $0.58 resistance. If achieved, this could trigger the 53% rally scenario targeting $0.58 initially, with extensions possible to $0.80. For this scenario to unfold, MATIC needs to reclaim the SMA 20 at $0.43 first, followed by sustained volume above the daily average of $1.07 million.
The bullish case gains credibility if Bitcoin and broader crypto markets stabilize, as MATIC often follows major cryptocurrency trends. Additionally, any positive developments in Polygon’s ecosystem adoption or layer-2 scaling announcements could provide fundamental support for higher prices.
Key bullish MATIC price targets:
– First target: $0.45 (SMA 50 level)
– Second target: $0.58 (critical resistance)
– Extension target: $0.80 (psychological resistance)
The bearish scenario for our Polygon forecast involves a failure to hold current support levels. If MATIC breaks below $0.35, the next logical target sits at $0.33 (strong support), with a more severe decline potentially reaching $0.31 (Bollinger Band lower boundary).
The bearish case strengthens if the Fear & Greed Index remains in fear territory and broader market conditions deteriorate. The distance from the 52-week high of 70.14% already reflects significant bearish sentiment that could extend further.
Critical bearish MATIC price levels:
– First support break: $0.35 (-7.9%)
– Major support: $0.33 (-13.2%)
– Extreme bearish target: $0.31 (-18.4%)
Based on current technical conditions, a staged entry approach appears most prudent for MATIC. The current price of $0.38 offers a reasonable entry for those bullish on the $0.58 breakout scenario, but risk management remains crucial.
Conservative Entry Strategy:
– Initial position: 25% allocation at current levels ($0.38)
– Add on dip: 25% more if MATIC touches $0.35 support
– Stop-loss: $0.325 (below strong support)
– Take-profit targets: $0.45 (partial), $0.58 (main target)
Aggressive Entry Strategy:
– Wait for breakout: Enter above $0.59 with confirmation
– Position size: Full allocation on breakout
– Stop-loss: $0.52 (back below resistance)
– Target: $0.80 extension level
The buy or sell MATIC decision ultimately depends on risk tolerance and market outlook. Conservative investors might prefer waiting for clearer directional signals, while aggressive traders could capitalize on the current consolidation.
Our comprehensive MATIC price prediction suggests a pivotal moment for Polygon. The medium-term outlook favors the $0.45-$0.58 range by December 2025, aligning with the more optimistic analyst forecasts. However, failure to hold $0.35 support could trigger a deeper correction toward $0.31.
Confidence Level: Medium (65%)
The key indicators to monitor for prediction validation include RSI movement above 45, MACD histogram turning positive, and most critically, volume expansion on any move above $0.43. Invalidation signals include a break below $0.35 with volume or RSI falling below 30.
Timeline: The next 2-4 weeks will likely determine MATIC’s direction through year-end, with the $0.58 resistance test expected within this timeframe. This Polygon forecast carries medium confidence given the mixed technical signals and uncertain broader market conditions affecting all cryptocurrencies.
Image source: Shutterstock
Jakarta, Pintu News – According to the latest analysis from Crypto Patel, Dogecoin has the potential to achieve a significant price increase. Utilizing historical chart patterns and current market dynamics, Patel predicts that Dogecoin could reach $2 to $5 within this cycle. This prediction is based on in-depth technical analysis and comparison with previous price rises.
Crypto Patel points out that Dogecoin has formed a descending triangle pattern since peaking at $0.75 in 2021. This pattern is often followed by a breakout and retest, which can be an early indicator of a significant price increase. In his analysis, Patel compares the current situation to Dogecoin’s price spikes in 2017 and 2021, where the coin experienced extremely high price increases.
The same pattern that has driven the Dogecoin price up in the past now appears to be repeating itself. With the market structure already ‘locked and loaded’, many analysts believe that Dogecoin is poised for a parabolic surge. This suggests that history may be repeating itself, providing an opportunity for investors to capitalize on the potential for dramatic price increases.
Also Read: Shocking Prediction from Donald Trump’s Son: Bitcoin Will Break $1 Million!
In December 2024, Dogecoin managed to break the upper boundary of a long-established triangle pattern. This happened during the crypto market surge led by US President Donald Trump. After the breakout, Dogecoin retested the previous trendline, which is a normal step in breakout confirmation.
The similarity between the current price action and the token’s initial price increase adds to some analysts’ belief in further upside potential. This signals that Dogecoin may have started its next bullish phase, which could take the price to levels never reached before.

Technical indicators suggest that Dogecoin may see a 13.51% increase to $0.2002 by December 12, 2025. Although the current market sentiment is still bearish with the Fear & Greed Index showing 20 (Fear), the long-term indicators remain bullish.
In addition, Bitwise has proposed a Dogecoin ETF, which if approved, could increase Dogecoin’s accessibility for institutions. This would ease fund inflows and outflows and increase the depth of the order book. This move could also explain Dogecoin’s recent price movements and provide further impetus to the price rise.
With all indicators and analysis pointing to potential upside, Dogecoin seems to be on the verge of a significant price jump. Although the market is currently still in limbo, historical patterns and recent market dynamics suggest that Dogecoin may be about to experience one of its biggest rises in history.
Also Read: Bitcoin Poised to Surge After US Government Shutdown Deal: History Repeats?
Follow us on Google News to get the latest information about crypto and blockchain technology. Check Bitcoin price today, Solana price today, Pepe coin and other crypto asset prices through Pintu Market.
Enjoy an easy and secure crypto trading experience by downloading Pintu crypto app via Google Play Store or App Store now. Also, get a web trading experience with various advanced trading tools such as pro charting, various types of order types, and portfolio tracker only at Pintu Pro.
*Disclaimer
This content aims to enrich readers’ information. Pintu collects this information from various relevant sources and is not influenced by outside parties. Note that an asset’s past performance does not determine its projected future performance. Crypto trading activities are subject to high risk and volatility, always do your own research and use cold hard cash before investing. All activities of buying andselling Bitcoin and other crypto asset investments are the responsibility of the reader.


