The main tag of Cryptocurrency price Articles.
You can use the search box below to find what you need.
[wd_asp id=1]
The main tag of Cryptocurrency price Articles.
You can use the search box below to find what you need.
[wd_asp id=1]
Story Highlights
Binance Coin, after facing the brunt of the crypto market downturn, has made fresh highs to mark a new all-time high at $1370.55. Successively, at the time of press, BNB coin is being sold across exchanges for $1290.62.
Amid the changing landscape, the Binance Coin fundamentals remain solid. However, the underlying uncertainties amid the global tensions raise questions like, “Is Binance safe or not?” or “Will Binance go higher in 2025?”
To answer these questions and provide a clear view of the BNB price action, we present our latest Binance Coin ![]() BNBUSDT Price Prediction 2025, 2026 – 2030.
BNBUSDT Price Prediction 2025, 2026 – 2030.
Table of Contents
BNB Price Today
| Cryptocurrency | BNB |
| Token | BNB |
| Price | $1,279.8251 -2.62% |
| Market Cap | $ 178,128,233,815.40 |
| 24h Volume | $ 11,479,370,819.4475 |
| Circulating Supply | 139,181,701.27 |
| Total Supply | 139,181,701.27 |
| All-Time High | $ 1,370.5460 on 13 October 2025 |
| All-Time Low | $ 0.0961 on 01 August 2017 |
*The statistics are from press time.
Binance Coin Price Chart
Technical Analysis
Binance Coin Short-Term Price Prediction
BNB Coin Price Prediction for October 2025
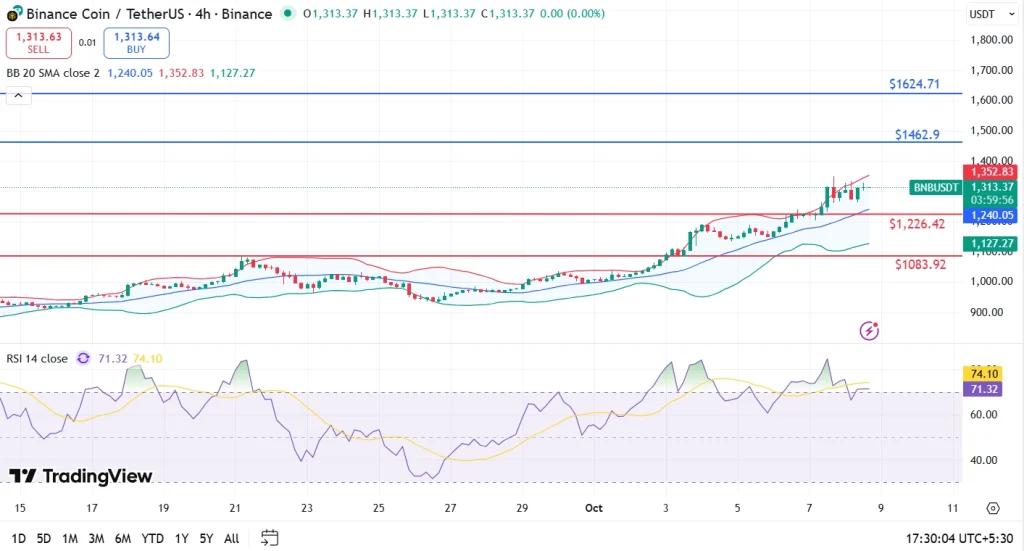
BNB is showing strong bullish momentum, if buyers sustain above $1,300, the next upside targets are $1,462 and $1,624. However, rejection from the current trend channel could trigger a short-term pullback toward $1,226 or even $1,083. Overall, the October 2025 outlook stays bullish as long as BNB holds above $1,200, with a potential low at $1,180, an average near $1,350, and a high around $1,620.
| Month | October |
| Potential Low | $1180 |
| Potential Average | $1350 |
| Potential High | $1620 |
Binance Coin Price Prediction 2025
Now, attention has shifted to VanEck’s proposed BNB ETF in the U.S. If approved by late 2025 or early 2026, it could attract both institutional and retail investors, fueling more demand. With over 5,000 dApps and $8.1 billion in total value locked, the chain continues to grow.
That being said, the investors can anticipate the BNB coin price reaching a new All-Time High of $2,292. On the flip side, the Binance crypto may experience a low of $761 during that year. Considering the buying and selling pressure, the 3rd largest cryptocurrency could conclude the year 2025 with an average price of $926.
| Year | 2025 |
| Potential Low | $761 |
| Potential Average | $926 |
| Potential High | $2,292 |
Curious if Bitcoin will hit $100K as the crypto bull run begins? Find out more about Coinpedia’s Bitcoin price prediction.
BNB Crypto Medium-Term Price Prediction
| Year | Potential Low ($) | Potential Average ($) | Potential High ($) |
| 2026 | 1,125 | 2,250 | 3,375 |
| 2027 | 1,687.50 | 3,375 | 5,062.50 |
Binance Coin Price Forecast 2026
By late 2026, BNB’s price could climb to a high of $3,375. However, the price might dip to $1,125, with an average value of $2,250 throughout the year.
BNB Coin Price Prediction 2027
In 2027, BNB’s price is anticipated to hit a peak of $5,062.50. On the downside, the price could fall to $1,687.50, with an average of $3,375.
Binance Coin Long-Term Price Prediction
| Year | Potential Low ($) | Potential Average ($) | Potential High ($) |
| 2028 | 2,531.25 | 5,062.50 | 7,593.75 |
| 2029 | 3,796.88 | 7,593.75 | 11,390.63 |
| 2030 | 5,695.31 | 11,390.63 | 17,085.94 |
Binance Crypto Price Projection 2028
By the close of 2028, BNB’s price may reach a high of $7,593.75. If market conditions worsen, it could drop to $2,531.25, with an average price of $5,062.50.
BNB Crypto Price Prediction 2029
In 2029, BNB could continue its upward momentum, potentially reaching $11,390.63. However, it may see a low of $3,796.88, with an average price of $7,593.75.
Binance Coin Price Prediction 2030
As 2030 begins, BNB crypto could hit a new high of $17,085.94. Conversely, it may bottom out at $5,695.31, with an average price of $11,390.63.
Binance Price Projection 2031, 2032, 2033, 2040, 2050
Based on the historic market sentiments and trend analysis of the altcoin, here are the possible BNB coin price targets for the longer time frames.BINANCE:BNBUSDT Price Prediction”data-xaxis=”Year”data-yaxis=”Average Price ($)”>
| Year | Potential Low ($) | Potential Average ($) | Potential High ($) |
| 2031 | 8,542.97 | 17,085.94 | 25,628.91 |
| 2032 | 12,814.45 | 25,628.91 | 38,443.36 |
| 2033 | 19,221.68 | 38,443.36 | 57,665.04 |
| 2040 | 145,519.24 | 291,038.49 | 436,557.73 |
| 2050 | 1,131,478.37 | 2,262,956.73 | 3,394,435.10 |
What Does The Market Say?
| Firm Name | 2025 | 2026 | 2030 |
| Changelly | $608.66 | $1,219 | $6,344 |
| Coincodex | $1,119.10 | $592.92 | $1,305.46 |
| Binance | $608.63 | $639.06 | $776.79 |
CoinPedia’s Binance ![]()
![]() BNBUSDT Coin Price Prediction
BNBUSDT Coin Price Prediction
Despite the growing troubles of workforce reduction, regulatory scrutiny, and frequent executive departures, the Binance ecosystem is expanding. With its research in product innovations and new token listings, Binance Exchange has the highest trading volume.
As per CoinPedia’s Binance ![]()
![]() BNBUSDT coin price prediction, the price of
BNBUSDT coin price prediction, the price of ![]()
![]() BNBUSDT crypto will increase to $2,292 in 2025.
BNBUSDT crypto will increase to $2,292 in 2025.
| Year | 2025 |
| Potential Low | $761 |
| Potential Average | $926 |
| Potential High | $2,292 |
Is BNB a Profitable Investment?
Yes, BNB crypto is a profitable investment for the long term. Several initiatives, such as the auto-burn mechanism, contribute to reducing its supply and potentially increasing its value over time.
CoinPedia has dedicated a team of expert analysts to cover the possible crypto price prediction and sum it all up in one place, just for you!
Key Factors & Risks
FAQs
What was the initial price of Binance Coin ![]()
![]() BNBUSDT?
BNBUSDT?
The initial price of Binance Coin ![]()
![]() BNBUSDT at the time of the ICO was $0.15.
BNBUSDT at the time of the ICO was $0.15.
What is the all-time low (ATL) price of Binance Coin ![]()
![]() BNBUSDT?
BNBUSDT?
The all-time low price of Binance Coin was $0.09611 on August 01, 2017.
What could be the maximum trading price of Binance Coin by the end of 2025?
As per our BNB price prediction 2025, the maximum trading price of ![]()
![]() BNBUSDT could potentially reach $2,292 in 2025.
BNBUSDT could potentially reach $2,292 in 2025.
How high could the BNB price reach by the end of 2030?
The price of the digital asset could reach a potential high of $17,085.94 by 2030.
What is the all-time high (ATH) price of Binance Coin ![]()
![]() BNBUSDT?
BNBUSDT?
The all-time high price of Binance Coin was $793.35 on December 04, 2024.
Is BNB a good investment?
Yes, BNB is a profitable investment for the long term. With initiatives such as auto-burn, numerous projects, and growing prominence, we could find it bearing fruit.
How much would the price of Binance be in 2040?
As per our latest BNB price analysis, Binance could reach a maximum price of $436,557.73.
How much will the BNB price be in 2050?
By 2050, a single Binance price could go as high as $3,394,435.10.
Prominent research analyst Ash Crypto predicted at the beginning of the month that Bitcoin would drop closer to the $106,000 level in October, while Ethereum would drop near $3,800 or lower. His predictions proved to be correct.
However, Ash Crypto also predicted that the last quarter of the year would be Bitcoin’s most successful quarter. He said the asset’s price would soar to $150,000 and spark an altcoin season.
On October 1, crypto researcher Ash Crypto posted a bold prediction on his Twitter account about the crypto market’s movement for the remainder of the month and through the end of the year.
“I think we are seeing a pump to make everyone believe PUMPtober is real and soon we can get a nasty drop where Bitcoin dumps closer to the $106k level and ETH dumps near $3800 or lower, and everyone will think Uptober is canceled,” his tweet read.
The market crash last weekend proved him right.
The catalyst was President Trump’s aggressive announcement of a 100% tariff on Chinese products, which plunged the global crypto market. Bitcoin dropped to a low of $105,000, and Ethereum briefly sank as low as $3,500. The sell-off was even more severe for most other altcoins.
If this week’s events confirmed the first half of his prediction, then the second half offers hope to a market still reeling from a moment of sudden ruin.
Although Ash Crypto’s prediction for the rest of October paints a bleak picture, his forecast for the remainder of the year offers a welcome refuge for investors.
According to him, the crypto market will enter an unprecedented bull phase during the last quarter of 2025. This latest bear phase would send investors a message that the recent upward trend in crypto is finished, causing them to short en masse.
When pessimism is at its maximum, the market will reverse, producing massive percentage gains, likely starting in the last 10 days of October.
“Then October monthly will close with a massive % gain, and the Q4 parabolic pump will start, which will send BTC to $150k-$180k, ETH to $8k-$12k, and the TRUE alt season will finally begin, sending alts 10x-50x in just 3-4 months,” Ash Crypto predicted.
The leading meme coin plunged from $0.25 to below $0.10 on several exchanges during the panic-driven selloff before quickly rebounding to around $0.19.
At the time of writing, DOGE trades at $0.2126, marking a 12.12% daily recovery, with trading volume surging nearly 30%. Despite the volatility, analysts believe this correction mirrors the same type of price behavior that historically precedes explosive rallies.
According to market analysts such as Daan Crypto Trades, the recent DOGE movement aligns closely with patterns observed before major bullish reversals.
Most charts look the same. Took $DOGE here as an example.
1. Sharp sell off Friday evening into the giant wicks.
2. Initial bounce usually topping about halfway through the entire move (which often went -70% or more).
3. Sideways chop
4. Another -10% to -20% sell off on most… pic.twitter.com/2tcpEGvYny— Daan Crypto Trades (@DaanCrypto) October 12, 2025
The asset’s sharp 70% plunge from peak to trough, followed by a swift 50% recovery, is similar to structures seen in previous breakout phases. Analysts expect a period of sideways trading and potential minor corrections before another upward push.
Ali Martinez, another prominent crypto analyst, identified the $0.19-$0.21 range as a critical support area that could serve as a “buy-the-dip” zone.
Martinez shared a chart, indicating inefficiencies and gaps between the bounce levels and pre-crash highs, which often act as magnet zones for future price recovery.
DOGE remains within a long-term ascending channel, suggesting that its broader uptrend is still intact. If the current recovery holds above $0.20 and gains momentum toward $0.30, analysts say history could be setting up for another explosive Dogecoin breakout, targeting $0.48.
The optimistic target on many technical charts still hovers around the symbolic $1 mark, a move that would represent a more than 370% rally from current prices.
Source: TradingView
Meanwhile, the RSI levels have stabilized near 42, indicating that the asset is out of the oversold zone, while the MACD shows early signs of a bullish crossover.
These indicators collectively hint at a potential reversal forming beneath the surface.
Dogecoin has bounced back from a brutal market crash, with analysts pointing out that its recent price structure closely resembles those seen before major rallies.
With key support holding near $0.20, traders are eyeing bullish targets ranging from $0.48 to $1 if the recovery continues, based on historical chart patterns.
While Dogecoin is eyeing a monster rally, Maxi Doge ($MAXI) is attracting attention while blending the high-energy world of gym culture with the excitement of bullish crypto trading.
The project’s mascot, a muscular, caffeine-fueled Doge, captures the essence of its slogan: “never skip leg day, never skip a pump”.
For its holders, owning $MAXI is not merely an investment, but an entry into a lifestyle community that values both physical and financial growth.
The project’s ecosystem revolves around collective engagement, where holders share high-leverage trading strategies, compete on weekly leaderboards, and take part in themed challenges such as “Max Ripped, Max Gains”.

The presale has already raked in $3.5 million while currently, each $MAXI is priced $0.0002625.
To buy $MAXI, visit the official Maxi Doge website and connect a supported wallet, like Best Wallet.
You can swap existing crypto or use a debit/credit card to complete your $MAXI purchase.
Disclaimer: Coinspeaker is committed to providing unbiased and transparent reporting. This article aims to deliver accurate and timely information but should not be taken as financial or investment advice. Since market conditions can change rapidly, we encourage you to verify information on your own and consult with a professional before making any decisions based on this content.

A crypto journalist with over 5 years of experience in the industry, Parth has worked with major media outlets in the crypto and finance world, gathering experience and expertise in the space after surviving bear and bull markets over the years. Parth is also an author of 4 self-published books.
The Cardano price action has been at an interesting stage despite continuing to trade far below its all-time high of $3.10, set in 2021. Yet, technical formations now indicate a possible reversal phase may be approaching, which may far surpass this ATH.
A symmetrical triangle pattern has been formed by converging rising lows and descending highs of last one year that has unmistakably taken shape on the ADA price chart, reflecting an extended period of compression.
Historically, such formations often precede sharp volatility spikes, and in Cardano’s case, the longer the consolidation, the greater the potential upside move would be in play.
In recent trading sessions, the ADA price today managed to gain nearly 18%, bouncing off the crucial $0.69 support level. This price zone now serves as a pivotal base for any upcoming bullish action. If ADA continues to hold this floor, the first upside target lies near $0.95, with higher levels like $1.15 and $1.35 emerging as critical resistance points to watch before year completion.
Critical Levels Define Cardano’s Path Ahead
For now, the Cardano price USD must maintain support at $0.69 more than ever to preserve the bullish setup. This is because a sustained strength here on from above this level could confirm the triangle breakout and odds suggest that ADA might push toward the $1.15-$1.35 resistance zone, before year-end if market sentiment turns positive.
But, if momentum carries ADA price action over into 2026, projections suggest that ADA could climb as high as $1.90 or even $2, which would represent more than a 210% increase from what the current levels are when writing. However, a breakdown below $0.66-$0.69 would invalidate this bullish formation and shift focus toward lower supports areas.
The coming weeks will therefore be pivotal for ADA, as whether the ADA crypto can convert its year-long compression into an explosive uptrend.
Elliott Wave Outlook Strengthens the Bullish Case
Adding depth to the bullish narrative, an early October X post reinforced optimism with an bullish ADA price forecast that aligns with Elliott Wave theory.
The chart mapped ADA’s journey through previous market cycles, labeling 2024’s election rally as Wave 1 and 2025’s sideways movement as Wave 2 as an accumulation phase that is waiting for a powerful expansion move.
According to this wave structure, the upcoming Wave 3 is projected to drive ADA toward the $3.37 mark, typically considered the strongest phase of a bullish cycle.
BINANCE:ADAUSDT & Alts
So this is representative of your average coin on Total 3, some are trading close to ATHs, some others below on the range lows.
But overall you can see how these last few months look clearly like a huge accumulation zone before the fireworks.
Whoever says Alts… pic.twitter.com/L6Rbq7UXOj
The extended consolidation period seen in 2025 strengthens this theory, suggesting that ADA has been quietly building momentum beneath the surface.
Recent liquidation events may have served as a “shakeout,” removing short-term traders and clearing the path for longer-term holders to accumulate positions before a breakout.
FAQs
What is the price prediction for Cardano ![]()
![]() ADAUSDT?
ADAUSDT?
Cardano’s price prediction suggests a potential rise to $1.90 or even $2.00 by 2026 if it successfully breaks out from its current long-term consolidation pattern.
Is Cardano a good investment?
Cardano shows a promising technical setup after a long consolidation, suggesting significant potential upside if it holds key support levels, though all crypto carries risk.
The XRP price is staging a powerful comeback, bouncing off a crucial support zone and reigniting bullish sentiment among traders who now see a potential long-term breakout toward the $15–$27 range.
This renewed optimism follows an intense week of volatility driven by geopolitical tensions and heavy liquidations. Analysts say XRP’s ability to defend its Gann support amid market turbulence could mark a critical turning point for the cryptocurrency’s next major rally.
On October 13, 2025, the XRP price today sits around $2.58 after climbing from lows of $2.32 on October 11. This recovery follows a sharp 42% flash crash triggered by escalating U.S.–China trade tensions after President Trump announced steep new tariffs. The rebound restored roughly $30 billion in market capitalization, marking one of the year’s heaviest trading sessions.
XRP was trading at around $2.58, up 7.96% in the last 24 hours at press time. Source: XRP price via Brave New Coin
Data from CoinDesk showed XRP jumping from $2.37 to $2.63 within 24 hours, supported by institutional trading volume exceeding $617 million. Most of the buying pressure occurred between 14:00 and 17:00 GMT, signaling aggressive dip-buying as the broader crypto market stabilized.
Technical charts highlight that XRP’s recent bounce coincides with the 3-month upper Gann support zone, which has acted as a major pivot during periods of heightened volatility. According to analysis shared by ChartNerdTA, the support level around $2 has historically played a critical role in sustaining bullish momentum.

XRP holds the $2 support level, setting sights on a potential breakout toward $15 and $27. Source: @ChartNerdTA via X
This rebound also aligns with a long-term bullish structure dating back to 2014. The analyst’s logarithmic chart projects potential Fibonacci extension targets of $15 at the 1.618 level and $27 at the 2.618 level, assuming XRP maintains its current support base.
“The structure mirrors previous multi-year expansions. If the $2 zone holds, the next major leg could be explosive,” the analyst explained.
On-chain data reveals notable whale activity during the rebound. A $2.89 million long position was reportedly closed at $2.6187, possibly indicating profit-taking after the surge from $2.37. Historically, whale movements in Ripple XRP have preceded short-term volatility and increased speculative trading.
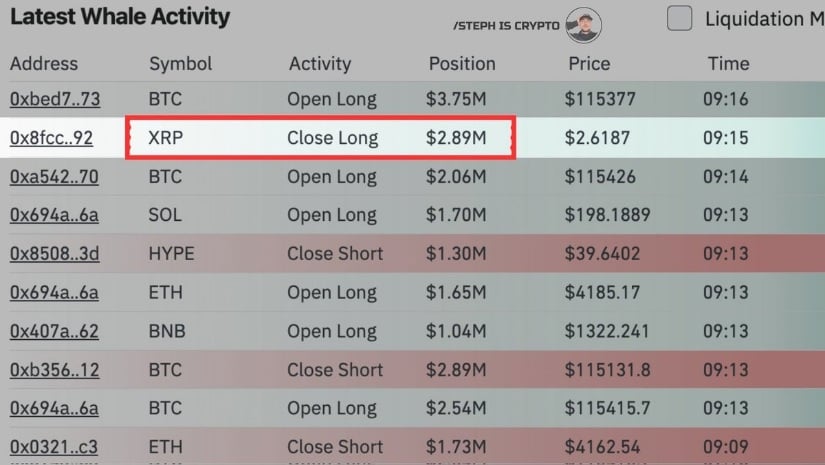
A major XRP whale closed a $2.89M long at $2.6187, raising questions over whether it’s an exit or strategic repositioning. Source: @RippleTrack via X
Institutional inflows of $30 billion in October, observed over 8 of the last 13 years, further support the case for sustained momentum. Data from Yahoo Finance also suggests October tends to be a seasonally strong month for the token.
From a technical perspective, XRP is currently trading within an ascending channel, with a $2.37 base and $2.58 lid. A clean breakout and sustained close above $2.60 could open the door for a push toward $2.70–$2.75. If buying pressure continues, analysts see $3.00 as the next major psychological resistance level.
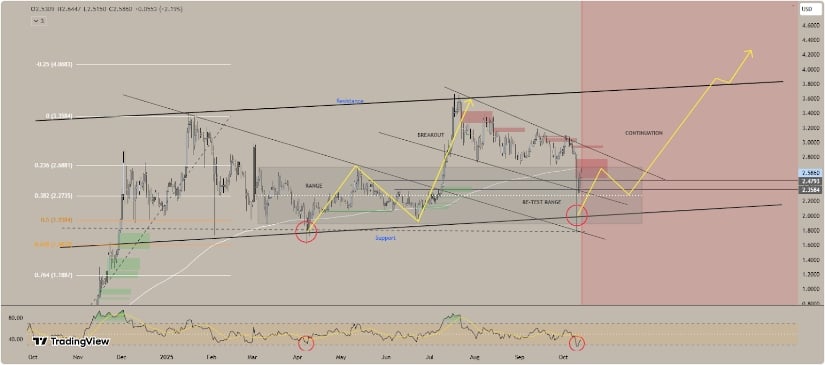
XRP may enter a continuation phase within its year-long bullish channel, progressing through consolidation, breakout, retest, and upward continuation stages. Source: LivingBitcoins on TradingView
Failure to hold $2.50, however, could trigger a retracement toward $2.42. Traders are closely monitoring the $2.57 level as a potential pivot, which, if maintained, may signal the continuation of the current bullish trend.
Market strategists also point to upcoming macroeconomic announcements and ongoing XRP SEC lawsuit developments as potential catalysts. ETF speculation, institutional flows, and a broader shift in crypto sentiment could all shape the next major move in XRP price.
Beyond near-term volatility, some analysts see this rebound as part of a larger XRP price prediction 2025 narrative. The Fibonacci extensions of $15 and $27, drawn from historical cycles, suggest the possibility of a multi-year bull run if the rally gains further momentum.
While optimistic projections capture market attention, analysts caution that cryptocurrency XRP remains highly sensitive to regulatory decisions, global economic conditions, and risk sentiment. If macro factors align with technical strength, XRP could enter a new price discovery phase.
Solana price is showing strong recovery momentum, reclaiming key levels and leading the crypto market rebound as participants eye a potential breakout ahead.
Solana price has bounced back in striking fashion after one of the sharpest shakeouts of the year, reclaiming key levels with impressive strength. The move not only signals renewed investor confidence but also highlights Solana’s growing dominance in leading the broader crypto recovery.
The crypto rebound Jesse Peralta mentioned is finally showing strength, with Solana up over 10%, outperforming both Bitcoin and Ethereum in the process. That kind of relative strength after a brutal sell-off highlights renewed demand, especially from market participants looking to re-enter quality assets first.
Solana price outperforms Bitcoin and Ethereum with a sharp 10% rebound, signaling renewed market confidence. Source: Jesse Peralta via X
Price action above $195 marks a critical shift, confirming that support has been regained at the $190 region. If Solana price sustains momentum here, the next leg could extend towards $210 to $216, reflecting the same leadership it showed earlier in the year. Holding above $188 on retests maintains the bullish recovery case.
A clean double-bottom reversal has now been confirmed, with SOL Solana price reclaiming territory above $194. The pattern shows clear structural strength, both bottoms forming near the same demand zone before price rebounded sharply back to resistance.

SOL confirms a double-bottom reversal pattern, reclaiming key resistance zones and signaling renewed bullish momentum. Source: ShardiB2 via X
ShardiB2’s chart highlights resistance bands at $216, $227, and $236, levels that previously triggered pullbacks. A breakout above $216 would confirm bullish continuation towards the $230 region. This setup reflects renewed momentum after the deep correction, and traders are beginning to position for a breakout retest.
CW8900 noted that Solana’s major sell wall extends up to $212, marking a near-term ceiling before any expansion higher. Volume analysis confirms heavy absorption near $180 to $185, suggesting accumulation beneath current levels.
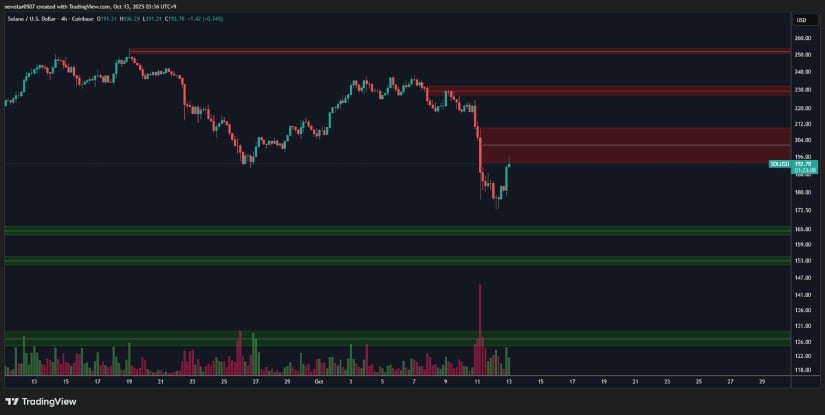
Solana faces a major sell wall near $212, with strong accumulation seen around $180–$185 hinting at potential breakout pressure ahead. Source: CW8900 via X
As open interest stabilizes, thinner sell-side liquidity above $212 could invite a sharp move higher if buy volume increases. In essence, once Solana clears that zone with volume confirmation, price discovery into the $230 to $236 range could accelerate rapidly. Until then, this remains the key short-term battleground.
Crypto Patel revisited the long-term perspective, reminding traders that Solana already surpassed its 2021 all-time high of $260 earlier this cycle, tapping $295 before the correction. From a cyclical view, SOL remains in an extended impulsive wave that could, if momentum sustains, project targets between $480 to $520.
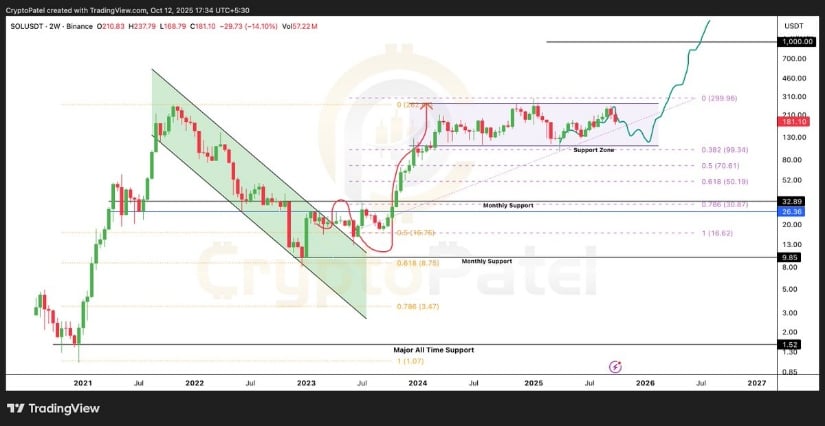
SOL maintains its long-term bullish structure, with analysts projecting a potential climb toward the $480–$520 range this cycle. Source: Crypto Patel via X
Technically, the $175 to $185 zone continues to act as the key mid-cycle base, aligning with the 0.382 Fibonacci retracement. As long as Solana holds above this band, the broader uptrend remains unbroken. The ecosystem’s rapid growth, expanding validator base, and sustained developer traction all add fuel to the long-term bullish narrative.
After weathering one of the toughest shakeouts of the year, Solana price is once again asserting dominance among majors. The recovery above key technical zones signals renewed confidence and structural strength.
If momentum sustains beyond $212, this Solana Price Prediction points to potential extensions toward $230 and $236, reaffirming its role as a market leader in this recovery phase. With fundamentals intact and sentiment improving, the current rebound may just be the start of Solana’s next major leg higher.
Binance’s move to compensate users affected by the October 10 depeg crisis appears to have restored confidence among traders. The exchange reimbursed $283 million to users impacted by the sudden depegging of Ethena’s USDe, BNSOL, and WBETH during a violent market crash.
The quick response served two purposes. First, it stabilized user sentiment that might have otherwise led to mass withdrawals. Second, it reframed Binance as a proactive rather than reactive exchange, a key perception shift in times of volatility. The market interpreted this as a show of financial strength—Binance still has liquidity to backstop crises.
This confidence bled directly into BNB price, the exchange’s native token, which surged alongside a 6.8% jump in the broader GM30 crypto index.
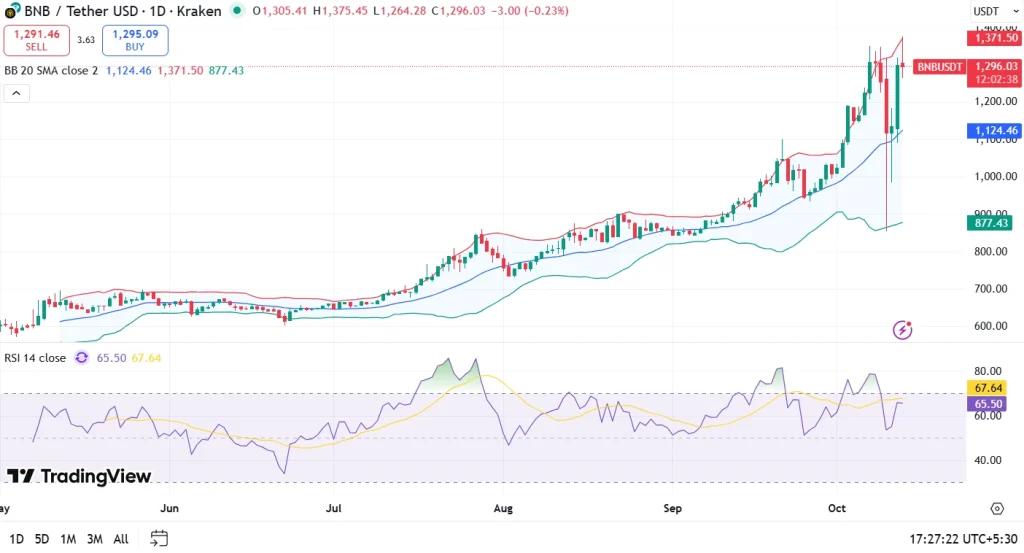
BNB’s daily chart tells a story of resilience. After hitting a high near $1,376, the coin pulled back sharply, only to bounce strongly from the middle Bollinger Band around $1,100. That’s a healthy technical reaction—buyers stepped in right at a logical support zone.
In short, the chart is showing early signs of trend recovery—but it’s not yet out of the woods.
Beyond the chart, Binance’s handling of the depeg event may have prevented a deeper market contagion. By clarifying that the depegs occurred after the crash (not before), Binance removed itself from being the cause of the panic. That matters. Exchanges losing credibility is one of the fastest ways to trigger systemic fear, as seen in FTX’s collapse.
By paying affected users promptly and adding mechanisms like soft price floors and redemption-based index adjustments, Binance essentially told the market: “We’ve got this under control.”
This narrative alone could sustain BNB’s rally in the short term, as traders often price in trust recovery faster than fundamentals change.
Here’s the likely scenario matrix based on the current structure:
Given the context, the first scenario looks more probable—especially if Bitcoin holds above $63K and overall market sentiment remains risk-on.
This rebound isn’t just about technicals—it’s about confidence. Binance just demonstrated that it can absorb a $283 million hit without flinching. That sends a strong signal to the market: Binance is still the dominant player, and its ecosystem remains intact.
$BNB is now testing whether it can turn this confidence into a sustained rally. If it can break through $1,400 decisively, the token could reprice much higher in the short term, possibly setting up for a run toward $1,500–$1,600 later this month.
For now, the trend is bending bullish again—but watch the $1,100 level. That’s where conviction meets reality.
You can check the Crypto Exchange Comparison.
Timothy Morano
Oct 12, 2025 19:35
MATIC price prediction suggests potential 105% upside to $0.78 target within 30 days, but technical indicators show mixed signals requiring careful risk management.
• MATIC short-term target (1 week): $0.42-$0.45 (+11-18%) – Testing SMA 20 resistance
• Polygon medium-term forecast (1 month): $0.55-$0.78 range (+45-105%) if momentum shifts
• Key level to break for bullish continuation: $0.58 – Strong resistance that unlocks higher targets
• Critical support if bearish: $0.35 – Break below triggers deeper correction to $0.33
The latest MATIC price prediction consensus reveals a cautiously optimistic outlook despite current technical headwinds. Recent analyst forecasts show significant variance in timeframes and targets:
PricePredictions.com’s conservative $0.804742 short-term target aligns closely with our technical resistance analysis at $0.78-$0.80. Their medium confidence rating reflects the challenging current setup, where MATIC trades below all major moving averages except the 7-day SMA.
More aggressive predictions include PriceForecastBot’s $1.20834 medium-term target and CoinCodex’s ambitious $1.751138 long-term forecast suggesting a 339% annual return. While these Polygon forecast projections appear optimistic given current bearish momentum indicators, they align with historical recovery patterns following oversold conditions.
The consensus view centers around initial recovery to $0.78-$0.80, making this our primary MATIC price target for the next 30 days.
Current Polygon technical analysis reveals a classic oversold setup with mixed momentum signals. MATIC’s RSI at 38.00 sits in neutral territory but approaching oversold levels, historically preceding bounce attempts.
The MACD histogram at -0.0045 shows persistent bearish momentum, but the narrowing gap between MACD (-0.0246) and signal line (-0.0202) suggests potential bullish divergence formation. This technical pattern often precedes trend reversals when combined with oversold RSI conditions.
Bollinger Bands positioning provides crucial insight – MATIC’s %B at 0.29 indicates price trading in the lower third of the band, with room for mean reversion toward the middle band at $0.43. The 24-hour trading volume of $1,074,371 on Binance remains relatively light, suggesting accumulation rather than distribution.
Critical resistance cluster exists at $0.42-$0.45 (SMA 20 and SMA 50), where previous support has now turned resistance. A decisive break above this zone would shift the intermediate outlook from bearish to neutral.
Primary Target: $0.78 (105% upside) – This MATIC price target represents the convergence of multiple technical factors including the 0.618 Fibonacci retracement from the recent decline and the lower boundary of the previous trading range.
Extended Target: $1.20 (215% upside) – Achievable if broader crypto market sentiment improves and MATIC reclaims the SMA 200 at $0.69. This level coincides with PriceForecastBot’s medium-term prediction.
Catalyst Requirements: Break above $0.58 resistance with volume expansion above 2 million daily, RSI reclaiming 50+ territory, and MACD histogram turning positive.
Immediate Risk: $0.35 support failure leads to $0.33 (13% downside) – This represents the 52-week low and final technical support before acceleration lower.
Extended Downside: $0.28-$0.30 zone (21-26% downside) – Previous 2023 lows that could be retested if broader market conditions deteriorate.
Risk Triggers: Daily close below $0.35, RSI breaking below 30 into oversold territory, and continued MACD histogram expansion into negative territory.
Based on current Polygon technical analysis, a staged accumulation approach appears most prudent rather than aggressive buying.
Conservative Entry: $0.35-$0.37 zone with 25% position size – This provides favorable risk/reward with tight stop-loss below $0.33 (6% risk) targeting $0.45 initial resistance (22% reward).
Aggressive Entry: Current levels $0.38-$0.39 with 15% position size – Higher risk but captures potential immediate bounce toward SMA 20 at $0.43.
Stop-Loss Strategy: Hard stop below $0.33 (52-week low) with trailing stop adjustment to $0.37 once price reaches $0.45.
Position Sizing: Maximum 5-7% portfolio allocation given high volatility (ATR 14 at $0.03) and uncertain broader market conditions.
The verdict on buy or sell MATIC currently favors cautious accumulation on weakness rather than aggressive buying, given mixed technical signals and proximity to critical support.
Our MATIC price prediction maintains a cautiously bullish outlook with 30-day target of $0.78 (105% upside potential) and medium confidence level. However, this forecast depends heavily on holding the $0.35 support level and broader cryptocurrency market stability.
Key confirmation signals to monitor:
– RSI reclaiming 45+ level indicating momentum shift
– MACD histogram turning positive for first time since early October
– Daily close above $0.42 (SMA 20) with volume expansion
– Break above $0.58 resistance for acceleration toward $0.78 target
Invalidation triggers:
– Daily close below $0.35 support
– RSI falling below 30 into deeply oversold territory
– Volume spike accompanying price breakdown
Timeline: 15-30 days for initial $0.45-$0.50 recovery, 30-45 days for primary $0.78 target assuming technical conditions improve. This Polygon forecast requires active monitoring as crypto markets remain highly volatile and subject to rapid sentiment shifts.
Image source: Shutterstock
In 2021, Dogecoin (DOGE) shocked the world when its price skyrocketed to $0.73. What started as an internet joke about a Shiba Inu dog suddenly became one of the most talked-about cryptocurrencies. People who once used DOGE for fun transactions online found themselves sitting on life-changing profits. But that was during a time of extreme market excitement, when celebrity tweets and social media trends could move billions of dollars overnight. Now, in October 2025, the question returns, Can Dogecoin ever reach those highs again? Or will it remain stuck below $0.20, remembered only as crypto’s most entertaining meme?
Dogecoin has recently shown new life. As of October 13, 2025, the coin surged by more than 11% in just one day. This sharp increase came as the broader crypto market began recovering from months of slow trading. The move wasn’t random key trading indicators suggest that investors are turning optimistic about DOGE again.
The short-term 7-day moving average has crossed above the 25-day average, which often indicates upward momentum. The MACD (Moving Average Convergence Divergence), a popular measure of price strength, is signaling a positive trend as well. Meanwhile, the RSI (Relative Strength Index), which gauges whether a coin is overbought or oversold, remains above 50 showing that buyers still dominate the market.

Dogecoin’s price has also been trading near the upper boundary of its Bollinger Bands, suggesting growing volatility. In simpler terms, this means big price movements either up or down likely ahead.
Data shows that whales recently purchased more than 8.2 billion DOGE, worth roughly $156 million. Many of these coins have been moved into “cold storage,” meaning they are being held offline for the long term rather than traded quickly for profit. This behavior typically reflects confidence in future price growth. Dogecoin’s ecosystem is also expanding. Projects like the Cardinals Index Node and DogeOS aim to give the token more real-world use cases, especially in decentralized applications. Some companies, such as CleanCore Solutions, have even started to include DOGE in their corporate treasuries, suggesting increasing institutional interest.
However, not everything is positive. Reports of $36 million in outflows from exchanges indicate that some traders are taking profits after the recent surge. In addition, the MACD histogram, another sign of momentum is beginning to flatten, which could mean the price rally is slowing down.

| Indicator | What It Shows | Interpretation |
|---|---|---|
| 7-day EMA vs 25-day EMA | Short-term trend | Bullish crossover, signaling upward momentum |
| MACD | Market strength | Still positive but showing slight weakening |
| RSI | Market sentiment | Above 50, buyers remain in control |
| Bollinger Bands | Volatility measure | Price near upper band, volatility expected |
| Whale Accumulation | Institutional interest | Positive, supports potential rebound |
The big question remains whether Dogecoin can return to its 2021 peak. For that to happen, several conditions would need to align. The first is strong market momentum, typically driven by Bitcoin. When Bitcoin rises, most other cryptocurrencies follow. The second is investor enthusiasm, Dogecoin often thrives on social media attention, especially when influencers or high-profile figures mention it. The third factor is utility. Dogecoin’s main criticism has always been that it lacks a clear purpose beyond being a fun and friendly cryptocurrency. Projects like DogeOS are meant to change that by introducing new applications that could make DOGE more useful for payments and decentralized finance.
Some analysts believe the coin could climb to around $0.22 in the short term if the current pattern holds. Others, taking a more optimistic stance, predict potential rallies toward $0.50 or even $1.50 by the end of 2025 though such numbers depend heavily on market-wide bullish conditions and sustained public interest. Still, there are major risks. Dogecoin’s supply is unlimited, meaning new coins continue to enter circulation, which can limit price growth. The $0.19 support level is crucial; if prices fall below it, traders may panic, causing a quick decline. Broader factors like government regulations or economic downturns could also influence Dogecoin’s future.
Dogecoin’s story has always been about community. The so-called “Doge Army” of small investors remains active and hopeful, holding onto their coins through both bull markets and crashes. At the same time, whale investors now play an even larger role. When they buy during dips, they can create powerful price surges. However, when they sell, the opposite happens. If whales continue accumulating and institutions start treating DOGE as a legitimate digital asset, prices could stabilize and even rise further. This institutional acceptance combined with continued ecosystem growth might give Dogecoin the staying power it lacked in previous years.
Dogecoin’s current price of around $0.1932 marks a strong recovery from earlier lows near $0.11. The short-term outlook appears positive, but long-term success depends on more than hype. The team and community need to deliver meaningful development, such as faster transactions, lower fees, and integration into online services. If that happens, the dream of $0.7 could become realistic again, though it might take time. Without strong fundamentals, Dogecoin could remain trapped in the $0.20–$0.30 range, vulnerable to quick market swings.
In short, Dogecoin remains both a symbol of crypto’s playful side and a serious contender when enthusiasm returns to the market. Whether it reaches new highs or stays an underdog depends on how well it evolves beyond its meme origins.
XRP has skyrocketed by 50% against the US dollar after Ripple announced a major strategic partnership. This news has sparked significant investor interest and activity. With a current price of $2.61911, XRP is gaining traction not only from Ripple’s latest move but also from rising trading volumes and speculation about future use cases. This surge illustrates how strategic decisions in the crypto market can rapidly drive investor confidence and market movements.
Ripple’s recent announcement of a strategic partnership has sent XRP prices soaring by 50%. This dramatic change is capturing attention across the crypto world. The partnership, which the company has yet to fully detail, is expected to leverage Ripple’s technology for greater transaction efficiency.
This shift has also highlighted the volatility and potential within the cryptocurrency market. The increase in XRP’s price has been accompanied by a surge in trading volumes, indicating growing interest. As Ripple strengthens its alliances, XRP’s position in the market may be further solidified. For more on this, see this Yahoo Finance article.
Cryptocurrency markets are experiencing rapid changes, driven by both innovation and investor sentiment. XRP’s recent price surge reflects a broader trend of increasing acceptance and integration of digital currencies in financial systems.
With more companies entering the crypto space, and ongoing development in blockchain technology, investors see vast potential for growth. XRP is a great example, illustrating how partnerships can quickly boost a cryptocurrency’s value and market presence. Investors remain watchful for similar opportunities across other digital assets, keeping an eye on developments that might affect market trends.
Currently priced at $2.61911, XRP has experienced varied price changes, with a 6-month gain of over 271%. Despite recent fluctuations, such as a daily drop of 3.99%, the overall upward trajectory signals strong investor enthusiasm.
Market sentiment reflects both optimism and caution. Indicators like the Relative Strength Index (RSI) at 38.53 suggest it is approaching oversold territory, while a bullish forecast points to potential future gains. This mix of data contributes to a dynamic investment environment where strategic decisions by Ripple can have significant market implications.
XRP’s 50% surge reflects the rapid impact of strategic business decisions in the crypto market. Ripple’s partnership underscores its ongoing influence and potential in the financial landscape. Investors should remain attentive to market trends and signals, as continued developments in blockchain technology and strategic partnerships could further propel XRP and other cryptocurrencies.
For those keen to capitalize on market movements, AI-powered platforms like Meyka provide real-time insights and predictive analytics, enhancing decision-making capabilities. As XRP continues to evolve within the ever-changing crypto market, investors should stay informed and ready to adapt to new trends and opportunities.
The recent 50% surge in XRP price was driven primarily by Ripple’s announcement of a strategic partnership, which has increased investor confidence and trading volume.
Ripple’s partnership is expected to enhance transaction efficiency, bolstering XRP’s utility and market value, which can lead to increased adoption and interest.
Market sentiment is mixed, combining optimism from potential future gains with caution due to recent price fluctuations. Indicators suggest that XRP might be oversold, hinting at potential recovery.
Disclaimer:
This is for information only, not financial advice. Always do your research.


