The main tag of cryptocurrency price today Articles.
You can use the search box below to find what you need.
[wd_asp id=1]
The main tag of cryptocurrency price today Articles.
You can use the search box below to find what you need.
[wd_asp id=1]
Dogecoin price predictions are coming alive after Bitcoin touched $107K. This is bullish indeed for DOGE, considering the correlation between Dogecoin and Bitcoin. Coupled with the recent acknowledgement of 21 Shares Dogecoin ETF application, crypto pundits believe a quick 2x run to $0.43 from its current price of $0.22 can be in the works barring a black swan. Is a break opportunity for Dogecoin around the bend? Let’s take a closer look at this Dogecoin price prediction.
Dogecoin stumbled out of the gates with a 6% weekly loss, after hitting as high as $0.2584 in previous weeks. After the hype from the ETF acknowledgement wore off, Dogecoin predictably struggled to sustain its pace leading to a drop to $0.21 until settling around $0.22 as of press time, trading sideways with a 2% gain in the past 24 hours.
However, crypto trader and analyst Bitcoin Sensus predicts that this action could be signals of a trend break opportunity, with Bitcoin Sensus recognizing an inverse head-and-shoulders pattern forming on the daily Dogecoin chart.
Cryptoscoping’s Dogecoin price prediction, highlighted in white, forecasts another major dip hitting the long-term trendline of $0.23 to 0.24 before a quick move upward to as much as $0.43. Cryptoscoping’s forecast predicts a week’s window to retest and relaunch a new run to those heights. The pullback, writes Cryptoscoping, is a very healthy one, offering an ideal time to buy into DOGE before the breakout arrives.
Veteran trader Javon Marks has been monitoring DOGE’s post-2023 breakout like a hawk, and by his predictions, DOGE is bullish. The asset’s clean break from a long-standing trendline late last year wasn’t just technical noise, it was the spark that ignited a pattern of higher highs and higher lows. That’s textbook strength in motion.
Marks isn’t shy with his outlook; he’s projecting a climb toward $0.65, nearly triple where DOGE is currently trading near $0.22. But that’s just the warm-up.
The real litmus test sits between $0.25 and $0.26 a zone that’s acted more like a brick wall than a checkpoint. Clear that and Marks sees a 200% move as firmly on the table, with momentum possibly carrying Dogecoin all the way into new all-time highs.
Marks is calling for DOGE to shatter the $0.74 ceiling and make a run all the way up to $1.25 in a full-tilt bull season.
Bullish Dogecoin price predictions aside, investors seeking nearer-term profits are looking elsewhere. After all, why go for a potential 2x at a higher price when you can take a bet on a solid, undervalued project at a lower price and a potential 100x? It’s a no-brainer.
That’s exactly what early-stage projects like Remittix (RTX) have to offer presale investors. Already raising past $15.2M with its presale with RTX tokens available at just $0.0757 per token, Remittix’s ambitious goal of changing $100T+ cross-border global payments market with its crypto-to-fiat payments protocol in over 100 cryptocurrencies into 30+ fiat options can translate into a 10x at least.
Audited by BlockSAFU and staking rewards of up to 18% APY, Remittix is perfectly positioned for a parabolic run in 2025.
Discover the future of PayFi with Remittix by checking out their presale here:
Website: https://remittix.io
Socials: https://linktr.ee/remittix
Press release
Cardano (ADA), which reached a historic high of $3.10 in September 2021, is currently trading at $0.7568 – still down over 70% from its peak.
However, recent on-chain and technical indicators suggest that ADA might be preparing for a breakout that could see its price multiply significantly, possibly even eyeing a 500% rally.
One of the most bullish signs comes from ADA’s movement off centralized exchanges.
According to CoinGlass, over $932 million worth of ADA has been withdrawn from exchanges in 2025 alone.
Exchange data also shows growing interest, with Binance leading ADA trade volume at $2.19 million, while Bybit tops net inflows at $259,750, followed by Binance at $178,300.
While inflows indicate new capital entering the ecosystem, the dominant theme remains the shrinking supply on exchanges – a classic precursor to a supply shock.
Cardano (ADA) is showing early signs of a major bullish breakout, with price action now testing the upper boundary of its long-standing descending channel.
After bouncing from local support around $0.68, ADA has reclaimed upward momentum and is building the structure for a sustained rally.
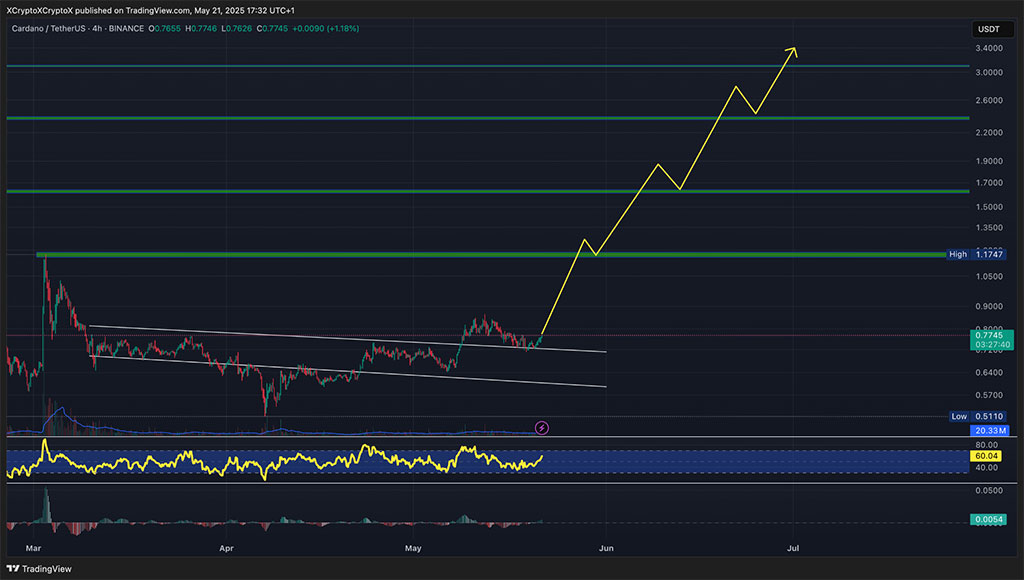
ADA Price Chart. Source: TradingView
The Relative Strength Index (RSI) has recovered to 59.46, reversing from recent lows and indicating growing buyer interest. A clean break above 60 would reinforce bullish sentiment and suggest a stronger move is underway.
At the same time, the MACD is flattening, with the MACD line closing in on a bullish crossover above the signal line – a shift that typically precedes upside acceleration.
If bulls can flip the key resistance level at $1.17 into support, ADA could extend its rally to $1.90, then $2.60, with a long-term target as high as $3.40.
With momentum shifting and sentiment improving across the market, Cardano appears well-positioned for a multi-stage breakout this summer.
While ADA sets up for a massive 500% rally, SUBBD ($SUBBD) is leading a new wave of innovation in the creator economy – fusing AI and blockchain to revolutionize how content is made, shared, and monetized.
With powerful AI tools for creators, integrated video streaming, and fan engagement mechanics, SUBBD is more than a platform – it’s a movement.
Token-based governance empowers users to shape the future of the ecosystem, making it one of the most promising AI-powered crypto projects of the year.

Source: SUBBD
The project has already raised a massive $465K in its ongoing presale with over 2 days, 23 hours until the next price increase.
Through $SUBBD tokens, fans can unlock exclusive content, access discounts, and support their favorite creators with features like boosted visibility in discovery feeds and perks for community engagement.
To purchase $SUBBD at the current price of $0.055475 per token, visit the official SUBBD website and connect a support wallet like Best Wallet.
You can then complete your transaction by swapping ETH, BNB, USDT, or USDC – or simply use a bank card for a fast and easy checkout.
Disclaimer: This publication is sponsored. Coinspeaker does not endorse or assume responsibility for the content, accuracy, quality, advertising, products, or other materials on this web page. Readers are advised to conduct their own research before engaging with any company mentioned. Please note that the featured information is not intended as, and shall not be understood or construed as legal, tax, investment, financial, or other advice. Nothing contained on this web page constitutes a solicitation, recommendation, endorsement, or offer by Coinspeaker or any third party service provider to buy or sell any cryptoassets or other financial instruments. Crypto assets are a high-risk investment. You should consider whether you understand the possibility of losing money due to leverage. None of the material should be considered as investment advice. Coinspeaker shall not be held liable, directly or indirectly, for any damages or losses arising from the use or reliance on any content, goods, or services featured on this web page.
Related Releases
XRP is trading at $2.35, up slightly 0.25% in the last 24 hours. The trading volume jumped to $3.77 billion, an increase of 31.95%, reflecting greater market action. XRP has fallen 7.69% in the past week, however, pointing towards an overall short-term correction in its setup.
Crypto Analyst VipRoseTr identifies an established breakout through a falling wedge chart pattern, a traditionally bullishly oriented formation. The asset jumped strongly from the buy area between $1.85 and $1.90, registering at a local high in the area of $2.40. The movement is worth 26% from the reversal area and is in the direction of the break above the wedge resistance line. XRP is consolidating now in the area between $2.30 and $2.35, in a constructive manner.

The downtrend, marked by declining resistance and sloping descending support, indicated decreasing bearish pressure. As XRP broke above the top limit of the downtrend, technical verification for the reversal in the trend was formed. As the existing consolidation remained above $2.30, experts anticipate the continuation pattern.
Price targets identified by VipRoseTr are $2.95, $3.39, and $3.87, including potential areas of resistance. Traders are waiting for the break above $2.50, which might trigger the next leg up. Critical in sustaining the upward trajectory will be support above the $2.20–$2.30 area.
The volume indicators in the breakout validated the move, although no specific volume figures were released. There is an indicator on the chart in June, suggesting an upcoming event or turning point, but we can’t glean too much from it.
While the trend of XRP now depicts the currency in a hopeful light, its longer-term estimates give different visions. XRP is bound for $3.84 and, perhaps, beyond the $5.16 threshold through the end of 2025. Such projections rely on sustained optimism from investors and crossing beyond the existing all-time high of $3.84.
On the other hand, the analysis on Changelly is more pessimistic, predicting up to $2.10 in 2025. Their model predicts an average price of $2.34, implying an investment return level of -11.4%. May 2025 projections project XRP prices between $2.04 and $2.34, averaging closer to the existing figures.
Related Reading | South Korea Cracks Down on Crypto Sales by Non-Profits and Exchanges
SOL Eyes $200 Breakout as Wallet Growth, Revenue Surge, and Bullish Structure Set Stage for 2025 Rally
Solana is starting to gain momentum as positive developments start to circulate. Price is holding near key levels, a clean technical structure is shaping up, and on-chain metrics are flashing green across the board. While SOL hasn’t made its next big move yet, but the setup is looking increasingly primed for a rally.
Solana is showing signs of strength again, and this time it’s backed by clean technicals. Analyst Jesse Peralta has highlighted a potential curling bottom forming inside the wedge, with a projected breakout eyeing the $200 mark. While the move hasn’t been confirmed yet but Jesse Peralta anticipates a breakout in this style.
Solana forms a curling bottom inside a falling wedge, setting sights on a potential breakout toward $200. Source: Jesse Peralta via X
The key to watch here is whether SOL can break above the wedge’s upper trendline with strong volume. If that happens, it could trigger a fresh leg upward, especially if BTC and ETH hold steady. Until then, the setup remains a possibility rather than a confirmation, but it’s one worth tracking closely for those eyeing a continuation toward $200.
While Solana’s price action trades within a wedge, the network’s user base continues to expand. On-chain analyst Ali Martinez points out that the number of wallets holding at least 0.1 SOL has now reached a new all-time high of 11.16 million. That kind of steady accumulation suggests growing retail interest.

Solana wallet addresses holding at least 0.1 SOL hit a record 11.16 million, signaling rising grassroots adoption. Source: Ali Martinez via X
This rise in smaller wallet holders signals more than just passive interest. It reflects growing network engagement and decentralization. When participation deepens at the grassroots level, it can add resilience to price structures. If Solana does push above resistance, this expanding user base could help support a healthier rally.
While retail adoption on Solana continues to climb, the protocol is also setting the pace on a network level. According to data shared by Christiaan, Solana generated over $40 million in weekly network revenue, more than Ethereum, Tron, and other major L1s and L2s combined. For a chain often seen as the underdog in past cycles, this is a clear sign that Solana isn’t just growing in users, it’s now starting to be an earning source.

Solana tops weekly network revenue charts with over $40 million, outperforming Ethereum and other major chains. Source: Christiaan via X
This kind of steady network activity doesn’t always lead to instant price jumps, but it does help build a stronger foundation. When you see both user growth and real revenue coming in, it usually means the ecosystem is gaining momentum in a healthier way. And while no single stat guarantees a rally, it’s these kinds of positive triggers that can quietly support price over time.
Solana is now about to test an important trendline level, as highlighted by Coinvo, and this could define its short-term direction. Despite all the ongoing positive signals from rising wallet numbers to surging network revenue, price action for the short term is at an important level. The trendline has acted as a reliable support throughout this uptrend, and how SOL reacts here will shape whether we see continuation or a cooling-off period.

Solana approaches key trendline support that has guided its recent uptrend, with a bounce here potentially setting up a move toward $200. Source: Coinvo via X
Zooming out, the broader picture still leans bullish with solid growth on multiple fronts. Coinvo believes this is where the market gets to vote. A strong hold and bounce could be the green light for SOL Solana price to revisit higher levels, potentially pushing toward that $200 mark.
Solana’s long-term structure is still intact, and it’s quietly turning heads again. As shown by analyst Cas Abbé, the multi-year uptrend remains strong. SOL Solana price has recently rallied over 50%, riding on both technical resilience and improving fundamentals.

Cas Abbé suggests new all-time highs could arrive in 2025. Source: Cas Abbé via X
What makes this even more interesting for a Solana price prediction is Abbé’s take that $290 wasn’t the peak. He believes Solana could hit new all-time highs in 2025. While that bigger move may take time to unfold, the current structure is setting the stage.
Solana is showing solid signs of growth, both on the charts and fundamentally. With strong on-chain activity, rising wallet numbers, and consistent revenue, the foundation looks healthier. While short-term moves will depend on how SOL handles key technical levels, the bigger picture still leans bullish. If momentum holds and the trendline continues to support price, Solana could be setting up for a strong run into 2025.
The crypto market remains mainly bullish today, according to CoinStats.CoinStats”>
The price of Ethereum ![]() ETHUSD has gone up by 2.43% over the last day.TradingView”>
ETHUSD has gone up by 2.43% over the last day.TradingView”>
On the hourly chart, the rate of ETH is closer to the support than to the resistance. If bulls cannot seize the initiative soon, traders may expect a level breakout, followed by a further correction to the $2,500 zone.TradingView”>
On the bigger time frame, the price of the main altcoin is in the middle of the wide channel, between the support of $2,317 and the resistance of $2,738.
As neither bulls nor bears are dominating, there are low chances of seeing sharp moves soon.TradingView”>
From the midterm point of view, the rate of ETH has once again bounced off the resistance of $2,608. However, if the weekly bar closes near that mark, traders may witness a blast to the vital zone of $3,000.
Ethereum is trading at $2,571 at press time.
Cardano (ADA) is showing signs of bullish momentum, surpassing $0.75 and raising the prospect of a further surge to the $1 mark.
At press time, ADA is trading at $0.755, up 4% in the last 24 hours, as renewed buying pressure in the crypto market has helped Cardano rise.
Bitcoin (BTC), the largest cryptocurrency by market capitalization, edged closer to its all-time highs in the early Wednesday session, reaching $108,000. Futures open interest on major crypto exchanges is at an all-time high, indicating increasing speculative activity and leveraged holdings.
You Might Also Like

Cardano recovered from a low of $0.7105 on May 19 and is on course to post two straight days of gains since then. Today’s gain reached an intraday high of $0.766 as the market waits to see what happens next for Cardano.
On the upside, Cardano‘s next major resistance lies at the daily SMA 50 at $0.811 and then $0.8645. If ADA can sustain its momentum and overcome these resistance levels, it may eventually reach $1. A surge past $1 would be significant for the Cardano price, signaling a potential return to its previous bull market trajectory.
You Might Also Like

Cardano, however, remains in consolidation between its moving averages of 50 and 200 at $0.689 and $0.811, respectively. The daily RSI is slightly over the 50 midpoint, indicating the possibility of consolidation in the coming days before the next major move.
The next support level is $0.71, ahead of the 50-day SMA of $0.68. A break and close below the 50-day SMA raises the chances of a drop to $0.58.
Key points:
Bitcoin made a new all-time high, but the bulls will have to sustain the higher levels for the momentum to pick up.
Several altcoins have bounced off their respective support levels, signaling a positive sentiment.
Analysts expect Bitcoin to maintain its positive momentum and surge above $200,000 by the end of the year.
Bitcoin BTCUSD rose to a new all-time high on May 21 on easing macroeconomic fears and continued inflows into the US-based spot Bitcoin exchange-traded funds. Analysts expect the momentum to continue and Bitcoin to surge to $200,000 by the end of the year.
There are some murmurs among analysts about a bearish divergence, leading to a double-top pattern. However, private wealth manager Swissblock Technologies said in a post on X that its Bitcoin Fundamental Index is not showing any bearish divergence, and the onchain strength remains intact.

Bitcoin is on the verge of forming a “golden cross” on the daily chart, which generally is followed by sharp rallies, barring a few instances when the pattern failed. Bitcoin’s strength is expected to improve sentiment in the cryptocurrency sector, pulling several altcoins higher.
What are the possible target levels for Bitcoin? Could altcoins break above their respective overhead resistance levels? Let’s analyze the charts of the top 10 cryptocurrencies to find out.
Bitcoin price prediction
Bitcoin rose above the $109,588 overhead resistance, but the bulls are struggling to sustain the higher levels, as seen from the long wick on the candlestick.

The upsloping moving averages and the relative strength index (RSI) in the overbought zone indicate that the bulls are in control. If the price closes above $109,588, the ![]()
![]() BTCUSDT pair could pick up momentum and skyrocket toward $130,000.
BTCUSDT pair could pick up momentum and skyrocket toward $130,000.
The 20-day exponential moving average ($101,958) is the critical support to watch out for on the downside. A break below the 20-day EMA will be the first sign that the bulls are booking profits in a hurry. That increases the risk of a break below the psychological support of $100,000.
Ether price prediction
Buyers are trying to sustain Ether (ETH) above the $2,550 level but are facing significant resistance from the bears.

The upsloping 20-day EMA ($2,334) and the RSI near the overbought zone indicate that buyers are in control. The ![]()
![]() ETHUSDT pair is likely to pick up momentum on a break above $2,739. That clears the path for a rally to $3,000.
ETHUSDT pair is likely to pick up momentum on a break above $2,739. That clears the path for a rally to $3,000.
Contrary to this assumption, a break and close below the 20-day EMA signals that the bears are back in the game. The pair could tumble to $2,111, which is likely to attract solid buying by the bulls.
XRP price prediction
XRP (XRP) has been witnessing a tough battle between the buyers and sellers at the 20-day EMA ($2.35).

The flattish 20-day EMA and the RSI near the midpoint do not give a clear advantage either to the bulls or the bears. If the price skids below the 20-day EMA, the ![]()
![]() XRPUSDT pair may stay inside the $2 to $2.65 range for a while.
XRPUSDT pair may stay inside the $2 to $2.65 range for a while.
Instead, if the price turns up sharply from the 20-day EMA and breaks above $2.65, the advantage will tilt in favor of the bulls. The pair could rally to $3 and, after that, to $3.40, where the sellers are expected to mount a strong defense.
BNB price prediction
BNB (BNB) bulls have held the 20-day EMA ($639) support during the pullback, indicating buying on dips.

The bulls will try to push the price above $693 but are expected to face solid selling by the bears. However, if buyers bulldoze their way through, the ![]()
![]() BNBUSDT pair could skyrocket to the overhead resistance at $745.
BNBUSDT pair could skyrocket to the overhead resistance at $745.
This optimistic view will be negated in the near term if the price turns down from the current level or the overhead resistance and breaks below the 20-day EMA. That could sink the pair to the 50-day SMA ($609).
Solana price prediction
Sellers failed to pull Solana (SOL) below the 20-day EMA ($164), indicating demand at lower levels.

The bulls will try to propel the price above the $185 overhead resistance. If they can pull it off, the ![]()
![]() SOLUSDT pair could accelerate toward the target objective of $210 and then $220.
SOLUSDT pair could accelerate toward the target objective of $210 and then $220.
If sellers want to prevent the upside, they will have to quickly tug the price below the 20-day EMA. The pair could slide to $153 and later to the 50-day SMA ($145). That suggests a possible range-bound action between $120 and $180.
Dogecoin price prediction
Dogecoin (DOGE) has bounced off the breakout level of $0.21, indicating that buyers are active at lower levels.

The 20-day EMA ($0.21) is trending up, and the RSI is in the positive zone, signaling that buyers are in command. The ![]()
![]() DOGEUSDT pair could rally to the $0.26 level, which could attract sellers. If the price turns down sharply from the overhead resistance, the pair could form a narrow range between $0.26 and $0.21 for some time.
DOGEUSDT pair could rally to the $0.26 level, which could attract sellers. If the price turns down sharply from the overhead resistance, the pair could form a narrow range between $0.26 and $0.21 for some time.
Contrarily, a break and close above $0.26 signals the start of the next leg of the up move. The pair could then surge to $0.35.
Cardano price prediction
The bulls have kept Cardano (ADA) above the neckline of the inverse head-and-shoulders (H&S) pattern during the pullback.

The flattish 20-day EMA ($0.74) and the RSI in the positive zone indicate the bulls have an edge. Buyers will have to thrust the price above $0.86 to signal the resumption of the uptrend. The ![]()
![]() ADAUSDT pair could then skyrocket to $1.01.
ADAUSDT pair could then skyrocket to $1.01.
This positive view will be invalidated in the near term if the price turns down and breaks below the 50-day SMA ($0.69). That suggests the bulls are losing their grip, increasing the risk of a fall to $0.60.
Sui price prediction
Sui’s (SUI) pullback has taken support at the 20-day EMA ($3.73), indicating a positive sentiment.

The upsloping 20-day EMA and the RSI in the positive territory indicate an advantage to buyers. The ![]()
![]() SUIUSDT pair could reach the $4.25 obstacle, where the sellers are expected to step in. If buyers do not cede much ground to the bears, it increases the likelihood of a break above $4.25. The pair may then climb to $5.
SUIUSDT pair could reach the $4.25 obstacle, where the sellers are expected to step in. If buyers do not cede much ground to the bears, it increases the likelihood of a break above $4.25. The pair may then climb to $5.
The 20-day EMA is the critical support to watch out for on the downside. A break and close below the 20-day EMA could sink the pair to the 50-day SMA ($3.04).
Chainlink price prediction
Buyers successfully defended the neckline of the inverse H&S pattern in Chainlink (LINK), indicating buying on dips.

The bulls are trying to strengthen their position by pushing the price above the resistance line. If they manage to do that, the ![]()
![]() LINKUSDT pair could rally to $18. Sellers will try to halt the up move at $18, but the rally could extend to $19.80 if the bulls prevail.
LINKUSDT pair could rally to $18. Sellers will try to halt the up move at $18, but the rally could extend to $19.80 if the bulls prevail.
Time is running out for the bears. If they want to make a comeback, they will have to swiftly yank the price below the 50-day SMA. The pair may then remain inside the channel for a few more days.
Avalanche price prediction
Avalanche (AVAX) took support at the 50-day SMA ($20.88), signaling that the bulls are trying to form a higher low.

Buyers will have to drive and maintain the price above the $23.50 resistance to gain the upper hand. The ![]()
![]() AVAXUSDT pair could then climb to $26.84, which may act as a hurdle. If buyers overcome the $26.84 barrier, the pair could ascend to $31.73 and subsequently to $36.
AVAXUSDT pair could then climb to $26.84, which may act as a hurdle. If buyers overcome the $26.84 barrier, the pair could ascend to $31.73 and subsequently to $36.
Contrary to this assumption, if the price turns down from the overhead resistance and breaks below the 50-day SMA, it suggests that the bulls have given up. The pair could then decline to $18.50.
This article does not contain investment advice or recommendations. Every investment and trading move involves risk, and readers should conduct their own research when making a decision.
Even though most of the coins remain in the green zone, the prices of some cryptocurrencies have started to fall, according to CoinMarketCap.
The rate of Solana (SOL) has increased by 0.61% over the past day.

On the hourly chart, the price of SOL is near the support of $166.78. If buyers cannot seize the initiative, the breakout may lead to a test of the $165 zone by tomorrow.

On the bigger time frame, the rate of SOL is trading within yesterday’s bar. The price is far from key levels, which means none of the sides has accumulated enough energy yet.
You Might Also Like

In this case, sideways trading in the narrow range of $164-$174 is the most likely scenario.

From the midterm point of view, neither bulls nor bears are dominating. The volume remains low, which means traders are unlikely to witness sharp moves soon.
SOL is trading at $168.26 at press time.
After last week’s explosive surge, the Ethereum price today is trading near $2,558, reflecting a measured gain of 0.26% over the last 24 hours. Although buyers pushed ETH as high as $2,615 on May 20, the rally lost steam near a key resistance zone, leading to a mild pullback. With volatility tightening and lower-timeframe indicators flashing mixed signals, traders are now assessing whether bulls can maintain upward momentum or if a short-term correction looms.
Following this corrective pause, the broader question emerging is: Why Ethereum price going down today, and is this pullback just a breather within a bullish continuation or the start of a deeper retracement?
From a daily perspective, the Ethereum price action has remained bullish since reclaiming the $2,400 level in early May. The sharp breakout above the descending trendline and the reclaim of the 100-day EMA have now turned previous resistance into support. The daily structure shows ETH attempting to form a higher high pattern as it tests the upper boundary of the $2,580–$2,620 supply zone that capped upside during February.
Looking at the weekly chart, ETH remains above the 38.2% Fibonacci retracement level near $2,424, with its next major resistance lying near $2,745 — the 0.5 Fib zone from the broader decline between November 2023 and March 2025. This confirms the ongoing recovery, although a break above $2,600 is still needed to confirm trend extension.
On the 4-hour chart, Ethereum price shows signs of consolidation following last week’s vertical rally. RSI has slipped from overbought territory to 54.93, reflecting fading momentum. Simultaneously, the MACD histogram is flattening, and the lines have begun to converge, pointing toward potential short-term indecision. While no bearish crossover is confirmed yet, the setup hints at caution.
The 30-minute Stochastic RSI shows a sharper drop, with the blue line falling to 5.42, well into oversold territory. This could suggest that downside may be limited in the immediate term — especially if $2,520 support holds firm.
Bollinger Bands on the 4-hour chart are still expanding, signaling sustained Ethereum price volatility ahead. However, recent candles show rejection from the upper band, reinforcing resistance near $2,610. If price compresses further below this level, expect a volatility breakout by May 22.
ETH faced sharp intraday rejection from $2,615, which coincides with a historically reactive resistance zone. The move also aligned with the top of the Bollinger Band on the 4H chart and the top boundary of the Ichimoku cloud on the 30-minute timeframe — both strong reversal triggers in short-term trading systems.
Adding to this, the Stoch RSI on lower timeframes suggests overbought exhaustion, with a swing low setup forming around $2,530. With speculative longs unwinding, the Ethereum price update shows minor but notable pressure on the upside.
Despite this, the broader structure remains bullish. The key now lies in whether bulls can absorb selling pressure around $2,520–$2,530 and reclaim $2,580 in the next 24 hours. A failure to defend $2,520 could invite deeper tests toward the $2,465–$2,475 demand zone.
If bulls can successfully flip the $2,580–$2,600 region into support, the path toward $2,745 (Fib 0.5) remains open. Beyond that, $2,850 and $3,000 would be the next natural targets — both psychologically and structurally.
However, failure to defend $2,520 could result in a dip to $2,465 and potentially $2,424 (Fib 0.382), where significant accumulation occurred during last week’s rally. The Ichimoku cloud base and Bollinger midline on the 4H also sit around this zone, making it a critical support region.
Until then, price may remain range-bound between $2,520 and $2,600. Traders should monitor RSI behavior around 50 and MACD crossovers for signs of breakout or breakdown confirmation.
ETH Technical Forecast Table: May 22
| Indicator/Zone | Level (USD) | Signal |
| Resistance 1 | 2,615 | Near-term rejection zone |
| Resistance 2 | 2,745 | Fib 0.5 & breakout target |
| Support 1 | 2,520 | Short-term bullish defense line |
| Support 2 | 2,465 | Structure + cloud bottom |
| RSI (4H) | 54.93 | Neutral to mild bullish |
| MACD (30-min) | -0.25 | Flattening |
| Stoch RSI (30-min) | 5.42 | Oversold |
| Bollinger Band Width | Expanding | Volatility brewing |
Disclaimer: The information presented in this article is for informational and educational purposes only. The article does not constitute financial advice or advice of any kind. Coin Edition is not responsible for any losses incurred as a result of the utilization of content, products, or services mentioned. Readers are advised to exercise caution before taking any action related to the company.
Key takeaways:
Bitcoin gained 14% since May 5, breaking $108,000 for the first time since January.
Targets of $140,000 and even $200,000 are increasingly discussed for 2025.
Bitcoin (BTC) price has climbed by more than 14% since May 5, rallying to $107,000 on May 21.
Data from Cointelegraph Markets Pro and TradingView shows that the price of Bitcoin rose 3.6% to a four-month high of $108,000 on May 21 from a low of $104,200 the previous day.
The last time BTC/USD traded above this level was on Jan. 20, when President Donald Trump’s inauguration fueled BTC’s price rally to $109,350 all-time high.
Bitcoin’s price rise coincides with a marketwide rally, with the global crypto market capitalization rising above $3.36 trillion for the first time since Feb. 3.
The uptrend has left market participants wondering how much higher Bitcoin prices can go before a significant correction.
Bitcoin’s latest recovery has sparked optimism among market analysts and traders, who expect BTC to blast toward new all-time highs.
Bitcoin is going to all-time highs today, said popular analyst AlphaBTC in a May 21 post on X.
An accompanying chart showed Bitcoin’s price trading within an extended ascending parallel channel since it began its recovery on April 9.
As of May 21, BTC’s price was trading 2.5% below its all-time high of over $109,000, which was the next major resistance. If this barrier is broken, AlphaBTC anticipates $115,000 as the next likely target.
“It seems inevitable that $BTC takes out the ATH soon, this grind and pop (squeeze) price action is being driven by bigger players that have their targets and know what it takes to use the bears shorting every pop to move the price higher.”

“Bitcoin is going to an all-time high faster than I expected,” said MN Capital founder Michael van de Poppe in a May 20 post on X.
According to van de Poppe, BTC price could rise as high as $200,000 “because more and more people are done with the constant devaluation of the dollar.”
Fellow analyst Mags said the price was entering its “biggest bull run ever,” projecting a possible top around $215,000 based on Bitcoin’s four-year halving cycle.

Meanwhile, network economist Timothy Peterson used statistical analysis to assume a trip to at least $115,000 by the end of June, setting a possible top under $130,000.
Related: Bitcoin ‘blow-off top’ set at $128K with new all-time highs in sight
From a technical perspective, Bitcoin’s price has formed a rounded bottom chart pattern on the daily chart (see below). Bulls are now focused on pushing the price above the neckline of the prevailing chart pattern at $106,000.
A daily candlestick close above this level would confirm a bullish breakout from the rounded bottom formation, ushering BTC into price discovery with the technical target set at $140,956, or a 37% increase from the current level.

The relative strength index, or RSI, is at 69, suggesting there is still room to run, particularly with an impending golden cross.
As Cointelegraph reported, a move to new all-time highs above $110,000 is possible by the end of this week, backed by BTC accumulation across all holder cohorts.
This article does not contain investment advice or recommendations. Every investment and trading move involves risk, and readers should conduct their own research when making a decision.

 Price Prediction for May 22")