The main tag of cryptocurrency price today Articles.
You can use the search box below to find what you need.
[wd_asp id=1]
The main tag of cryptocurrency price today Articles.
You can use the search box below to find what you need.
[wd_asp id=1]
Ripple (XRP) price trades broadly sideways around $2.34 on Tuesday, marking its second straight day of minor declines. This tight, range-bound action coincides with the launch of XRP futures on CME Group’s derivatives platform. CME Group received the green light to list XRP futures contracts after the Commodity Futures Trading Commission (CFTC) categorised XRP as a commodity. The product targeting institutional and retail traders is cash settled and relies on the CME’s reference data, which is updated daily.
XRP’s price remained relatively flat even as other major assets, including Bitcoin (BTC) and Ethereum (ETH), ticked higher during the late American session on Monday and the Asian session on Tuesday.
The uptick followed a call between United States (US) President Donald Trump and Russia’s President Vladimir Putin on Monday. President Trump hinted at a Russia-Ukraine ceasefire, with the two conflicting nations expected to begin talks immediately.
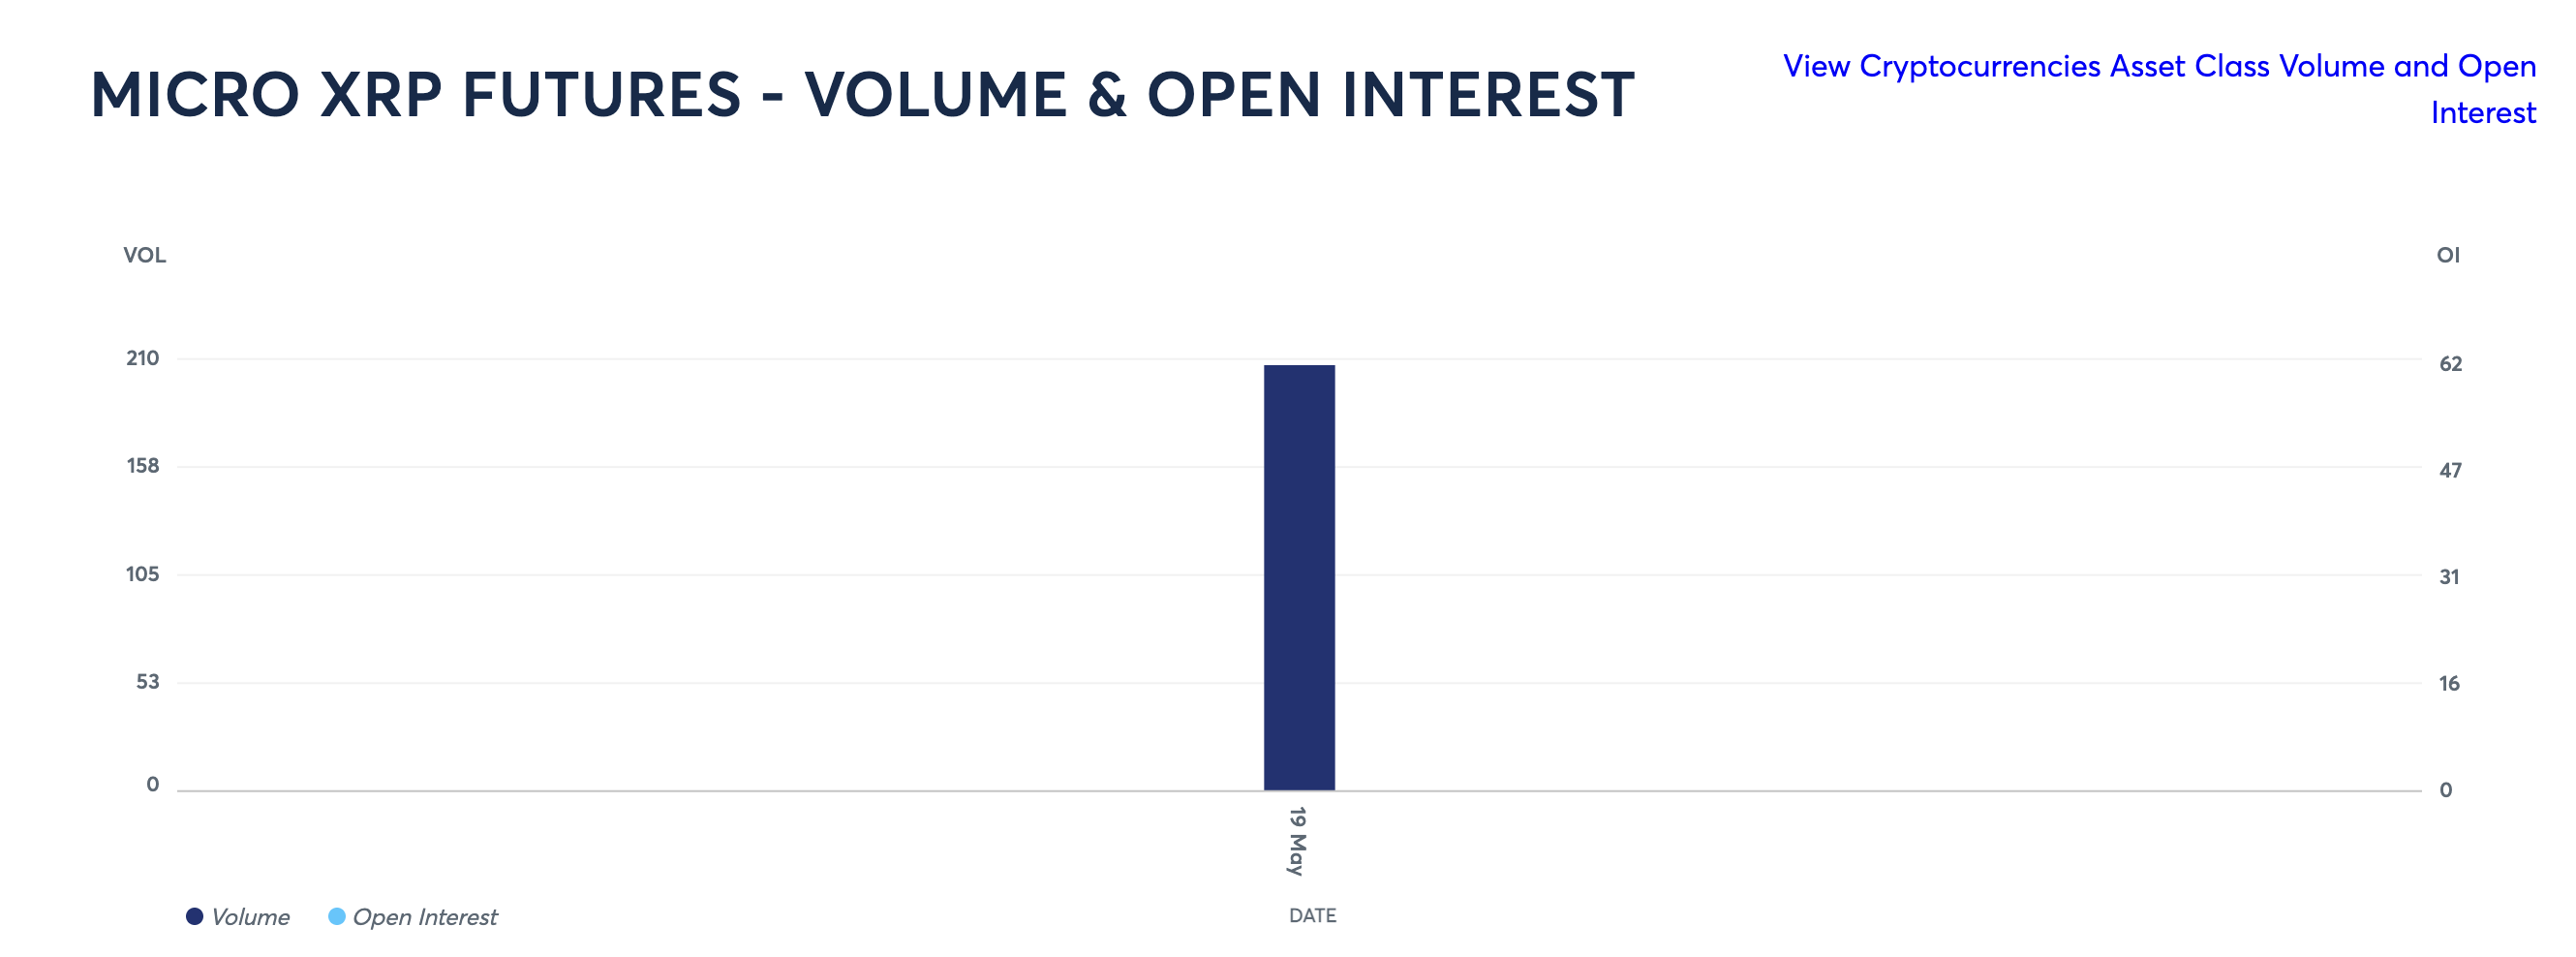
XRP futures contracts started trading on the CME Group’s derivatives platform on Monday, posting an impressive $2.4 million in trading volume during their first session.
CME data shows nine standard XRP futures (each accounting for 50,000 XRP) traded on the first day, summing to approximately $1 million in notional volume at an average price of $2.35.
The lion’s share of trading activity was linked to micro contracts, which reached 236 at the end of the session (each accounting for 2,500 XRP), totalling over $1.38 million in volume.
XRP futures contracts | Source: CME Group
The XRP futures contracts are cash-settled and benchmarked to the CME CF XRP-Dollar Reference Rate, which is established daily. This product, which has been designed for institutional and retail traders, boasts flexible hedging and trading strategies.
XRP futures contracts | Source: CME Group
Ripple’s CEO Brad Garlinghouse said in a post on X on Monday that “the launch of regulated XRP futures on CME Group marks a key institutional milestone for XRP.”
Sentiment around XRP has been shifting frequently in the past few weeks, affecting market dynamics. This sentiment has been a product of Judge Analisa Torres’ denial of a joint motion by Ripple and the Securities & Exchange Commission (SEC) seeking an indicative ruling to dissolve the $125 million penalty imposed in 2024 in favour of a $50 million settlement fee.
XRP’s price hovers around $2.34 at the time of writing, after extending the decline from highs that reached $2.65 last week. The cross-border remittance token holds above a key support at the 50-day Exponential Moving Average (EMA) around $2.28.
If this level gives way, the 100-day EMA at roughly $2.26 could provide the next line of defence. Further declines might see XRP test the 200-day EMA near $2.04.
The Moving Average Convergence Divergence (MACD) indicator has confirmed a sell signal on the daily chart below, signaling a heavy upside likely to extend the pullback. A sell signal manifests with the MACD line (blue) crossing beneath the signal line (red).
The downward trending Relative Strength Index (RSI) indicator at 51 reflects XRP’s correction from recent highs. If XRP drops below the initial support at $2.26, the RSI could fall under the 50 midline, indicating stronger bearish momentum.
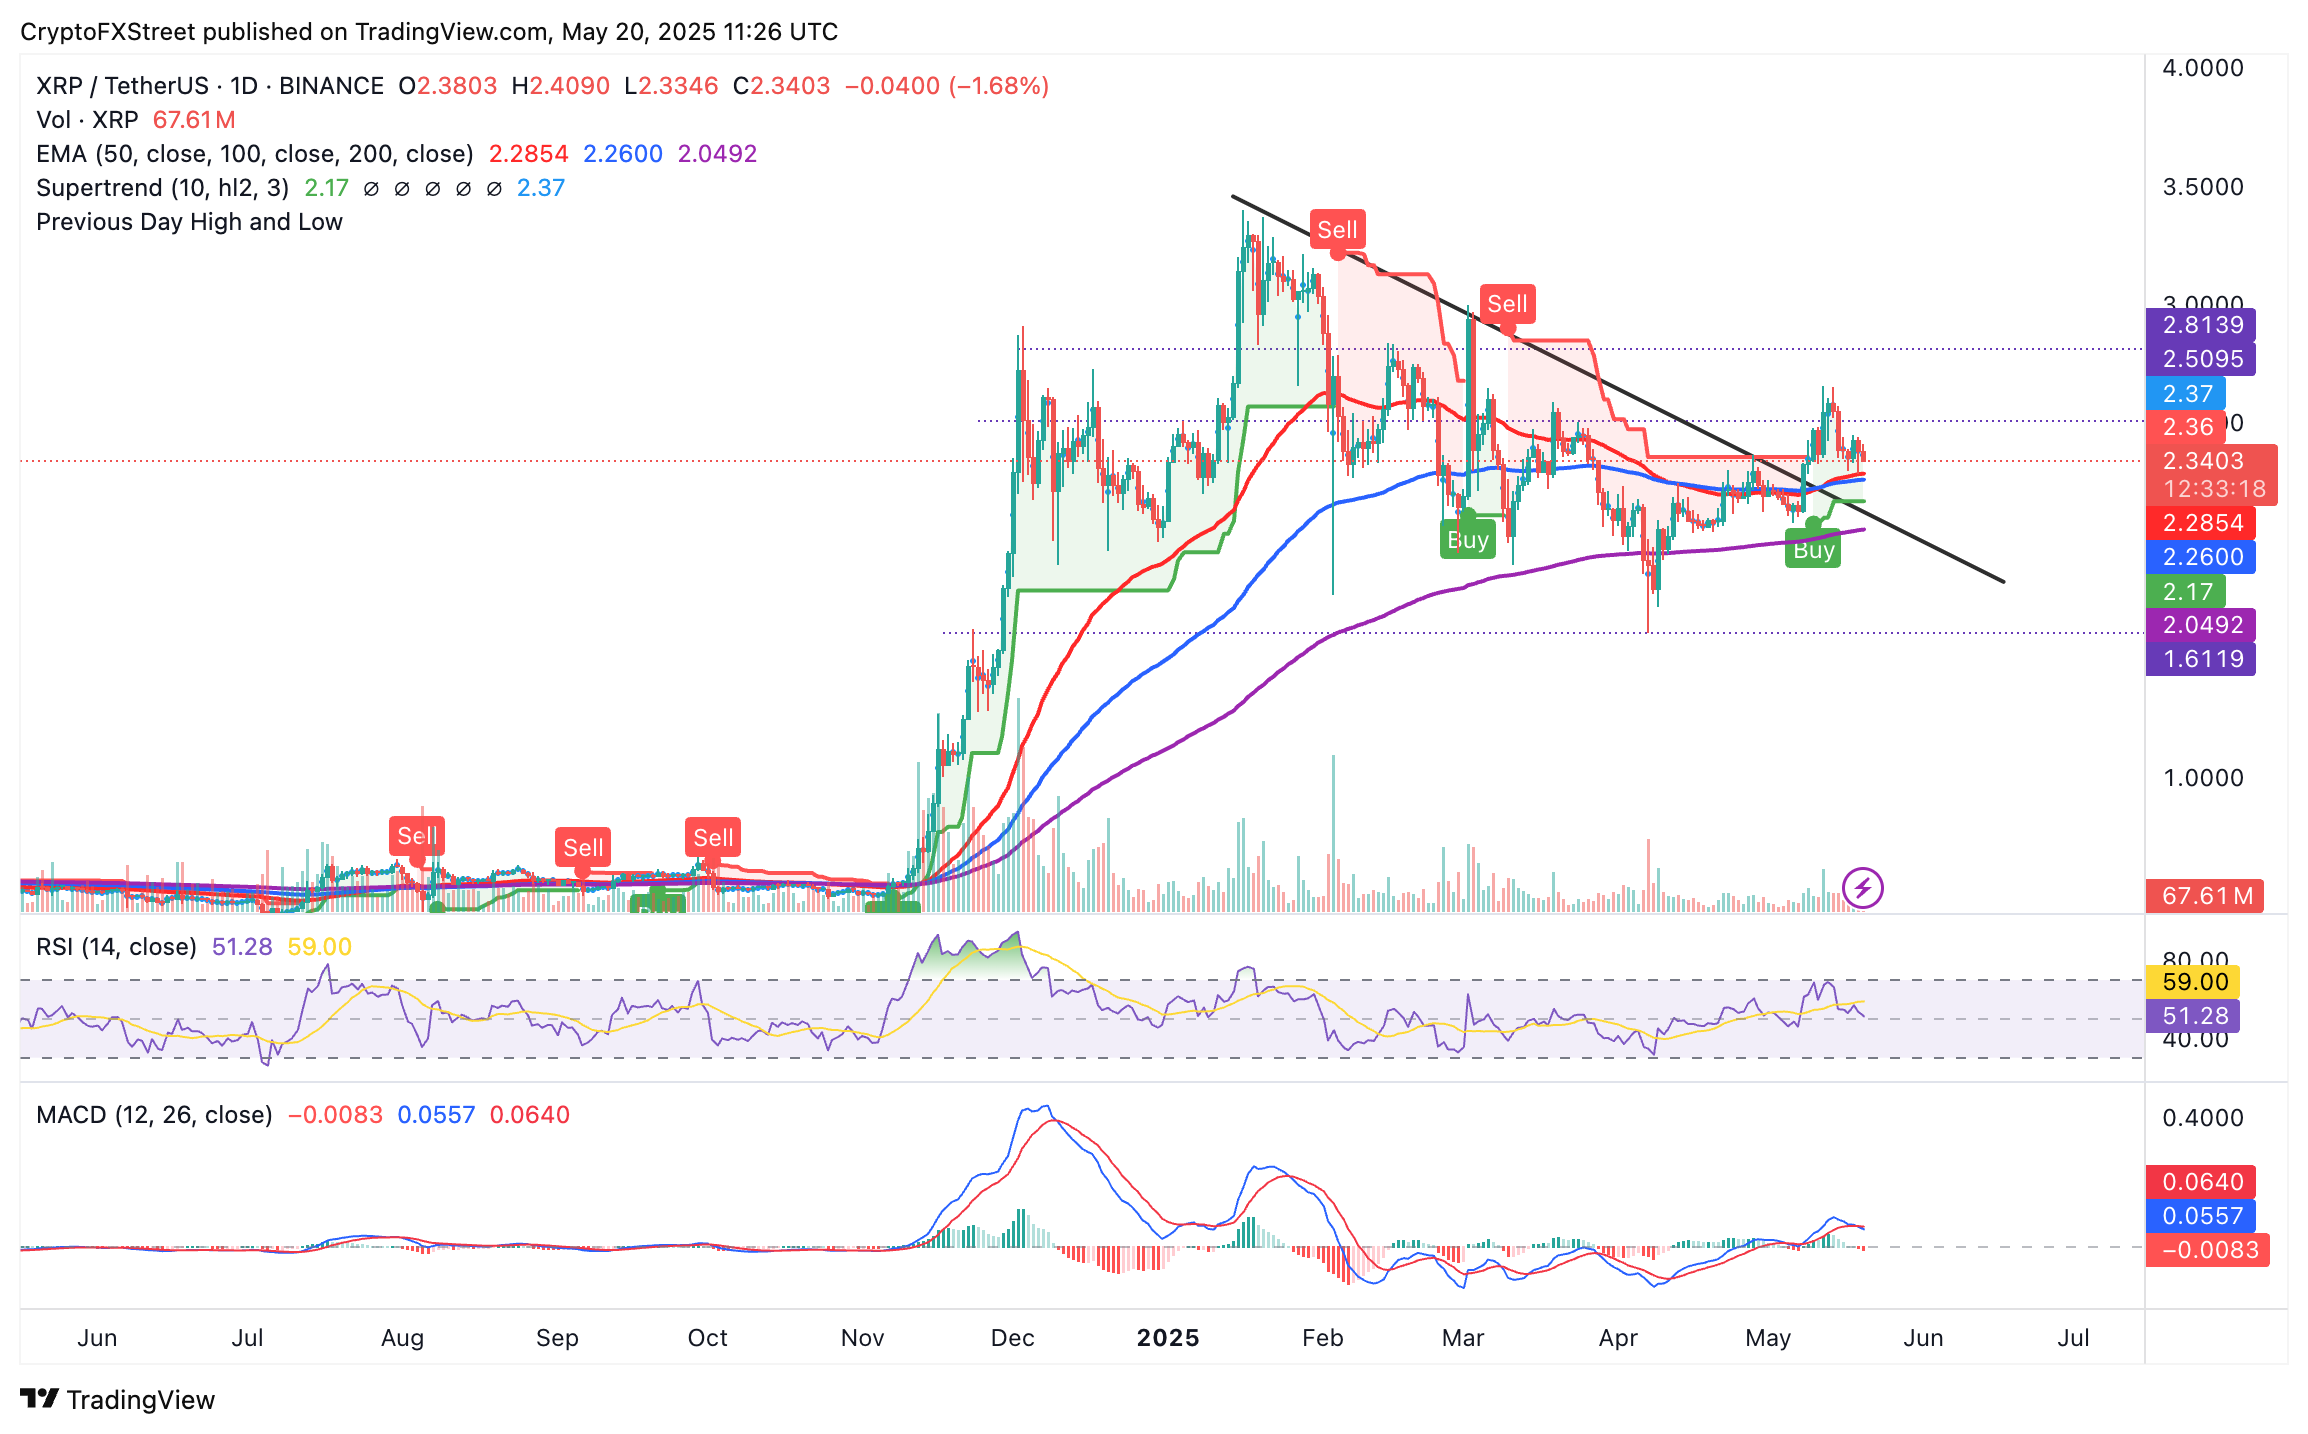
XRP/USD daily chart
On the other hand, the SuperTrend indicator flaunts a buy signal, defying the ongoing drop in the price of XRP. This indicator utilises the Average True Range (ATR) to gauge volatility in the market. It can be used as a dynamic support and resistance line as it sends a buy signal when the price flips above the SuperTrend line and changes its colour from red to green.
It depends on the transaction, according to a court ruling released on July 14, 2023:
For institutional investors or over-the-counter sales, XRP is a security.
For retail investors who bought the token via programmatic sales on exchanges, on-demand liquidity services and other platforms, XRP is not a security.
The United States Securities & Exchange Commission (SEC) accused Ripple and its executives of raising more than $1.3 billion through an unregistered asset offering of the XRP token.
While the judge ruled that programmatic sales aren’t considered securities, sales of XRP tokens to institutional investors are indeed investment contracts. In this last case, Ripple did breach the US securities law and had to pay a $125 million civil fine.
The ruling offers a partial win for both Ripple and the SEC, depending on what one looks at.
Ripple gets a big win over the fact that programmatic sales aren’t considered securities, and this could bode well for the broader crypto sector as most of the assets eyed by the SEC’s crackdown are handled by decentralized entities that sold their tokens mostly to retail investors via exchange platforms, experts say.
Still, the ruling doesn’t help much to answer the key question of what makes a digital asset a security, so it isn’t clear yet if this lawsuit will set precedent for other open cases that affect dozens of digital assets. Topics such as which is the right degree of decentralization to avoid the “security” label or where to draw the line between institutional and programmatic sales persist.
The SEC has stepped up its enforcement actions toward the blockchain and digital assets industry, filing charges against platforms such as Coinbase or Binance for allegedly violating the US Securities law. The SEC claims that the majority of crypto assets are securities and thus subject to strict regulation.
While defendants can use parts of Ripple’s ruling in their favor, the SEC can also find reasons in it to keep its current strategy of regulation by enforcement.
Jakarta, Pintu News – In the first quarter of 2025, Solana recorded its best performance in 12 months with total app revenue reaching $1.2 billion. This marks a 20% increase from the previous quarter’s $970.5 million.
With this significant growth, many are wondering if Solana will be able to break the $200 price in the near future.
In January 2025, Solana (SOL) accounted for almost 60% of the quarter’s total revenue, making it the most profitable month.
Read also: Ethereum Just Surged 7% — Is This the Start of a Massive Breakout?
Pump.fun, a meme coin launch platform, led the way with $257 million in revenue, followed by Phantom wallet which generated $164 million. This increase reflects the broader positive momentum for the Solana network itself, which has seen its token price rise from a low range of $95 to near $173 in recent months.
Solana’s recent price rise is showing some positive signs, with the cryptocurrency managing to recover after dropping to around $164. Fundamentals remain strong, supported by solid economic activity and one of the best weeks for trading volumes since February, despite a drop in volumes on the DEX.
Rapid growth and increased transaction volumes on the Solana network have led to congestion, similar to previous occurrences in late 2023 and early 2024, resulting in slower transaction speeds and higher fees.
To address these scalability challenges, the development of a Layer 2 blockchain called Solaxy (SOLX) is underway. Solaxy is designed for infinite scalability and cross-chain compatibility, aiming to reduce network congestion while maintaining the viral appeal of meme coins.
Pre-sales have raised over $37 million, indicating continued strong interest even as overall market conditions remain challenging.
As a scalability solution designed to prevent overloading the Solana blockchain during the launch of meme tokens, Solaxy addresses a critical need in the ecosystem, making it an attractive project for investors who see a future for Solana-based tokens.
Read also: PEPE Whale Returns With a Splash, Moves $29 Million in Tokens From Binance!
With growing adoption and utility, Solana blockchain has the potential to further strengthen its position as a leading altcoin platform, attracting more investors. To participate in the $SOLX token pre-sale, visit solaxy.io.
Tokens will be tradable on centralized and decentralized exchanges after the pre-sale, with hopes for listing on leading platforms to increase liquidity and exposure.
The combination of strong DApp performance, growing institutional interest, and ongoing infrastructure improvements such as Solaxy’s Layer 2 solution suggests that Solana is positioned for continued growth and relevance among altcoins.
Overall, with all these indicators, Solana (SOL) shows potential not only as a major player in the cryptocurrency world but also as an innovator in addressing the scalability issues faced by many blockchains today.
That’s the latest information about crypto. Follow us on Google News to stay up-to-date on the world of crypto and blockchain technology.
Enjoy an easy and secure crypto trading experience by downloading Pintu crypto app via Google Play Store or App Store now. Get a web trading experience with advanced trading tools such as pro charting, various types of order types, and portfolio tracker only at Pintu Pro. Pintu Pro Futures is also available, where you can buy bitcoin leverage, trade btc futures, eth futures and sol futures easily from your desktop!
*Disclaimer
This content aims to enrich readers’ information. Pintu collects this information from various relevant sources and is not influenced by outside parties. Note that an asset’s past performance does not determine its projected future performance. Crypto trading activities have high risk and volatility, always do your own research and use cold cash before investing. All activities of buying and selling bitcoin and other crypto asset investments are the responsibility of the reader.
Reference:
The Ethereum price today is trading around $2,542 after failing to break above the $2,588 intraday high. Despite last week’s sharp upside rally that sent ETH soaring above $2,500 for the first time in over a month, however the recent Ethereum price action signals a near-term pause as bulls struggle with overhead resistance. The market has now entered a key zone between the $2,520–$2,600 range, where several technical indicators suggest a cooling of bullish momentum.
Looking at the 30-minute and 4-hour charts, ETH remains within a tight consolidation channel. On the 4H timeframe, price is testing the upper trendline of a descending wedge while staying above major support at $2,439.36. The lower boundary of this range coincides with the previous breakout zone, indicating that bulls may defend this area aggressively.
The Ethereum price update reflects muted volatility as Bollinger Bands begin to narrow, suggesting a potential breakout in either direction. Meanwhile, the 4-hour MACD is showing a weak crossover with fading bullish histograms. RSI on the 30-min chart is hovering near 54.8, reflecting a neutral stance, while Stoch RSI on lower timeframes has crossed below 50, hinting at waning short-term momentum.
The recent Ethereum price spikes came as a result of a clean breakout from a long-term descending trendline visible on the daily chart, where ETH surged nearly 20% from its base near $2,200. However, the current hesitation is primarily due to resistance near the 0.382 Fibonacci retracement level ($2,745) from the November 2024 high to the March 2025 low.
On the weekly chart, the Ethereum price remains bullish above the $2,450 pivot zone, but further upside is constrained unless bulls can decisively reclaim $2,600. Chande Momentum Oscillator shows a slight bearish divergence on the 30-minute timeframe, which could explain the stall.
The 30-minute chart shows ETH caught between $2,520 support and $2,580 resistance. A break above this band could trigger a retest of $2,606—the trendline high from the descending wedge. Should bulls lose momentum, immediate support lies at $2,439, followed by $2,410 and deeper Fibonacci retracements near $2,220.
Interestingly, on the daily chart, ETH still trades within a broader ascending structure that began in early May. As long as Ethereum price today holds above $2,500, this formation remains intact.
From a short-term perspective, price is likely to remain volatile heading into May 21. The Ethereum price volatility has compressed on lower timeframes, hinting at a potential breakout.
With multiple indicators showing conflicting signals, traders should be prepared for heightened intraday volatility. Watch RSI behavior on 1H and 4H charts, MACD crossovers, and price reaction near $2,600 to assess breakout strength.
| Indicator / Zone | Level (USD) | Signal |
| Resistance 1 | 2,600 | Breakout trigger zone |
| Resistance 2 | 2,745 | Fib 0.382, key ceiling |
| Support 1 | 2,439 | Short-term holding zone |
| Support 2 | 2,220 | Base of prior breakout zone |
| 4H RSI | 54.82 | Neutral-Bullish |
| 30-min MACD | Fading Bullish | Weak momentum |
| Bollinger Band Width | Narrow | Volatility expansion ahead |
| Trend Bias (Short-Term) | Bullish Above $2,500 | Conditional |
The current Ethereum price update suggests a tug-of-war between profit-taking and continuation momentum. Until ETH decisively clears $2,600, price action may remain rangebound with intraday swings defining near-term opportunities.
Disclaimer: The information presented in this article is for informational and educational purposes only. The article does not constitute financial advice or advice of any kind. Coin Edition is not responsible for any losses incurred as a result of the utilization of content, products, or services mentioned. Readers are advised to exercise caution before taking any action related to the company.
Dogecoin surpassed $0.18 to create bullish signs in the crypto markets and achieved an 11.65% boost within 24 hours that intrigued traders. An analyst named Javon Marks predicts Dogecoin will reach $1.25 in 2025 according to his market forecast which far exceeds its present trading value of $0.1828. The meme coin must break through the strong $0.20 resistance level to achieve its goal of a 100x increase depending on Bitcoin price trends and investor enthusiasm.
Elsewhere, the Mutuum Finance (MUTM) phase 4 presale has become very popular as it successfully raises $7.3 million by selling more than 425 million tokens. Dogecoin seems to face stiff competition from Mutuum Finance (MUTM) which gains spotlight through its successful presale phases. The market movement creates room to assess these assets.
Dogecoin jumps forward from its previous price low of $0.1316 as it displays fresh market robustness. Its two bullish candlesticks on the 5-day chart hint at a potential 279% jump to $0.6533 per Marks’ analysis. The previous breakout led to a 500% rally in historical price patterns that back up this evaluation. Still the $0.20 barrier looms large. The price needs strong market demand to surpass $90,000 as Bitcoin holds above $90,000.
The 100x growth target for Dogecoin becomes improbable when market tailwinds become extinguished. Due to its speculative risk investors search for practical alternatives instead of Dogecoin. The desire to understand has naturally resulted in projects such as Mutuum Finance (MUTM) which launch due to their foundational value.
The fourth phase of Mutuum Finance (MUTM) presale offers tokens at $0.025 while creating intense market excitement. The project demonstrates relentless growth through $7.3 million in funding and acquisition of more than 9,200 holders.
The next phase 5 presale opening will increase MUTM token value by 20% to $0.03 which will generate a beneficial impact for existing buyers. Investors can expect up to 9,900% profit when Mutuum Finance (MUTM) reaches a listing price of $0.06 after securing a 140% return on the current $0.025 token buying price.
Recent team decisions introduced a ranking dashboard for the top 50 holders where participants earn bonus tokens based on their position which results in deep competitive competition. Investors show increasing sense of urgency because phase 4 is approaching its selling capacity.
Mutuum Finance (MUTM) strengthens trust by subjecting its smart contract to auditors from Certik. After the finalization they will launch the news throughout their social networks to reinforce confidence in the community. The DeFi lending features of the project together with its focus on liquidity and passive income mark it apart from speculative cryptocurrencies including Dogecoin. Through its distribution process Mutuum Finance (MUTM) has created a consistent market demand that attracts investors who prefer long-term investments.
MUTM stands out from Dogecoin by aligning with a structured approach while Dogecoin depends entirely on market forces hence MUTM appears as a strong selection option. Market investors hurry to obtain tokens because they expect future price appreciation.
Dogecoin operates with a fragile market mechanism to reach 100x while Mutuum Finance (MUTM) provides predictable high returns to investors. Meme coin enthusiasts perceive $1.25 as an attractive price goal for 2025 yet this expectation remains unstable due to Bitcoin’s market course.
Beneficiaries of Mutuum Finance (MUTM) gain transparency from tokenomics that incorporates practical application and experienced 140% value growth initially with potential to reach 9,900% post-consultation. Mutuum Finance (MUTM) presents traders with an opportunity through its presale that rings as a powerful warning.
For more information about Mutuum Finance (MUTM) visit the links below:
Website: https://www.mutuum.finance/
Linktree: https://linktr.ee/mutuumfinance
Disclaimer: For information purposes only. Past performance is not indicative of future results.
Cardano has taken a major step toward mainstream Web3 integration through a newly announced partnership between Input Output Global (IOG) and Brave, the privacy-focused browser known for its built-in Web3 wallet.
The collaboration will see Cardano integrated directly into the Brave Wallet, allowing millions of users to access the Cardano blockchain seamlessly for native token management, on-chain swaps, and governance participation.
This move significantly expands Brave’s multi-chain functionality—already supporting networks like Ethereum and Solana—while positioning Cardano for broader adoption.
Through this integration, Brave users will be able to interact with the Cardano network securely and privately from within the browser, including transacting with ADA, engaging in on-chain governance, and managing native assets like the upcoming privacy-oriented Midnight (DUST) token.
The partnership is also supported by a wider marketing push from IOG, including increased advertising for Cardano initiatives across Brave’s platform. One highlighted campaign focuses on Cardano’s new governance era, encouraging users to submit proposals and participate in shaping the network’s future direction.
With major developments such as the Midnight sidechain, Hydra Layer 2 scaling, and the upcoming Leios (L1 scaling) upgrade in the pipeline, the Brave integration adds a much-needed marketing and accessibility layer to Cardano’s highly secure and scalable blockchain technology.
This strategic alliance marks a significant milestone in Cardano’s mission to expand its reach and user engagement across the decentralized web.
Source – LuckSide Crypto on YouTube
Cardano is currently showing technical signals that could indicate a promising shift in momentum despite broader market uncertainties. While some analysts have raised alarms about a possible “death cross”, such short-term crossovers are generally considered unreliable indicators for long-term price direction.
In contrast, $ADA recently confirmed a golden cross on higher timeframes — a more significant bullish signal where a shorter moving average crosses above a longer one. Historically, previous golden crosses for Cardano have led to substantial price surges, with past instances resulting in gains of up to 130%.
Even the least impactful golden cross still produced a 40% rally. Moreover, $ADA has now entered the oversold zone on the stochastic relative strength index (RSI). The last time Cardano reached this level, it rallied roughly 30% shortly afterward.
While immediate movement isn’t guaranteed, these conditions often precede upward momentum. Additional indicators, such as a shift in the traditional RSI, could further support a recovery.
Cardano’s ability to move independently from Bitcoin has been observed in past cycles, but current retail sentiment may require a broader market lift — particularly from Bitcoin and Ethereum — to catalyze a sustained rally.
A recent sell-off in Ethereum interrupted $ADA’s short-term progress, illustrating how intertwined altcoin movements can be with larger-cap assets. Still, Cardano remains in a technically strong position, with multiple signals aligning for a potential breakout if market conditions cooperate.
MIND of Pepe (MIND) is making waves in the crypto space by combining two of the most dominant narratives in the market today—AI technology and meme coin culture.
This innovative ERC-20 token is quickly gaining popularity thanks to its unique concept and rapidly growing presale, which has already raised near $10 million.
Its appeal lies in the way it merges the viral energy of meme coins with the futuristic utility of artificial intelligence, offering something far beyond the typical speculative hype. What sets MIND of Pepe apart is its core feature: a self-evolving AI agent that actively engages with platforms like X (formerly Twitter).
This AI isn’t a passive tool—it has its own digital presence, interacting with influencers, sharing insights about the meme coin market, and sparking conversations that help boost its visibility.
Over time, this AI gains popularity organically by becoming a recognizable and influential figure in the online crypto community. More than just an engaging social presence, the MIND of Pepe ecosystem brings tangible benefits to its community.
$MIND token holders receive exclusive insights generated by the AI agent and even get early access to new tokens created by the AI itself. This built-in utility offers a unique advantage in a market often dominated by hype without substance.
Furthermore, only holders of $MIND tokens are allowed to stake and earn rewards, with the current estimated annual percentage yield (APY) reaching an impressive 237%—though this rate is decreasing as more participants join in.
This mechanism creates a sense of urgency for early investors, while reinforcing the idea that the project is designed for consistent growth rather than short-term pumps. The project also stands out for its structured tokenomics and timed price increases.
The presale token price, currently around $0.00375, is available for purchase using crypto through the Best Wallet app—but with just 11 days remaining before the presale closes, time is running out to get in early.
With nearly $1 billion in AI agent development and over $8 billion in meme coin trading activity across the broader market, MIND of Pepe is strategically positioned to capture attention from both communities.
It’s not just another meme coin riding the Pepe trend—it’s a forward-thinking platform blending entertainment, passive income potential, and advanced technology.
As more eyes turn toward AI-integrated crypto projects, MIND of Pepe may very well establish itself as one of the standout tokens of this cycle. To take part in the $MIND token presale, visit mindofpepe.com.
This article has been provided by one of our commercial partners and does not reflect Cryptonomist’s opinion. Please be aware our commercial partners may use affiliate programs to generate revenues through the links on this article.
XRP price saw massive growth from November 2024 to January 2025, but could the asset replicate this run in the foreseeable future?
The crypto market has come to a halt following the massive uptrend witnessed between November 2024 and January 2025 on the back of Donald Trump’s victory in the latest U.S. presidential election.
While the market has witnessed occasional upswings since then, like the one observed from early to mid-May, none have equaled the November 2024 to January 2025 run. Interestingly, XRP, which saw extensive price suppression throughout 2024, was one of the biggest beneficiaries of this rally.
For context, the asset began November 2024 with a price of $0.50 but rallied by a massive 283% that month alone. This represented its largest monthly gain since December 2017, seven years ago.
However, XRP’s upsurge did not end with the 283% rise in November 2024. The asset witnessed an additional 6.43% gain in December 2024 and soared to a peak of $3.4 in January 2025. Overall, the rally from $0.50 to $3.4 marked a staggering 580% gain within three months.

Since hitting the resistance at $3.4, the XRP price has corrected to trade below the psychological mark of $3. Despite the bearish pressure in the broader market, the asset maintains the $2 price mark as support, awaiting another upsurge to secure more gains.
As a result, multiple analysts have projected ambitious price targets for XRP in the coming months. For instance, an XRP community figure and researcher, Rob Cunningham, recently suggested XRP could claim a $5 to $15 price range in the short term. Last month, an Elliott Wave expert predicted an XRP breakout to $10.
While market participants are confident that some of these targets are feasible in the current cycle, they remain pessimistic about other, more ambitious goals. Nonetheless, given its ability to soar 580% from November 2024 to January 2025, XRP has the potential to repeat this run at least before the bull run ends.
With XRP price currently at $2.34, another 580% increase from this level would clearly lead to a new all-time high for the asset. Specifically, if XRP rallied 580% from the current price, its value would skyrocket to $15.9, approximately $16. This aligns with Cunningham’s short-term target.
Interestingly, last October, before the initial 580% uptick, market analyst Lud predicted XRP to reach $16, citing the 2017 fractal. Also, within the same month, another analyst EGRAG Crypto projected a possible XRP rally to targets such as $9.3 and $16, leveraging a standard deviation model.
Meanwhile, analysts at Changelly, a crypto exchange platform, believe the XRP price could reach the $16 mark, but only in 2029, four years later. However, Telegaon experts see the $16 target materializing sooner, specifically in 2027, two years from now.

DisClamier: This content is informational and should not be considered financial advice. The views expressed in this article may include the author’s personal opinions and do not reflect The Crypto Basic opinion. Readers are encouraged to do thorough research before making any investment decisions. The Crypto Basic is not responsible for any financial losses.
A new week has started with the cryptocurrency market’s drop, according to CoinStats.CoinStats”>
The price of Bitcoin ![]() BTCUSD has fallen by 1.43% over the last 24 hours.TradingView”>
BTCUSD has fallen by 1.43% over the last 24 hours.TradingView”>
On the hourly chart, the rate of BTC has bounced off the local support of $102,126. If bulls’ pressure continues, one can expect a test of the resistance by tomorrow.TradingView”>
On the bigger time frame, buyers have failed to keep the growth going after yesterday’s bullish bar closure. As most of the ATR has been passed, there are low chances of seeing sharp moves.
In this case, sideways trading in the area of $102,000-$105,000 is the most likely scenario.TradingView”>
From the midterm point of view, none of the sides is dominating as the rate is far from key levels. Thus, the volume is low, confirming the absence of buyers and sellers’ energy. All in all, there are low chances of seeing sharp ups or downs anytime soon.
Bitcoin is trading at $104,377 at press time.
Despite its current lackluster price action, many crypto analysts have agreed through various analyses over the past few years that XRP has a very bright parabolic rally ahead. This sentiment has particularly gained ground due to its price action in Q4 2024, leading to a multi-year high of $3.34 in January 2025.
Although XRP has retraced quite a bit from this high, this hasn’t stopped bold long-term projections from resurfacing. One of the more striking forecasts comes from a crypto analyst who believes the altcoin will not only rally into double digits soon but eventually stabilize at $1,000 and become one of the most expensive digital assets in the world.
Analyst Predicts The Altcoin Will Hit $10 To $20 Before Entering New Bear Market
Crypto market commentator BarriC shared a post on social media platform X outlining a future price trajectory for XRP that begins with a major surge in the coming months. BarriC’s post begins by criticizing the perception that the current price range, which remains below $3, reflects failure. Instead, he views this phase as an accumulation opportunity before a massive breakout.
According to the analyst, there’s a high possibility that the XRP price will climb to somewhere between $10 and $20 in the next few months. Such a move would undoubtedly be accompanied by a surge in the trading volume and activity surrounding XRP. One such primer is if the cryptocurrency somehow gains full utility and adoption with banks in the next few months, or through the launch of a Spot XRP ETF. This surge, BarriC noted, would likely coincide with the final stages of the current altcoin season.
Following that, he expects a significant market correction, similar to past cycles, which would bring XRP back down to the $5 to $10 range. Previous cycles dating back to 2016 have typically ended with a sharp 50% market dip. If this happens again, the lower boundary for the next cycle could land between $5 and $10. This mid-cycle dip, according to BarriC, will be the last time XRP is considered cheap before it enters a fundamentally different phase.
Banks And Institutional Adoption To Tie Up XRP At $1,000 Permanently
BarriC’s prediction is ultimately based on banks’ mass institutional adoption of XRP. He noted that when the asset becomes deeply integrated into the daily operations of banks and financial institutions, we will see a $1,000 XRP. Once trillions of dollars begin flowing consistently through the XRP Ledger, there will be no more volatility and bear market phases for its price.
At that point, BarriC believes the altcoin will stabilize at a $1,000 valuation, not as a temporary peak but as a structural price floor. In this case, future investors may only be able to afford fractions of one XRP, much like Bitcoin currently.
At the time of writing, XRP is trading at $2.30, down by 2.35% in the past 24 hours. XRP has been steadily declining from $2.62 in the past seven days.
Key points:
Bitcoin’s rejection at $107,000 shows sellers are active at higher levels, but the recovery from the intraday low shows solid buying.
Strategy and Metaplanet continue to accumulate Bitcoin, adding steady buy-side pressure to BTC price.
Select altcoins have pulled back, but they have not yet turned negative.
Bitcoin’s BTCUSD attempt to challenge the all-time high faced a strong rejection near $107,100 on May 19, signaling that the bears are unlikely to give up without a fight. However, the long tail on the candlestick shows solid buying at lower levels.
The short-term uncertainty has not deterred the long-term buyers from accumulating more Bitcoin. Strategy, formerly MicroStrategy, announced the purchase of 7,390 Bitcoin for an average price of about $103,500, taking its total holding to 576,230 Bitcoin.
Similarly, Japanese investment firm Metaplanet said on May 19 it acquired 1,004 Bitcoin, boosting its total to 7,800 Bitcoin.

Although Bitcoin’s trend remains bullish, repeated failure to break above the overhead resistance may tempt short-term traders to book profits. That increases the risk of a break below the psychological level of $100,000.
What are the crucial support and resistance levels to watch out for in Bitcoin and altcoins? Let’s analyze the charts of the top 10 cryptocurrencies to find out.
S&P 500 Index price prediction
The S&P 500 Index (SPX) extended its up move last week, indicating continued buying by the bulls.

The upsloping 20-day exponential moving average (5,712) and the relative strength index (RSI) near the overbought zone signal an advantage to buyers, but the up move is expected to face significant resistance in the 6,000 to 6,147 zone.
If the price turns down from the overhead zone, the index could find support at 5,800 and then at the 20-day EMA. If the price rebounds off the 20-day EMA, the bulls will again try to drive the index to the all-time high. Sellers will have to tug the price below the 20-day EMA to break the bullish momentum.
US Dollar Index price prediction
The relief rally in the US Dollar Index (DXY) hit a wall at the 50-day simple moving average (101.67) on May 12, indicating that the bears are selling on rallies.

The index is likely to find support at the 100.27 level. If the price rebounds off 100.27, the bulls will again try to kick the index above the 50-day SMA. If they manage to do that, the index could pick up momentum and surge toward 103.54. Such a move signals that the corrective phase may be over.
Sellers will retain the advantage if the price closes below the 100.27 support. That opens the doors for a retest of the 99 level.
Bitcoin price prediction
Bitcoin broke above the overhead resistance at $105,820 on May 18, but the bulls could not sustain the momentum.

Sellers are expected to fiercely defend the zone between $107,000 and $109,588. The 20-day EMA ($100,787) is the crucial support to watch out for on the downside. A rebound off the 20-day EMA suggests the positive sentiment remains intact. The bulls will again try to clear the overhead zone. If they succeed, the ![]()
![]() BTCUSDT pair could skyrocket toward $130,000.
BTCUSDT pair could skyrocket toward $130,000.
This positive view will be invalidated in the near term if the price continues to fall and breaks below the psychologically crucial $100,000 support. The pair could then plummet to the 50-day SMA ($91,916).
Ether price prediction
Ether’s ![]() ETHUSD bounce off the 20-day EMA ($2,288) on May 18 fizzled out near $2,600, signaling that the bears have kept up the pressure.
ETHUSD bounce off the 20-day EMA ($2,288) on May 18 fizzled out near $2,600, signaling that the bears have kept up the pressure.

Sellers tried to pull the price below the 20-day EMA, but the long tail on the candlestick shows solid buying at lower levels. The bulls will try to kick the price above the $2,738 resistance, opening the gates for a rally to $3,000. There is minor resistance at $2,850, but it is likely to be crossed.
Contrarily, a break and close below the 20-day EMA tilts the advantage in favor of the bears. The ![]()
![]() ETHUSDT pair could then slump to $2,111.
ETHUSDT pair could then slump to $2,111.
XRP price prediction
XRP ![]() XRPUSD remains stuck inside the $2.65 to $2 range, indicating buying near the support and selling close to the resistance.
XRPUSD remains stuck inside the $2.65 to $2 range, indicating buying near the support and selling close to the resistance.

The ![]()
![]() XRPUSDT pair bounced off the 20-day EMA ($2.34) on May 17, but the bulls are facing selling at higher levels. If the price sustains below the 20-day EMA, the pair could stay inside the range for some more time. The price action inside the range is expected to be random and volatile.
XRPUSDT pair bounced off the 20-day EMA ($2.34) on May 17, but the bulls are facing selling at higher levels. If the price sustains below the 20-day EMA, the pair could stay inside the range for some more time. The price action inside the range is expected to be random and volatile.
The next trending move is likely to begin on a break above $2.65 or below $2. If buyers pierce the $2.65 resistance, the pair could travel to $3.
BNB price prediction
BNB ![]() BNBUSD bounced off the 20-day EMA ($635) on May 18, but the higher levels attracted selling by the bears.
BNBUSD bounced off the 20-day EMA ($635) on May 18, but the higher levels attracted selling by the bears.

The gradually upsloping 20-day EMA and the RSI in the positive territory indicate a slight edge to the bulls. If the price rises and maintains above $644, the bulls will again try to drive the ![]()
![]() BNBUSDT pair above $680. If they succeed, the pair may start its northward march toward the overhead resistance of $745.
BNBUSDT pair above $680. If they succeed, the pair may start its northward march toward the overhead resistance of $745.
Contrary to this assumption, a break and close below the 20-day EMA clears the path for a decline to the 50-day SMA ($606) and later to $580.
Solana price prediction
Solana ![]() SOLUSD turned up from the 20-day EMA ($163) on May 17, but the bulls could not push the price above the $180 resistance.
SOLUSD turned up from the 20-day EMA ($163) on May 17, but the bulls could not push the price above the $180 resistance.

Sellers are trying to pull and retain the price below the 20-day EMA. If they manage to do that, the ![]()
![]() SOLUSDT pair could tumble to $153 and, after that, to the 50-day SMA ($143). That points to a possible range-bound action between $180 and $120 in the near term.
SOLUSDT pair could tumble to $153 and, after that, to the 50-day SMA ($143). That points to a possible range-bound action between $180 and $120 in the near term.
The bulls will have to propel the price above the $185 level to regain control. The pair could then pick up momentum and rally to $210 and subsequently to $220.
Dogecoin price prediction
Buyers successfully defended the breakout level of $0.21 on May 17 but are struggling to sustain the bounce in Dogecoin ![]() DOGEUSD.
DOGEUSD.

Sellers will try to make a comeback by pulling the price below $0.21. If they do that, the ![]()
![]() DOGEUSDT pair could slide to the 50-day SMA ($0.18). That signals a possible range formation between $0.26 and $0.14.
DOGEUSDT pair could slide to the 50-day SMA ($0.18). That signals a possible range formation between $0.26 and $0.14.
Buyers will have to thrust the price above the $0.26 resistance to signal the resumption of the recovery. There is minor resistance at $0.30, but it is likely to be crossed. The pair may then ascend to $0.35.
Cardano price prediction
Cardano (ADA) has broken below the neckline of the inverted head-and-shoulders pattern, indicating that the bulls are losing their grip.

The next support is at the 50-day SMA ($0.68). If the price turns up from the 50-day SMA, the bulls will try to push the ![]()
![]() ADAUSDT pair above the neckline. If they can pull it off, the pair could retest the $0.86 level. A break and close above the $0.86 resistance clears the path for a rally to $1.01.
ADAUSDT pair above the neckline. If they can pull it off, the pair could retest the $0.86 level. A break and close above the $0.86 resistance clears the path for a rally to $1.01.
Conversely, a break and close below the 50-day SMA suggests the markets have rejected the breakout above the neckline. That increases the risk of a drop to $0.58.
Sui price prediction
Sui’s (SUI) bounce off the 20-day EMA ($3.67) turned down from the $3.90 to $4.25 zone, indicating that the bears are active at higher levels.

The pullback could deepen if the price breaks and sustains below the 20-day EMA. If that happens, the ![]()
![]() SUIUSDT pair could skid to $3.12 and then to the 50-day SMA ($2.97).
SUIUSDT pair could skid to $3.12 and then to the 50-day SMA ($2.97).
On the contrary, if the price snaps back from the 20-day EMA and rises above $3.90, it suggests a positive sentiment. That enhances the prospects of a break above the $4.25 level. The pair could then surge to $5. Sellers are expected to fiercely defend the zone between $5 and the all-time high of $5.37.
This article does not contain investment advice or recommendations. Every investment and trading move involves risk, and readers should conduct their own research when making a decision.
Bulls have failed to keep the weekend’s rise going, and most of the coins have come back to the red zone, according to CoinMarketCap. CoinMarketCap”>
Ethereum ![]() ETHUSD is one of the biggest losers today, falling by 4.29%.TradingView”>
ETHUSD is one of the biggest losers today, falling by 4.29%.TradingView”>
On the hourly chart, the rate of ETH has made a false breakout of the local support of $2,352. However, if a bounce back does not happen, one can expect an ongoing drop to the $2,300 area.TradingView”>
On the bigger time frame, the picture is rather more bearish than bullish. At the moment, one should focus on the bar’s closure in terms of the $2,317 level.
If it breaks out, the accumulated energy might be enough for a move to the $2,200 mark.TradingView”>
A more positive picture can be seen on the weekly chart. However, it is too early to make any distant predictions, as only a few days remain until the bar’s closure. But if a breakout of the $2,608 level happens, growth may lead to a test of the $2,800-$3,000 range.
Ethereum is trading at $2,446 at press time.


 Price Prediction for May 21")


