The main tag of cryptocurrency price today Articles.
You can use the search box below to find what you need.
[wd_asp id=1]
The main tag of cryptocurrency price today Articles.
You can use the search box below to find what you need.
[wd_asp id=1]
A top market analyst has lauded the exceptional bullishness in the Dogecoin chart, predicting a quick twofold price rally.
Dogecoin may be correcting like the rest of the crypto market following last week’s rise, but this prominent market watcher is looking beyond the short-term price retracement. Specifically, Jake Wujastyk has predicted that the largest meme coin by market cap is up for a dazzling upward trend, as the chart looks nicely set up.
The analysis precedes Dogecoin’s wrong-footed start to the week. The community-driven token has dumped 7% today alone, nearly relinquishing all of its gains on the last day of the previous week.
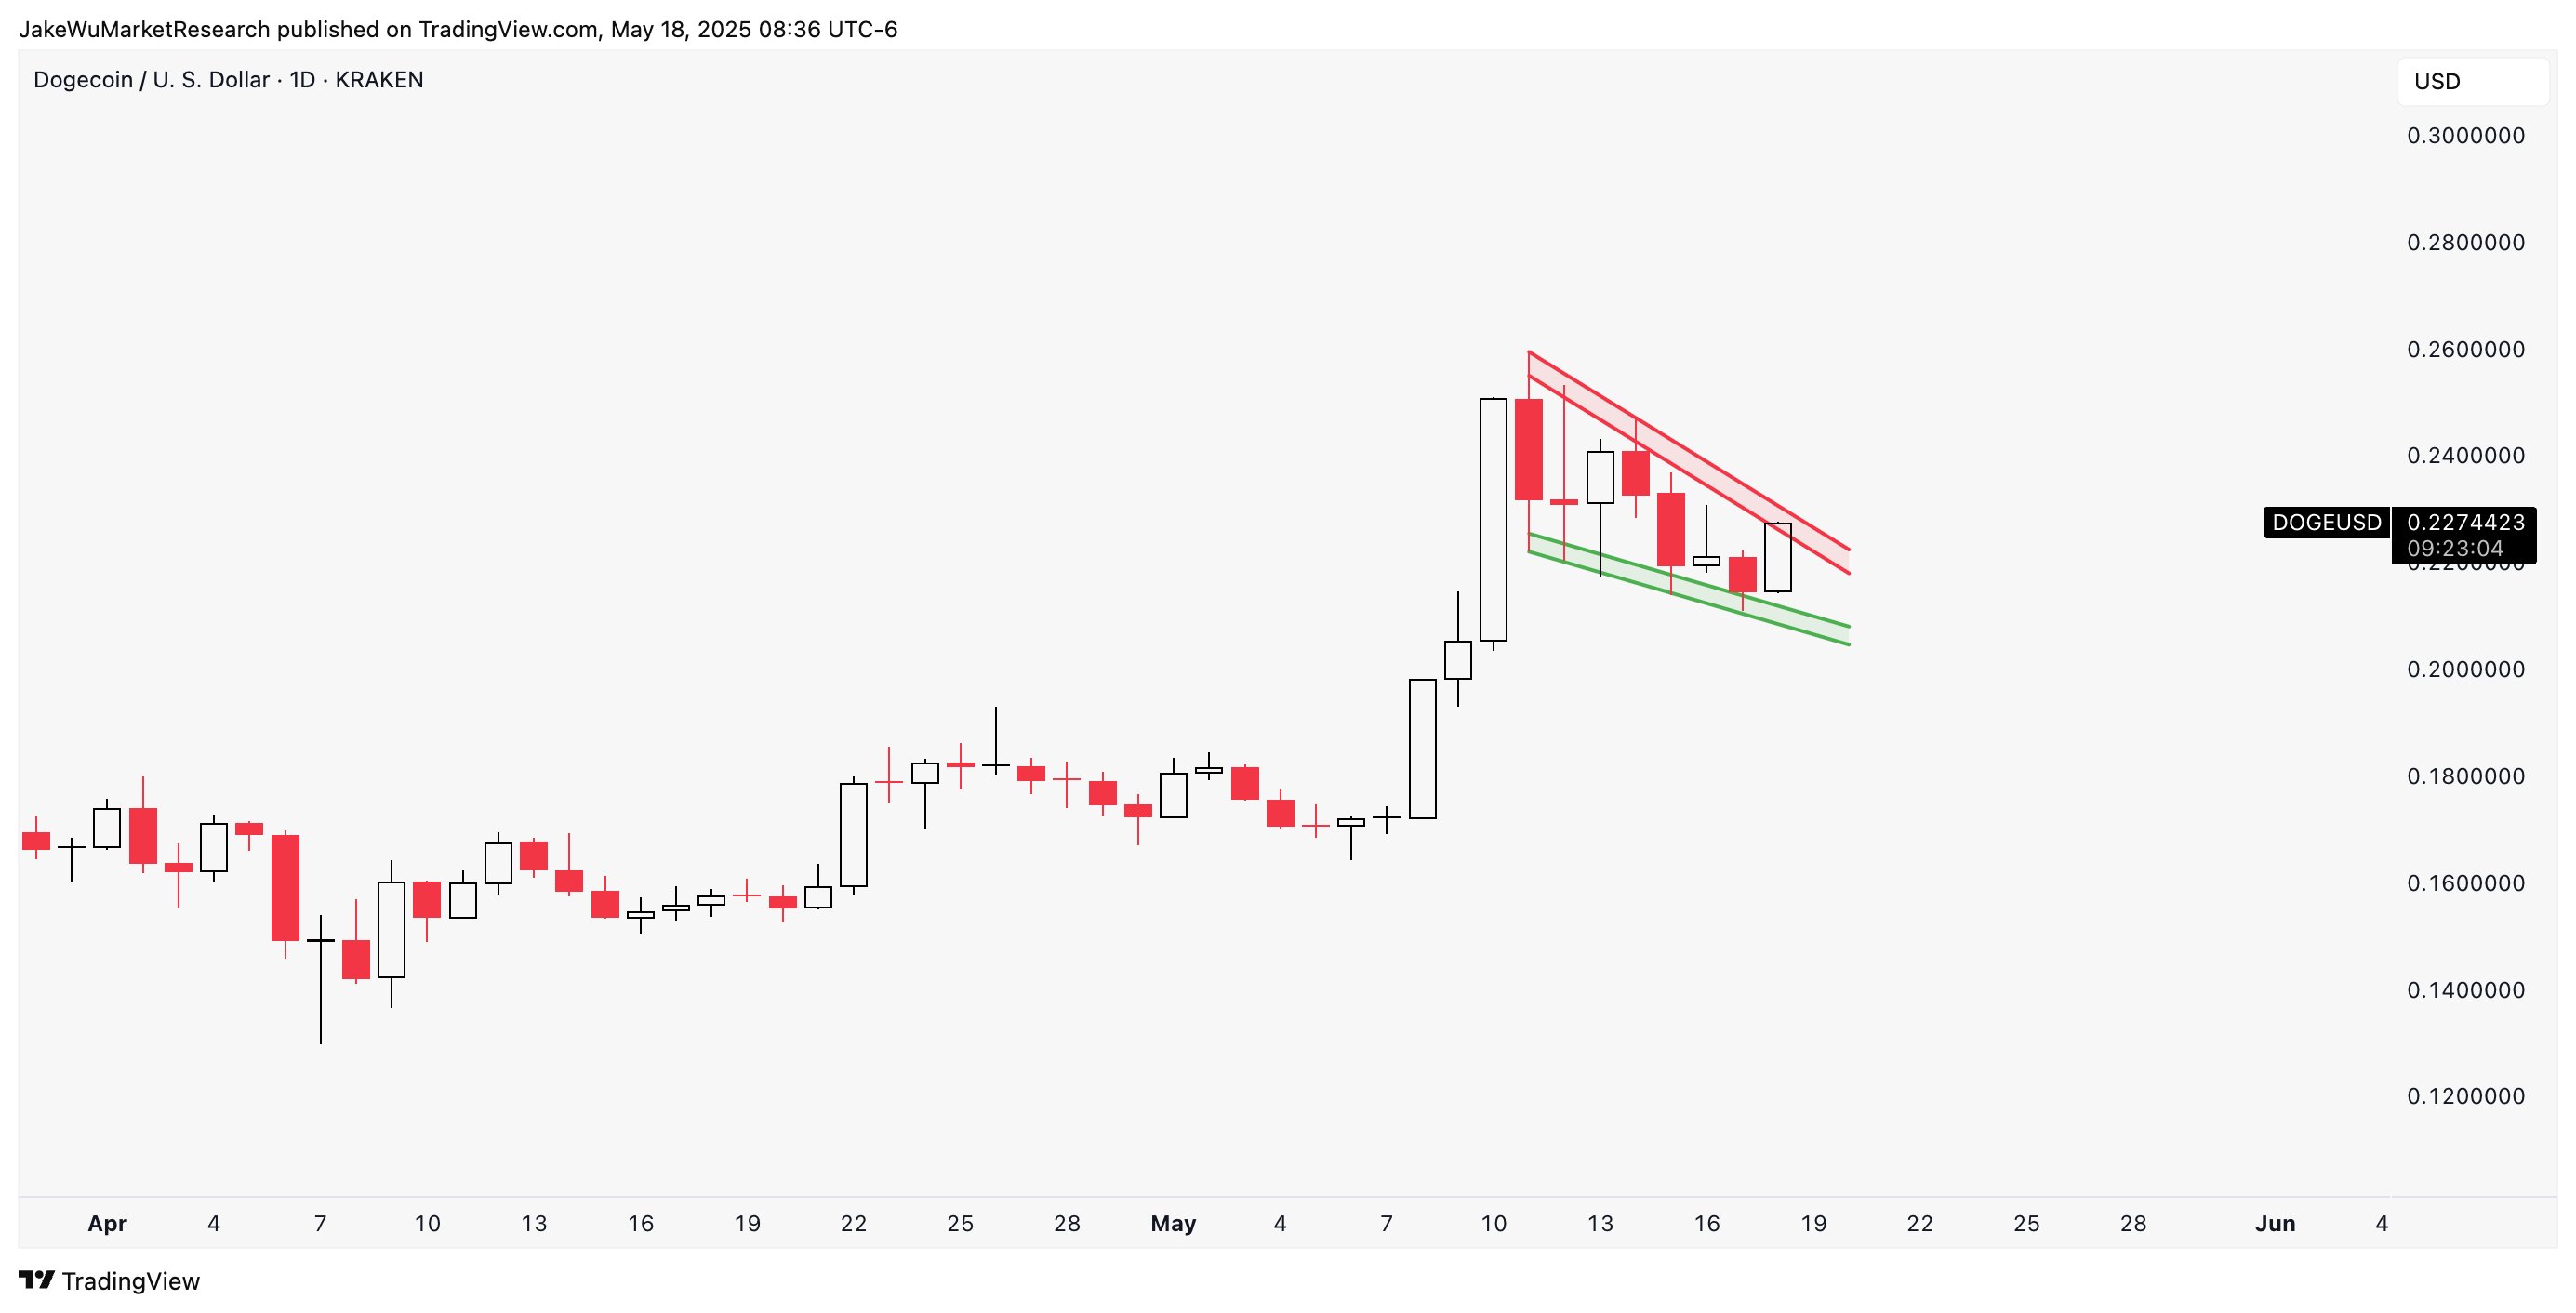
In his Sunday commentary, Wujastyk highlighted a tempting Dogecoin chart. DOGE had just rallied 8% on the day, pushing prices close to the top of a developing descending triangle.
The pattern started emerging from Dogecoin’s rally to $0.26 on May 11, with prices fluctuating between the upper resistance and lower support. Meanwhile, with the structure getting tighter, the analyst suggested that a breakout could be imminent.
According to him, there is no way one wouldn’t take a Dogecoin trade with the bullish price development. While prices have retraced slightly today, the asset still trends within the wedge, confirming the validity of the commentary.
Meanwhile, from here, Wujastyk predicted a sustained upward trajectory to higher prices. Precisely, he projected a breakout from the wedge, with an easy twofold rally to $0.45, which is about 114% away from the current prices, on the cards.
Furthermore, analyst Bitcoinsensus shares a bullish outlook and target similar to Wujastyk on Dogecoin. He stated that DOGE is on the cusp of a breakout to above 40 cents and cited a breakout to support his claims.
An accompanying elaborate chart shows that Dogecoin formed an inverse head-and-shoulders pattern dating back to March. The left shoulder formed from March 11’s low of $0.14, the head from April 7’s low of $0.13, and the right shoulder from $0.16 on May 6.
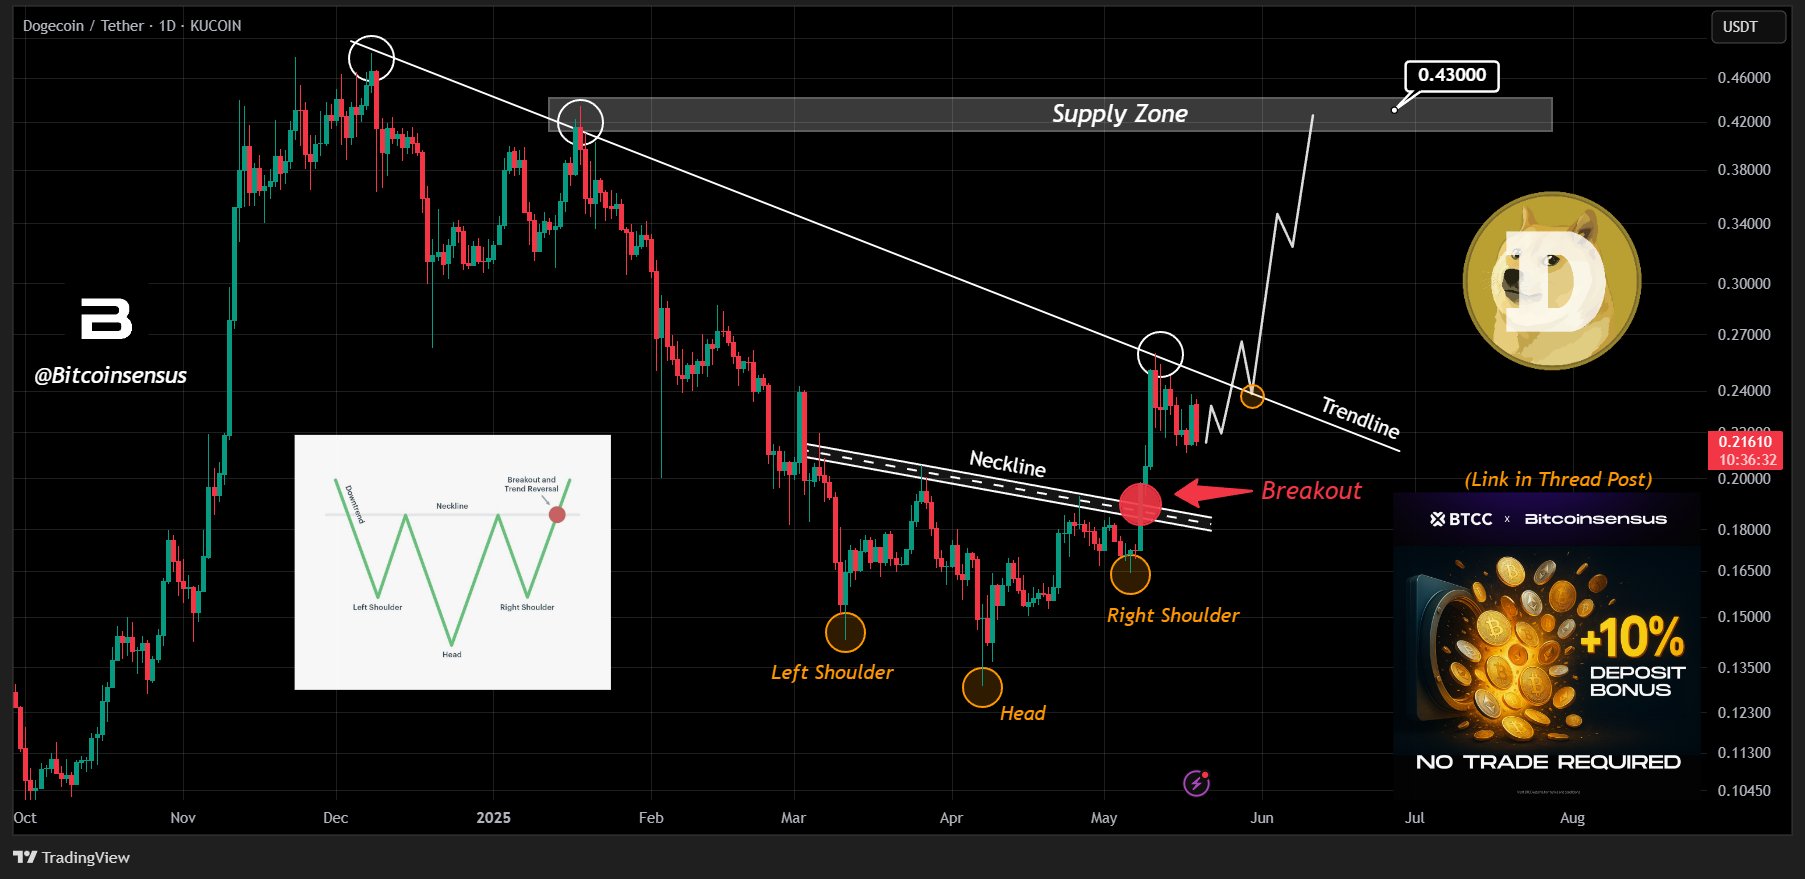
Moreover, the breakout from the bullish structure propelled prices to a multi-month resistance trendline, which has impeded Dogecoin’s price since its high of $0.48 on December 8.
While prices have healthily retraced from the supply zone, Bitcoinsensus predicts that bullishness from the H&S pattern and broader market momentum would spur a breakout, specifically in the next seven days.
With the outburst, the market watcher expects a rally to between $0.42 and $0.43, where the next supply zone lies. From the current price of $0.21, the rally will culminate in a 100% and 104% uptick.
Remarkably, Dogecoin price predictions are higher. For one, analyst Javon Marks predicted a price swell to $0.65. In addition, market watcher Chris called for a higher target of $1 by September 2025. Nonetheless, analyst Ali Martinez has identified the resistance at $0.26 as a near-term barrier to higher prices.
DisClamier: This content is informational and should not be considered financial advice. The views expressed in this article may include the author’s personal opinions and do not reflect The Crypto Basic opinion. Readers are encouraged to do thorough research before making any investment decisions. The Crypto Basic is not responsible for any financial losses.
ADA Eyes $1 as Whale Accumulation, Short Squeeze Pressure, and Technical Breakout Drive Bullish Momentum.
With a fresh wave of whale accumulation, strong technical signals, and key patterns unfolding on higher timeframes, the latest Cardano price prediction is beginning to carry some real weight.
Cardano is quietly making a case for itself again. According to a TradingView technical summary shared by analyst Jesse Peralta, ADA Cardano price is currently sitting in “Strong Buy” territory. It has zero sell signals, nine neutrals, and thirteen pointing toward a buy. It’s not every day that this type of alignment shows up across multiple indicators, especially in a market that’s been rotating attention between larger-cap assets like Ethereum and Solana.
Cardano flashes a rare “Strong Buy” signal on TradingView with 13 indicators in favor and zero sell signals. Source: Jesse Peralta via TradingView
While this isn’t a guaranteed breakout sign, it’s definitely a shift worth noting. Cardano has been slow lately, but this kind of consistent buy pressure usually hints at growing confidence.
Backing up the strong technical buy signal, Cardano just caught the attention of whales. According to on-chain data highlighted by analyst Ali Martinez, over 80 million ADA were scooped up in the last 48 hours alone. That kind of accumulation, especially in such a short window, tends to carry weight.

Whales scoop up 80 million ADA in 48 hours, reinforcing bullish sentiment around Cardano. Source: Ali Martinez via X
Combined with the earlier TradingView “Strong Buy” reading, this fresh whale activity signals a noteworthy shift in sentiment around ADA. While Solana and other altcoins have dominated the spotlight recently, Cardano seems to be building quietly in the background.
Just as Cardano’s metrics align, another technical pattern is flashing green. ADA has broken out of a classic falling wedge on the 3-day chart. What’s compelling here is the consolidation just above the breakout level. This kind of retest-and-hold action typically signals strength, not a fakeout. If the price continues to hold this zone, ADA may be setting up for a steady grind higher rather than a short-lived spike.

Cardano breaks out of falling wedge on 3-day chart, with upside targets at $0.84, $1.00, and $1.18. Source: Jimmy6x9 via X
The chart from Jimmy6x9 outlines three key upside targets: $0.84, $1.00, and $1.18. These are reasonable technical checkpoints based on recent price structure and historical resistance levels.
Building on the momentum from its falling wedge breakout, ADA is also retesting a crucial trendline once again, this time from the top side. The chart shared by Av_Sebastian highlights a potential double-bottom structure forming just above this trendline, suggesting that Cardano might be preparing for its next leg higher. If this support holds, we could be looking at a continuation toward the $0.90 to $1.00 range, which aligns with previous resistance zones and recent technical targets from other analysts.

Cardano retests key trendline post-breakout, with a double-bottom hinting at continuation toward $1.00. Source: Av_Sebastian via X
The setup is clean: two solid bounces off support, a breakout from the downtrend line, and now a textbook retest. ADA holding this level would confirm the breakout’s legitimacy and signal that buyers are stepping in where they need to. If ADA continues respecting this trendline, the technical case for further upside remains intact.
If ADA pushes up to around $0.794, things could get interesting fast, with over $25 million in short positions that would be liquidated at that level, according to data shared by CW8900. That kind of liquidation cluster often acts as a target zone.

Over $25M in ADA shorts risk liquidation near $0.794, creating a potential squeeze zone. Source: CW8900 via X
It’s especially notable because this pressure zone sits right above ADA’s recent trendline bounce and double bottom setup, which already hinted at bullish momentum building. If buyers step in and push the price just a little higher, we could see a chain reaction play out.
All signs are starting to align. From a “Strong Buy” signal on TradingView to whales quietly stacking over 80 million ADA, Cardano is showing real signs of life. Add to that a clean double-bottom forming above key support and a looming $25M short squeeze trigger at $0.794, and you’ve got a technical setup that’s hard to ignore, and it’s worth keeping ADA on your radar for any serious Cardano price prediction moving forward.
XRP has officially entered a new era of institutional accessibility with its futures contracts going live on the Chicago Mercantile Exchange (CME).
This move marks a pivotal moment in Ripple XRP news, reinforcing XRP’s status as more than just a cross-border payments token.
While some market participants hoped the launch would trigger an immediate 7–10% price jump, analysts emphasize that the longer-term significance outweighs any short-term volatility. According to crypto analyst Austin Hilton, “This isn’t just about a quick pump—it’s about the institutionalization of XRP as a credible financial asset.”
The new CME contracts are cash-settled, meaning traders won’t own XRP tokens directly but can speculate on their price movements. This setup aligns with institutional strategies that prioritize compliance and risk management. Now, hedge funds, asset managers, and other sophisticated market players have a regulated avenue to gain exposure to XRP.
CME has officially listed XRP futures contracts on its Globex platform, drawing increased attention from institutional investors. Source: Good Morning Crypto via X
Aj Allen, a veteran trader and active member of the XRP community, explained how this development bridges a long-standing gap: “This gives traditional finance players access to XRP without touching the underlying asset. That’s a massive win for institutional adoption.”
Such institutional traction could also lend strength to XRP’s case for future spot ETF approval, following the precedent set by Bitcoin and Ethereum, whose spot ETFs were greenlit only after their futures were well-established.
However, optimism should be balanced with caution. Historical data shows that both Bitcoin and Ethereum experienced price drops shortly after their futures launched. Bitcoin’s CME debut in 2017 was followed by a 30% decline within days. Ethereum saw a similar fate after its futures launched in early 2018.

Although CME futures don’t involve owning XRP, their pricing can significantly influence XRP’s spot price on exchanges where the actual coin is traded. Source: AJ via X
Allen warned, “Futures markets can introduce short-term volatility. They create opportunities for professional traders to engage in arbitrage and basis trading, which often puts downward pressure on spot prices.”
Basis trading involves exploiting the difference between spot and futures prices. In a contango scenario (where futures trade above spot), traders might short futures and buy spot XRP. In backwardation, they may reverse the strategy. While these dynamics contribute to market efficiency, they also introduce unpredictable short-term movements.
At Monday, XRP was trading at about $2.35, having surged 3% briefly on Sunday. The price quickly rolled over, however, and shed most of those gains. The analysts note that XRP is struggling to break decisively above a key resistance band between $2.41 and $2.45—a liquidity-rich area traditionally regarded as a “point of control” in technical theory.

If XRP holds its daily channel, a breakout next week could push it above the 3.68 Fibonacci level. Source: Elenigma080 on TradingView
If XRP is unable to pierce through here with decent volume, a correction lower towards the $2.28–$2.26 support region is more probable. The on-chain indicators also show waning bullish momentum, with the Relative Strength Index (RSI) near the middle value of 52. A drop below 50 might signify an even quicker correction.
Further, the Moving Average Convergence Divergence (MACD) signal is approaching a bearish crossover on the daily chart. If confirmed, it would reinforce a near-term bearish sentiment.
The significance of XRP’s futures listing goes far beyond its short-term price behavior. It underscores Ripple’s greater ambition to put blockchain technology into the mainstream of finance. The listing comes as Ripple is gradually emerging from its long-standing legal drama with the SEC—a case that has filled XRP headlines and investor sentiment since late 2020.
While the XRP suit continues, the fact that CME viewed XRP as mature enough for a futures product lends credibility to Ripple’s status in regulation and institutions. It also breeds speculation for potential partnerships with institutions like Bank of America, which Ripple has already been linked to.
Ripple CEO Brad Garlinghouse has been clamoring for regulatory clarity and institutional adoption for a long time now. While he hasn’t directly mentioned the CME launch, the move aligns just right with his vision for the future for Ripple XRP’s position in worldwide finance.
The CME futures launch may not instantly skyrocket XRP value, but it does cement XRP’s place among digital assets viewed as viable tools for institutional trading. It also enhances the asset’s utility beyond the Ripple ledger and Ripple exchange use cases.

XRP was trading at around $2.31, down 3.26% in the last 24 hours at press time. Source: XRP Liquid Index (XRPLX) via Brave New Coin
Even if near-term price movement remains subdued or volatile, the futures product lays the groundwork for deeper market integration, potentially influencing everything from the Ripple currency price to the trajectory of a future Ripple spot ETF.
In summary, while XRP’s immediate price reaction to the CME launch remains mixed, the long-term implications are clear. The event signals XRP’s evolution from a fintech utility token to a globally recognized investment vehicle. Whether the short-term outlook brings a rally or a retracement, the CME futures launch marks a defining moment in Ripple’s journey.
As more institutional players engage with XRP through regulated instruments, and the Ripple lawsuit update continues to progress, XRP could be poised for broader adoption, one future contract at a time.
Binance Coin (BNB) price has been holding ground above the $640 level for several sessions, but the recent price action shows signs of fatigue. Based on the latest TradingView hourly and daily charts, BNB price is currently consolidating after a sharp rally, with critical technical levels suggesting a decision point is approaching.
On the hourly chart, BNB/USD is trading at $640.2, showing minimal movement (+0.02%) as of the last candle. The price is hovering just below a key resistance cluster around $646–$652, formed by the 50, 100, and 200 simple moving averages. Notably, the 20 SMA ($642.6) and 50 SMA ($642.9) are nearly flat, indicating indecision in the short term.
We can clearly see a bearish crossover, where shorter moving averages have failed to climb above the longer ones. This typically signals selling pressure. The Heikin Ashi candles are showing small-bodied formations with wicks on both ends, reinforcing the narrative of sideways chop and lack of trend.
Using a Fibonacci retracement from the recent hourly high of $660 to the low near $620, we can estimate:
BNB price is now sitting right at the 50% Fibonacci level, suggesting this zone could act as a pivot — a break above could re-ignite a bullish move, but rejection may send BNB retesting support near $620.

Zooming out, the daily chart paints a more optimistic picture, but it’s not without red flags. BNB price is still trading above all key daily moving averages:
This alignment of the short-term SMA > long-term SMA is a classic bullish structure. However, the price action is stalling near $645–$650 — an area that coincides with the 0.382 Fibonacci retracement from the March high to the April low. The local top of $660 formed earlier this week has not yet been breached, and the last few candles are showing signs of weakening momentum with lower highs and smaller bodies.
If this is a bull flag pattern, which it appears to be, we can estimate the breakout target using flagpole projection:
This gives a bullish breakout target of $720, but only if Binance Coin price can decisively close above $660 with strong volume.
To answer this, let’s combine momentum and price structure:
So, if $640 fails, the next daily support lies at $620, and below that, the 100-day SMA near $613. On the flip side, a move above $660 would open up room for $700 and then $720, based on the flagpole calculation.
BNB price sideways action is a cool-off phase after a strong May rally. Right now, it’s a battle between short-term bearish pullbacks and long-term bullish trend continuation. The market is waiting for a trigger — likely Bitcoin’s next move or macro news — to decide the direction.
For traders, $660 is the breakout level to watch, and $620 is the key support. The next 48 hours will be critical in determining if BNB heads toward $700 or dips back to $600.
Jakarta, Pintu News – Dogecoin price forecasts remain optimistic after recording a daily gain of 5% and a monthly surge of 42.5%, as Bitcoin adoption by sovereign nations drives market sentiment.
On May 16, the Central Bank of Saudi Arabia confirmed the purchase of 25,656 shares in the company Strategy (formerly MicroStrategy), which is known to hold more than 200,000 BTC.
The $10.2 million investment coincided with former US President Donald Trump’s diplomatic visit to Riyadh and was widely seen as an indirect signal of Bitcoin adoption by the oil-rich kingdom.
Read also: PEPE Whale Returns With a Splash, Moves $29 Million in Tokens From Binance!
This development is considered a significant milestone in Bitcoin accumulation by sovereign nations and instantly revived the crypto market. Ethereum rose 3% on Sunday and broke the $2,550 level again, accompanied by a jump in trading volume from $12.5 billion to $15 billion.
Bitcoin itself is again testing the $105,000 level, fueled by speculation that other sovereign wealth funds may follow Saudi Arabia’s lead, which could trigger a price increase to a new record in the coming week.
Long-term predictions such as those from entrepreneur Robert Kiyosaki even target Bitcoin’s price to reach $250,000 before the end of 2025.
However, amid the spotlight on Bitcoin and Ethereum, the Dogecoin price quietly rose another 5% on Sunday. Interestingly, DOGE’s 42.5% surge in the last 30 days even surpassed BTC and ETH’s performance on a monthly timeframe.
Dogecoin has long mirrored Bitcoin’s movements, often even amplifying price direction changes, especially in the highly speculative phases of the crypto market cycle.
In early 2021, when the price of BTC jumped from $30,000 to $64,000, DOGE skyrocketed by more than 900% along with the major crypto asset.
The rise in DOGE back then was not driven by fundamentals, but rather by positive sentiment and increased market liquidity flowing from the BTC rally – two factors that are now making a comeback.
With Bitcoin’s dominance back on the rise and macro catalysts such as institutional investment flows from countries like Saudi Arabia in the spotlight, Dogecoin is expected to follow every parabolic surge made by Bitcoin.
In addition, Strategy’s CEO, Michael Saylor, hinted at the potential next Bitcoin buy in a post on X (formerly Twitter) on May 16. This further reinforces investors’ belief that the “whales” are gearing up for a potential long-awaited supply shortage.
Read also: You Can Now Buy a Burger with Bitcoin — Steak ‘n Shake Just Made It Happen!
As long as BTC remains in a bullish market structure and continues to attract macro attention, Dogecoin will likely benefit disproportionately due to its historical sensitivity to inflows from retail investors and a boost from social momentum.
If Bitcoin manages to reach the $250,000 level – or an increase of around 285% from its current price – then Dogecoin could potentially experience a parabolic rally, reflecting its high historical correlation to BTC movements.
Based on the multiplicative pattern in the previous bull market cycle, with a conservative correlation factor of 3.5x, the price of DOGE is expected to be in the range of $0.78 to $0.85, in line with the previous cycle peak.
This projection assumes stable liquidity conditions, continued positive market sentiment, and active participation from retail investors.
In the short term, psychologically important levels such as $0.30 and $0.50 are expected to be temporary resistance areas in Dogecoin’s price rally attempt.
However, the increasing race for Bitcoin accumulation by countries and corporate institutions may accelerate this momentum.
The latest MicroStrategy stake purchase by Saudi Arabia has the potential to elevate Bitcoin’s status as a sovereign-grade asset, while strengthening the legitimacy of crypto in the global trading system.
In this context, Dogecoin again has the potential to become a major speculative asset that gets boosted by the rally triggered by Bitcoin.
Dogecoin’s recovery from the price drop on May 13 is now showing a bullish formation above the $0.21 support level, confirming the uptrend continuation signal on the daily chart.
As of May 18, DOGE is trading around $0.2255, recording a daily gain of 5.13%, and moving above the Parabolic SAR baseline ($0.2107) as well as the 100-day SMA ($0.1938) – indicating that the short-term trend is still to the upside.
The Parabolic SAR dots that are now below the candles indicate the return of the uptrend, supported by the weakening selling pressure on the MACD histogram.
Read also: Dogecoin Soars 8% as Whale Unleashes 170 Million DOGE—Market on Edge
Although the MACD line (0.0142) is slightly curved downwards, its position is still above the signal line (0.0133), which means that the bullish momentum has not been lost and the possibility of further upside is still open.

In the current consolidation phase, the 150-day SMA at $0.2405 becomes the next significant upside obstacle.
If DOGE is able to break the level with a convincing daily close, a quick move towards $0.2650 is highly likely due to the interest from momentum market participants.
On the contrary, if it fails to break $0.24, the price is likely to retest $0.2100, which is the key point to keep the bullish scenario in place.
Overall, today’s Dogecoin price prediction still leans bullish as long as the price stays above $0.21. The constructive positioning of the moving averages, as well as the weak bearish divergence, provide grounds for a possible retest of the $0.24 level this week.
Further upside will depend on the overall crypto market sentiment, specifically whether Bitcoin is able to maintain a position above $105,000.
That’s the latest information about crypto. Follow us on Google News to stay up-to-date on the world of crypto and blockchain technology.
Enjoy an easy and secure crypto trading experience by downloading Pintu crypto app via Google Play Store or App Store now. Get a web trading experience with advanced trading tools such as pro charting, various types of order types, and portfolio tracker only at Pintu Pro. Pintu Pro Futures is also available, where you can buy bitcoin leverage, trade btc futures, eth futures and sol futures easily from your desktop!
*Disclaimer
This content aims to enrich readers’ information. Pintu collects this information from various relevant sources and is not influenced by outside parties. Note that an asset’s past performance does not determine its projected future performance. Crypto trading activities have high risk and volatility, always do your own research and use cold cash before investing. All activities of buying and selling bitcoin and other crypto asset investments are the responsibility of the reader.
Reference:
Ripple has
secured its first blockchain-enabled payments clients in the United Arab
Emirates following its regulatory license from the Dubai Financial Services
Authority (DFSA), marking a significant expansion in one of the world’s largest
cross-border payment hubs.
However,
the price of XRP has
been highly volatile, sliding nearly 6% during Monday’s session on May 19,
2025. At the moment, a single XRP is trading for under $2.30. Let’s explore why
XRP price is down today and what triggered the sell-off.
The digital
asset infrastructure provider announced today (Monday) that Zand Bank and Mamo
will utilize Ripple Payments, the company’s blockchain-enabled cross-border
payment solution, to facilitate faster and more transparent international
transactions.
This
development comes two months after Ripple became the first blockchain-enabled
payments provider to receive a license from the DFSA in March 2025, allowing
the company to manage end-to-end payments for clients across its global
network.
“Securing
our DFSA license enables Ripple to better serve the demand for solutions to the
inefficiencies of traditional cross-border payments in one of the world’s
largest cross-border payments hubs,” said Reece Merrick, Managing Director
for Middle East and Africa at Ripple.
Read About
Ripple’s XRP Growing Adoption: Mastercard
Highlights SBI Remit as SWIFT Speculation Builds
The UAE
partnerships reflect growing regional interest in blockchain-based payment
solutions. According to Ripple’s 2025 New Value Report, 64% of finance leaders
in the Middle East and Africa region view faster payments and settlement times
as the primary motivation for incorporating blockchain technology into
cross-border payment flows.
Zand Bank,
which holds a full banking license in the UAE, will integrate Ripple’s
technology as part of its digital asset services. “Our collaboration with
Ripple highlights our commitment to empowering global payment solutions through
blockchain technology,” said Chirag Sampat, Head of Treasury and Markets
at Zand Bank.
Sampat
added that Zand Bank plans to launch an AED-backed stablecoin to enhance
transactions in the digital economy.
Mamo, a
payment service provider, will use Ripple’s technology to support business
growth in the UAE. “Our partnership with Ripple is a big step forward. It
allows us to offer faster, more reliable cross-border payments for both
businesses and consumers,” said Imad Gharazeddine, CEO and co-founder of
Mamo.
Ripple
Payments now operates in multiple jurisdictions including Dubai, the United
States, Brazil, Mexico, Australia, and Switzerland. The company reports
processing more than $70 billion in volume across 90+ payout markets,
representing more than 90% coverage of daily foreign exchange markets.
The company
holds over 60 regulatory licenses and registrations globally, positioning it to
provide tokenization, storage, exchange, and movement of digital assets for
financial institutions.
While
Ripple expands its institutional partnerships, its associated cryptocurrency
XRP has experienced price volatility. XRP is currently trading at $2.29, down
nearly 5% over the past 24 hours amid broader cryptocurrency market turbulence.
XRP is one of the biggest losers among the major cryptocurrencies today. Source: CoinMarketCap.com
The weekend
saw significant price swings across major cryptocurrencies, with Bitcoin (BTC)
briefly surging past $106,000 before retreating to around $103,000. This
volatility triggered over $670 million in liquidations across crypto
derivatives markets, affecting positions in major cryptocurrencies including
XRP.
Source: CoinGlass.com
The market
turbulence comes amid macroeconomic uncertainty, including Moody’s recent
downgrade of the U.S. credit rating and rising concerns about inflation. U.S.
30-year treasury yields have breached the 5% mark, contributing to market
anxiety.
My
technical analysis shows that XRP has stalled at local support near $2.29,
a level tested many times since early 2025: first as support in January,
February, and March, then several times as resistance through April and early
May. The zone is again acting as support. If it gives way, XRP could slip back
into the bearish regression channel it has followed for the past five months.
XRP/USDT technical analysis. Source: Tradingview.com
A
drop below that line would reopen the path toward the round $2.00
support and potentially lower, toward the April lows around $1.80. I
also see local support at $1.89, matching the March trough. That
downside scenario activates only if the current floor breaks.
You may
also like: Why
XRP Is Going Up and Price Predictions (May 2025)
Still, the
bulls may have more room to run. To prove it, XRP first has to clear resistance
at $2.47, matching the late-March high, and then $2.65, another
March peak that also served as resistance at the end of 2024. Once XRP pushes
above that cluster of barriers, the door opens to the round $3.00 mark
and this year’s January peak around $3.40. Longer-term forecasts from major
banks and other large financial institutions point even higher—toward $8
and even $12 per token.
|
Price |
Role |
Basis |
|
$2.29 |
Support |
Repeatedly tested since Jan 2025; |
|
$2.00 |
Support |
Round-number |
|
$1.89 |
Support |
Aligns with |
|
$1.80 |
Support |
April bottom |
|
$2.47 |
Resistance |
Late-March |
|
$2.65 |
Resistance |
Late-March peak; served as |
|
$3.00 |
Resistance |
Round-number |
|
$3.40 |
Resistance |
January 2025 |
Despite
these short-term fluctuations, institutional adoption of blockchain payment
solutions continues to advance, with Ripple’s UAE expansion representing a
notable development in the integration of digital asset technology into
traditional financial systems.
Analyst
targets for year-end 2025 span a wide range:
In short,
consensus leans toward low-single-digit to mid-single-digit prices, with
double-digit targets requiring multiple favorable catalysts that are not yet
certain.
Highly
unlikely in the current cycle. At $100 per coin, XRP’s market capitalization
would exceed $5 trillion—larger than Apple and Microsoft combined—without any
mechanism to retire or lock up the roughly 100 billion-token supply. Most
professional forecasters therefore dismiss a three-digit print before 2030.
A $500 XRP
implies a capitalization above $25 trillion, more than global M1 money supply.
No credible analyst or institution projects such a level within the foreseeable
future. It would require wholesale replacement of legacy payment rails
worldwide and an unprecedented contraction of free-floating supply—conditions
that remain theoretical at best.
A jump to
$20 (roughly an eight-fold gain) sits at the upper edge of bullish but still
numerically plausible scenarios. Traders who track Elliott-Wave patterns and
some institutional-adoption models argue it could happen late 2025 or in 2026
if:
While far
from the base case, a $15-$20 print is considered attainable under an aligned
set of positive catalysts and would put XRP’s market value near $1 – $2
trillion, well below Bitcoin’s 2021 peak but significantly above today.
Solana (SOL) price shows early signs of a potential breakdown as it trades lower at $165.40 on Monday. SOL is approaching a key support level that could determine its next major move. Technical indicators flash red, and bearish sentiment intensifies, with short positions hitting a monthly high. If SOL closes below its critical support level, the selling pressure could accelerate, potentially driving the token into a double-digit decline toward the $141 mark.
Solana price faced rejection around the $184.13 daily resistance level on May 14 and declined nearly 10% until Saturday. However, it recovered slightly the next day after finding support around its 200-day EMA at $162.42. This level roughly coincides with the daily support at $160 and the ascending trendline (drawn by joining multiple low levels since April 7), and a breakdown indicates a bearish trend. At the time of writing on Monday, it trades down at around $165.40, approaching its critical support zone.
If SOL continues its correction and closes below $160 on a daily basis, it could extend the decline by 14.6% from its current levels to retest its May 6 low of $141.41.
The Relative Strength Index (RSI) on the daily chart reads 54, pointing toward its neutral level of 50, indicating fading bullish momentum. If the RSI moves below its neutral level of 50, it would give rise to strong bearish momentum and a sharp fall in Solana prices. The Moving Average Convergence Divergence (MACD) indicator is also switching to a bearish crossover on the daily chart. If the crossover occurs, it would confirm another sell signal.
SOL/USDT daily chart
Another sign of a bearish outlook. According to Coinglass’s data, SOL’s long-to-short ratio reads 0.85, the lowest level over a month. This ratio below one reflects bearish sentiment in the markets as more traders are betting on Solana’s price to fall.
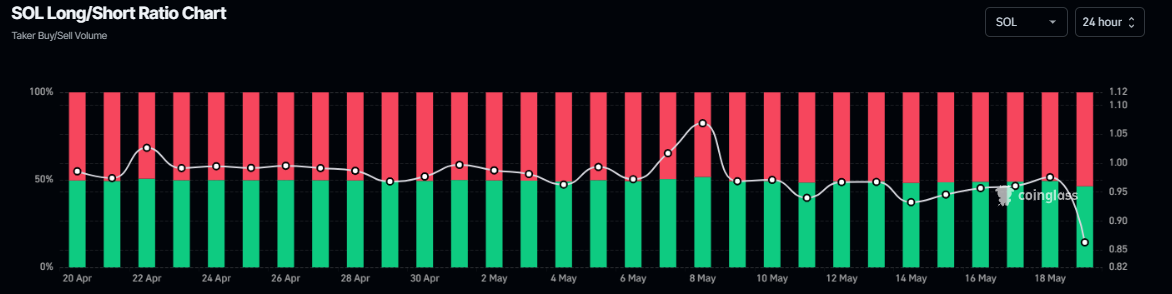
Solana Long-to-short ratio chart. Source: Coinglass
However, if SOL finds support around the daily level at $160 and recovers, it could extend the recovery toward the next daily resistance at $184.13.
XRP is poised to enter a significant new chapter in its evolution as a financial asset. Today, May 19th, marks the official launch of XRP futures on the Chicago Mercantile Exchange (CME), one of the world’s most respected and regulated derivatives platforms.
This development marks a pivotal moment—not necessarily for immediate price action, but for long-term institutional validation. While some may hope for a 7–10% price surge, the true importance lies in the broader implications for XRP’s role within the financial ecosystem.
The listing on CME goes beyond a simple trading milestone. It signals that XRP is being recognized as a legitimate and tradable financial instrument on a platform that already hosts futures for Bitcoin and Ethereum.
This move offers institutional investors a new gateway into XRP, enabling them to engage in regulated hedging, leverage strategies, and access deeper liquidity.
In practical terms, this means funds, asset managers, and traders on Wall Street can now gain exposure to XRP through a trusted and compliant infrastructure—bridging the gap between traditional finance and blockchain-based assets.
For years, XRP has primarily been associated with Ripple’s cross-border payment solutions. However, this new development represents a shift in perception. XRP is beginning to outgrow its original use case and is entering the arena of globally recognized financial instruments.
This evolution may not immediately reflect in a spike in price, but it significantly enhances the asset’s credibility and attractiveness for institutional capital. In an industry often distracted by the hype surrounding meme coins and speculative narratives, this move stands out as a major step forward for XRP.
CME’s decision to include XRP alongside established digital assets in its offerings suggests a level of maturity and acceptance that few cryptocurrencies have achieved. It represents a culmination of years of advocacy, development, and perseverance—especially in the face of legal and regulatory hurdles.
Source – Austin Hilton on YouTube
XRP recently experienced a drop into a strong support area between $2.28 and $2.26, aligning with key technical indicators like the 30-day VWAP and a notable three-drive bullish reversal pattern. This reaction was constructive, leading to a short-term rally from the $2.3 level.
However, despite the rebound, $XRP remains below a crucial resistance zone between $2.41 and $2.45 — considered the point of control where most liquidity is concentrated.
Until this level is broken with convincing volume or broader market strength, particularly from Bitcoin or a rise in open interest, a sustained upward breakout remains unlikely.
Given the current low-volume conditions, especially on a Sunday, the price is more likely to pull back or range between $2.30 and $2.26 rather than surge upward in the immediate term. A breakout would require stronger momentum, which, as of now, has not yet materialized.
While the short-term market reaction remains uncertain, the launch of XRP futures on CME firmly establishes XRP as part of the top tier in the financial infrastructure of digital assets.
It’s a foundational moment that may pave the way for broader adoption and utilization in the years to come. Whether or not there is immediate market excitement, the importance of this institutional endorsement cannot be overstated.
XRP is no longer just a tool for cross-border transfers—it is now stepping into its role as a regulated, investable asset on one of the world’s most respected financial exchanges. In this kind of development, a secure and versatile crypto wallet like Best Wallet becomes increasingly essential.
As institutional adoption grows and more users engage with XRP across various platforms, having a reliable wallet helps investors store, manage, and interact with their assets safely while taking full advantage of new financial opportunities.
Best Wallet is redefining what it means to be a crypto wallet by evolving into a full-scale ecosystem that goes far beyond basic storage and transactions. Traditionally, crypto wallets serve as digital tools to hold assets and interact with decentralized platforms like Uniswap.
However, Best Wallet enhances this functionality by integrating a decentralized exchange (DEX), a native token, and even an upcoming real-world debit card, all under one umbrella.
This makes it not just a place to store your tokens, but a gateway into deeper crypto engagement—from trading to early presale access and eventually real-world utility through seamless crypto spending.
The wallet currently supports over 60 chains, offering vast interoperability for users who hold assets across multiple networks. Its native token, which is now in presale, adds another layer of value, creating an incentivized and interconnected user base—something major wallets like MetaMask or Trust Wallet never offered.
By pairing its DEX with exclusive presale access, Best Wallet gives users an edge in discovering and investing in new projects before they hit mainstream exchanges. And with a debit card in the pipeline, it’s aiming to eliminate the friction of converting crypto to fiat by allowing users to spend directly from their wallets.
With over $12.5 million already raised in its $BEST token presale, the momentum behind Best Wallet underscores growing confidence in its potential to become a foundational tool in the growing digital finance landscape. To take part in the $BEST token presale, visit bestwallettoken.com.
This article has been provided by one of our commercial partners and does not reflect Cryptonomist’s opinion. Please be aware our commercial partners may use affiliate programs to generate revenues through the links on this article.
Bulls are controlling the situation on the market on the last day of the week, according to CoinMarketCap.CoinMarketCap”>
The price of Bitcoin ![]() BTCUSD has risen by 1.80% over the last day.TradingView”>
BTCUSD has risen by 1.80% over the last day.TradingView”>
On the hourly chart, the rate of BTC is going up after breaking the local resistance of $104,094.
If bulls can hold the gained initiative and the daily candle closes far from that mark, the growth may continue to the $106,000 area.TradingView”>
On the bigger time frame, the price of the main crypto is testing the $104,985 level. If a breakout happens and the bar closes with no long wick, the accumulated energy might be enough for a continued upward move to the $107,000 zone.TradingView”>
From the midterm point of view, traders should focus on the weekly bar closure in terms of the $108,364 level. Unless a breakout happens, there is a chance of a correction to the $100,000 mark.
Bitcoin is trading at $104,830 at press time.

Ripple’s XRP token is once again in the spotlight, with traders and analysts targeting a potential breakout to $2.50 as momentum builds around May’s key price levels.
Surging interest is being driven by two major catalysts: anticipation of U.S.-based XRP ETF approvals and growing speculation over a potential Ripple ICO aimed at expanding the XRP Ledger’s DeFi ecosystem.
XRP is trading in a bullish ascending triangle pattern, hovering around $1.89 as of mid-May. Analysts at Brave New Coin highlight multiple key support zones between $1.70 and $1.80 that have held firm despite market volatility.
Technical indicators show:
Traders are closely watching the $2.00 resistance zone, which, if breached, could open the door to a fast move toward $2.50 and even $3.00 in a high-volume environment.
Driving much of the bullish sentiment is the renewed buzz around XRP ETF applications. While the SEC has yet to formally approve any spot XRP ETF, crypto analysts believe recent progress on Ethereum ETF talks may pave the way for other altcoins, including XRP, to gain institutional exposure.
“If an XRP ETF gets approved this year, we’re talking about a supply shock. Prices could surge well past $3,” one trader said.
In a surprise twist, rumors of a Ripple-led ICO are spreading across the crypto community. According to TronWeekly, Ripple may be preparing to launch a native token offering to support the growing DeFi ecosystem on the XRP Ledger.
If true, this move would mirror what Ethereum and Solana ecosystems have done — and could drive fresh retail and institutional interest.
With bullish technicals, regulatory clarity, and speculative catalysts aligning, the final weeks of May 2025 could be pivotal for XRP.
Analysts agree that if XRP breaks $2.50, it could quickly move to $3.00–$3.50, supported by fresh capital inflows and a favorable regulatory tailwind.
XRP is gaining steam in May 2025 as technical strength meets major narrative drivers — including ETF hopes and DeFi expansion rumors.
If current momentum holds, $2.50 may just be the beginning of a larger bull run that positions XRP as one of the year’s top-performing altcoins.
This content is brought to you by the FingerLakes1.com Team. Support our mission by visiting www.patreon.com/fl1 or learn how you send us your local content here.


