The main tag of cryptocurrency price today Articles.
You can use the search box below to find what you need.
[wd_asp id=1]
The main tag of cryptocurrency price today Articles.
You can use the search box below to find what you need.
[wd_asp id=1]
The Ethereum price today is trading around $2,365, holding steady after a dramatic two-day surge from the $1,800 region. This bullish move followed a breakout above a multi-month descending trendline and has brought Ethereum price action into focus as traders eye the psychological $2,400 barrier. The price has jumped nearly 30% since May 7, posting one of the strongest recoveries among top altcoins this week.
The daily chart reveals a clean breakout from the falling wedge structure that had capped upside since March. Key resistance levels between $2,360 and $2,400—formed from earlier January-February consolidation—are now being tested. Meanwhile, the weekly structure shows ETH has bounced from the 0.5 Fibonacci level and is targeting the 0.618 zone near $2,520 in the mid-term.
The answer to why Ethereum price going up today lies in the alignment of both technical and momentum indicators. On the 4-hour chart, ETH has firmly closed above the 20/50/100/200 EMAs, with all moving averages now stacked bullishly. This crossover confirms strong upside momentum and trend reversal from the April lows.
The MACD on the 30-minute and 4-hour timeframes is still in bullish territory, with a wide gap between the MACD and signal lines, though histogram bars are slightly flattening—suggesting a cooling of momentum rather than reversal. Similarly, the RSI on both timeframes is hovering just under the overbought zone (currently near 59), indicating ETH is sustaining its bullish bias without immediate exhaustion.
However, short-term Ethereum price volatility is expected as the price nears $2,400. The stochastic RSI is showing divergence on the lower timeframes, pointing to possible consolidation or a minor dip before any continuation. In addition, Ichimoku Cloud analysis on the 4-hour chart shows ETH trading well above the cloud with the Tenkan-Sen and Kijun-Sen aligned in a bullish crossover, further confirming the uptrend.
If ETH holds above the $2,300–$2,340 range in the coming hours, bulls may attempt to clear the $2,400 barrier. A decisive daily close above this level could open the door to the $2,520–$2,550 zone, which aligns with the 0.618 Fibonacci retracement on the daily chart. On the downside, initial support lies near $2,300 followed by a key cushion at $2,145 (the 50-EMA on the 4H).
Given the recent Ethereum price spikes, traders should monitor for potential pullbacks toward $2,250 if the price fails to sustain above $2,365. However, the current Ethereum price update leans bullish with higher highs, volume support, and clean trendline breaks across all major timeframes.
Forecast Table: Ethereum (ETH) Short-Term Price Levels
| Level | Value (USD) | Significance |
| Immediate Resistance | $2,400 | Key horizontal and psychological zone |
| Next Bullish Target | $2,520–$2,550 | 0.618 Fib level |
| Support 1 | $2,300 | Recent breakout base |
| Support 2 | $2,145 | 50 EMA (4H), trend support |
| RSI (30-min) | 59.39 | Neutral-bullish |
| MACD (4H) | Bullish | Strong histogram + crossover |
| Stochastic RSI (4H) | Overbought (~74–77) | Signals consolidation risk |
| Ichimoku Signal (4H) | Bullish | Price above cloud + bullish cross |
Previously, we highlighted ETH’s tightening price action and wedge breakout near $1,850. With that structure now resolved and momentum favoring the upside, this Ethereum price prediction for May 11 suggests continued strength unless bulls lose the $2,300 level.
Disclaimer: The information presented in this article is for informational and educational purposes only. The article does not constitute financial advice or advice of any kind. Coin Edition is not responsible for any losses incurred as a result of the utilization of content, products, or services mentioned. Readers are advised to exercise caution before taking any action related to the company.
A new Dogecoin price prediction by a TradingView analyst suggests that the largest meme coin might repeat last year’s price action, rocketing nearly 6x to reach a new ATH above $1.
However, DOGE will likely play second fiddle to Remittix (RTX), a new PayFi token in the highly valued cross-border payments sector forecasted to deliver investors 100x gains! Let’s find out why.
This Remittix’s astronomical price forecast is anchored on its innovative payment solution that market pundits posit will shake the massive cross-border settlements and remittance economy.
Source: Remittix Website
This Ethereum dApp features a cutting-edge crypto-to-fiat payment network that connects cryptocurrencies to everyday local payment apps globally, allowing crypto holders and small business owners to transfer fiat to any bank using crypto.
By seamlessly merging the crypto and fiat worlds, Remittix weaves the speed of crypto with the convenience of fiat payment systems, eliminating the delays and high costs that plague traditional money transfers.
Unlike the legacy cross-border wires that take 2-5 business days with extra wire, FX and hidden costs, Remittix offers same-day settlement at a flat fee and users can initiate payments using 50+ coins and over 30 currencies.
It’s easy to see why crypto experts believe the Remittix protocol will disrupt the $190 trillion cross-border payments economy and cut a hefty share for itself. Taking even 1% market share suffices to push the RTX market cap to the billions, sparking a stratospheric 100x upsurge for the token price.
After a prolonged five-month correction, the DOGE price crumbled to a vital support level in the $0.14 region. But DOGE whales have been pouring in fresh liquidity at the dip, pushing the Dogecoin price up over 30% in the past month.

Source: CoinMarketCap
This impressive price recovery comes amid positive Dogecoin news of the DogeOS, which has secured $6.9 million in funding to transform the Dogecoin blockchain into a dApp development layer.
The DOGE price increase is also likely being fueled by the potential approval of a Dogecoin ETF, whose odds have risen to over 60% on Polymarketcap.
Top crypto analysts now predict that the meme coin might be gearing up for a massive bullish breakout following an extended period of correction and consolidation.
TradingView analyst GreenCrypto maintains that the Dogecoin price has been on a long-term uptrend since 2023, forming a robust ascending wedge pattern.

Source: TradingView
The analyst suggests that the meme coin is set to continue the upside, with the trajectory of the pattern showing a potential blast to a new all-time high in the $1.1 zone. That represents a staggering gain of nearly 600% from current rates!
The 500% Dogecoin price prediction fades before RTX, which is predicted to pull a 100x potential multiplier thanks to its innovative PayFi solution, low market cap and astronomical market potential.
This far, investors have stockpiled over 532 million RTX tokens, pushing the Remittix ICO toward the $15 million mark. Tokens are selling fast at the $0.0757 floor price, but it’s just a matter of days before the price jumps to $0.0781. Investors are advised to jump in now rather than later and load up while the price is still low.
Discover the exciting opportunities of the Remittix (RTX) presale today!
Website: https://remittix.io/
Socials: https://linktr.ee/remittix
Key points:
Bitcoin holding $100,000 as a level of support would confirm the current trend change.
Ether leads among altcoins, and DeFi tokens could follow.
Bitcoin (BTC) broke above the psychologically critical $100,000 level on May 8, and the bulls are trying to hold on to the level on May 9. In an X post, CoinGlass said that Bitcoin’s rally resulted in $837.80 million in short liquidations in a 24-hour period, the largest since 2021.
Bitcoin’s rally also lifted several major altcoins, which soared above their respective overhead resistance levels. The altcoin rally was led by Ether (ETH), which surged roughly 22% on May 8, triggering a $328 million liquidation of Ether short positions.
Although the short-term picture has turned positive, Bitcoin bulls are expected to face significant resistance near the all-time high of $109,588. During pullbacks, traders will have to maintain the price above $100,000 to retain the bullish momentum.
Could Bitcoin continue its upward move and pierce the all-time high? Are altcoins getting ready for a short-term rally? Let’s analyze the charts of the top 10 cryptocurrencies to find out.
Bitcoin rallied more than 6% and closed above the $100,000 barrier on May 8, indicating that buyers have asserted their supremacy.

The BTC/USDT pair could reach the $107,000 to $109,588 zone, where the bears are expected to mount a strong defense. The overbought level on the relative strength index (RSI) suggests a short-term pullback is possible.
If the price turns down from the overhead resistance but finds support at the 20-day exponential moving average ($94,879), it signals a positive sentiment. The bulls will then make one more attempt to push the price above the all-time high.
The first sign of weakness will be a close below the 20-day EMA. That suggests profit booking at higher levels. The pair may then tumble to the 50-day simple moving average ($88,139).
Ether (ETH) skyrocketed above the $2,111 resistance on May 8 and extended its up move to nearly $2,550 on May 9.

The long wick on the candlestick shows solid selling near $2,550. If the price turns down from $2,550 but finds support at $2,111, it indicates that the bulls are trying to flip the level into support. The bulls will then make one more attempt to drive the ETH/USDT pair above $2,550. If they succeed, the pair could climb to $2,850.
Sellers will have to pull the price below the $2,111 level to weaken the bullish momentum. The pair may then slide to the 20-day EMA ($1,867).
Buyers have pushed XRP (XRP) to the resistance line, which is a crucial near-term level to watch out for.

Sellers are expected to defend the resistance line aggressively because a break and close above it signals a potential trend change. The XRP/USDT pair could rise to $2.60 and subsequently to $3.
If the price turns down from the resistance line but finds support at the moving averages, it suggests that the bulls are buying the dips. The bulls will then again attempt to propel the price above the resistance line. Sellers will have to tug the price below the $2 support to seize control.
BNB (BNB) made a decisive move higher on May 8 and rose above the immediate overhead resistance at $620.

The BNB/USDT pair reached the $644 level on May 9, which is expected to behave as a strong barrier. However, if buyers keep up the pressure and pierce the $644 resistance, the pair could soar to $680.
Time is running out for the bears. If they want to halt the uptrend, they will have to fiercely defend the $644 level and pull the price below the moving averages. The pair could then descend to $580.
Solana (SOL) broke and closed above the $153 resistance on May 8, indicating that the bulls are in charge.

The SOL/USDT pair could reach $180, which is expected to behave as a formidable obstacle. If the price turns down from $180 but rebounds off $153, it suggests that buyers are trying to form a higher low. That enhances the prospects of a rally to $200.
This optimistic view will be invalidated in the near term if the price turns down sharply and plummets below the $140 support. That suggests traders are booking profits at higher levels.
Buyers successfully defended the moving averages and pushed Dogecoin (DOGE) to the overhead resistance at $0.21.

Sellers will try to halt the up move at $0.21, but if the bulls pierce the resistance, the DOGE/USDT pair could rally toward $0.25. If the price turns down from $0.25 but finds support at $0.21, it signals that the bulls have flipped the level into support. That suggests the downtrend could be over.
Contrarily, if the price turns down sharply from $0.21 and breaks below the moving averages, it indicates that the pair may oscillate inside the range for some more time.
Cardano (ADA) bounced off the 50-day SMA ($0.67) and completed an inverse head-and-shoulders pattern on May 8.

The 20-day EMA ($0.69) has started to turn up, and the RSI is in the positive territory, signaling an advantage to buyers. If the price remains above the neckline, the ADA/USDT pair could surge toward the pattern target of $1.01. There is resistance at $0.83, but it is likely to be crossed.
If bears want to prevent the upside, they will have to yank the price below the 50-day SMA. That could sink the pair to $0.60 and eventually to $0.50.
Related: Chance of Bitcoin price highs above $110K in May increasing — Here’s why
Sui (SUI) rallied sharply from the 20-day EMA ($3.29) and climbed above the $3.90 overhead resistance on May 8.

The upsloping 20-day EMA and the RSI near the overbought zone signal that the bulls are in command. If the price maintains above $3.90, the SUI/USDT pair could rally to $4.25 and eventually to $5.
Alternatively, if the price turns down and closes below $3.90, it suggests that the bears are trying to make a comeback. The pair could then slump to the 20-day EMA, which is likely to act as solid support.
Chainlink (LINK) turned up sharply from the 50-day SMA ($13.72) on May 8 and completed an inverse head-and-shoulders pattern.

Sellers are trying to pull the price back below the neckline, but if the bulls successfully hold the level, the LINK/USDT pair could break above the resistance line and rally toward the pattern target of $21.30.
This optimistic view will be negated if the price turns down sharply and breaks below the moving averages. That opens the doors for a fall to $12, indicating that the pair may remain inside the channel for a while longer.
Avalanche (AVAX) bounced off the moving averages on May 8 and reached the overhead resistance of $23.50 on May 9.

Sellers are expected to defend the $23.50 level with all their might because a break and close above the resistance could clear the path for a potential rise to $28.78 and, after that, to $31.73.
On the contrary, if the price turns down sharply from $23.50 and breaks below the moving averages, it suggests that the AVAX/USDT pair may extend its stay inside the range for a few more days.
This article does not contain investment advice or recommendations. Every investment and trading move involves risk, and readers should conduct their own research when making a decision.
The crypto industry has added over $350 billion to its valuation this week. It resulted in the market increasing to $3.25 trillion with an intraday trading volume of $208.55 billion, a change of +72.97%. With this, the Bitcoin price has successfully reclaimed the $103,000 mark and has a valuation of $2.04 trillion.
Following in the footsteps, the top altcoins such as Ethereum and XRP recorded a similar price action by breaking out of their important resistance levels. While XRP price adds approximately 5% to its valuation, Ethereum price records a double-digit surge within hours.
Are you one of many who are planning on investing in these cryptocurrencies but are confused about its price prospects? Scroll down as, in this article, we have uncovered the possible weekly price prediction of the top 3 cryptocurrencies by market cap.
As per the latest data, around $2.65 billion in Bitcoin options are set to expire today. This expiration includes 25,925 contracts, however, this is slightly lesser than last week’s total of 26,949 contracts.
On the other hand, Ethereum is set to witness 164,591 contracts, slightly lower than last week’s 184,296. With a total value of $364.06 million, the maximum pain point for these contracts is $1,850, a put-to-call ratio of 1.43.
The BTC price added 6.84% to its valuation over the past seven days, resulting in it reclaiming the $104K mark. Moreover, with a market capitalization of $2.05 trillion, its market dominance has increased to 62.98% today.
The Relative Strength Index (RSI) surpasses the overbought range in the Bitcoin price chart. Moreover, the SMA indicator acts as a strong support in the 1D time frame, hinting that the largest crypto token may continue gaining momentum next week.
Maintaining the value above its $102,000 mark could set the stage for Bitcoin price to head toward its $105,000 level. Sustained bullish action could push the price toward its $108,000. Conversely, an increase in the bearish action may pull the price toward its low of $98,000.
With the Pectra upgrade, the ETH coin price has regained momentum by adding 25.38% to its valuation over the past seven days. This has resulted in it surpassing the $2,300 mark and retesting its March high. Moreover, with a market cap of $280.07 billion, it has a market dominance of 8.61%.
The Moving Average Convergence Divergence (MACD) displays a constant green histogram since mid-April with its averages recording a similar trend. Furthermore, the 50-day EMA witnesses a positive crossover with its 200-day hovering around the $2,400 mark.
A sustained bullish action could push the price of Ethereum token toward its $2,750 mark. However, if the bears outrun the bulls, the largest altcoin could plunge toward its low of $2,100 in the upcoming time.
With the SEC confirmation, the Ripple price adds just under 5% today. Moreover, with a market cap of $137.76 billion, this project is the 4th most-valued crypto asset in the market.
The Simple Moving Average (SMA) records a positive action in the daily time frame. Furthermore, the MACD indicator displays a similar trend by experiencing a rising green histogram. Moreover, the 12 & 26-day EMA experience a positive convergence, suggesting a positive outlook.
If the bulls outrun the bears, the XRP coin price could retest its important resistance level of $2.50. On the other hand, an intensified bearish action may result in it dropping toward its low of $2.00 in the upcoming time.
Also Read: Bitcoin Price Hits $104K as New Wallet Addresses Flood the Market
Solana Name Service, a domain name service on the Solana (SOL) network, has recently launched the SNS token.
Over the past 24 hours—and nearly two days after the token’s launch—SOL posted a modest gain of 6.9%. This price movement, along with other bullish indicators, has prompted crypto analysts to come out with their latest Solana price predictions, suggesting a possible climb to $500.
While this particular Solana price prediction is one to watch in the coming days, blockchain whales are continuously captivated as JetBolt (JBOLT) wows audiences with its milestones, including stellar presale figures. This fresh zero-gas coin has sold over 350 million tokens so far.
Keep reading to discover the key drivers behind JetBolt’s explosive presale momentum and Solana price forecasts.
Solana Price Forecast: Can the New SNS Token Push SOL to $500?
The Solana Name Service (SNS) token, running on the Solana (SOL) blockchain, recently launched with a bang. The massive airdrop saw over 40% of tokens distributed to early users on May 7, 2025. This newly launched SNS token sparked renewed buying interest and bullish Solana price predictions, with some suggesting SOL could surge to $500.
A number of analysts believe SOL could ride this utility-driven momentum and continue its rally above $160. However, Alejandro Arrieche’s analysis published on FXEmpire suggests that Solana is at a make-or-break moment.
Chart of SOL’s price trend over the past week from CoinMarketCap
While SOL has posted a small uptick to trade above $160, its next major move—such as a $500 breakout—depends on whether it can break through the $180 barrier. If SOL successfully moves beyond $180, Arrieche noted that it could rally to $210.
Other factors that could support Solana’s path to $500 include Bitcoin extending its rally toward $100,000, brought about by easing trade tensions. Another factor is the continued strong performance of Solana meme coins. According to CoinGecko data, the Solana meme market cap jumped 19.2% over the past day.
Still, nothing is set in stone in the volatile crypto market. Analysts warn of downside risks, even SOL potentially falling to the $123 level in the event of a bearish breakout.
JetBolt (JBOLT) Wows Audiences with Remarkable Presale Milestones
While crypto enthusiasts closely monitor Solana’s price action, JetBolt (JBOLT) wows the audience with its latest presale milestone. Since its presale launch, JetBolt has sold over 350 million tokens, amounting to more than $3.2 million in sales.
Beyond such an impressive feat, JetBolt fascinates early buyers and crypto whales with its user-friendly features, one of which is zero-gas technology. JetBolt leverages the Skale network’s gas-free framework to eliminate the typically expensive gas costs associated with blockchain transactions.
JetBolt also boasts a built-in AI-powered crypto insights and news tool. This innovative AI utility displays trending crypto market developments in an easy-to-read format. JetBolt’s AI-driven tool also showcases information on the top-performing cryptocurrencies.
Another revolutionary feature is JetBolt’s crypto-staking platform. This beginner-friendly and socially driven system allows participants to earn additional rewards when they simultaneously stake their JBOLT tokens and interact with friends.
Currently in presale, JetBolt excites early buyers with its captivating perks. Presale buyers can get up to 25% bonus tokens with Alpha Box packages or JBOLT token bundle purchases.
With its user-centric features, outstanding presale achievements, and generous early-bird perks, it’s no wonder JetBolt wows audiences consistently.

Conclusion — Solana Price Projection and JetBolt’s Exciting Presale
The newly launched SNS token breathed new life into the Solana ecosystem, sparking bullish Solana price predictions. While the SNS token launch partly contributed to SOL’s modest price jump, other factors—such as current market conditions—still play a key role in shaping SOL’s price trajectory. Meanwhile, JetBolt continues to electrify the crypto market with its state-of-the-art Web3 features and exciting presale perks.
Learn more about JetBolt’s ongoing presale. Visit the official JetBolt website today.
This article does not constitute financial or crypto trading advice. The crypto market is highly volatile, and all cryptocurrencies carry significant risks. Always perform independent research before making any crypto-related decisions.
The market keeps rising today, according to CoinMarketCap.
Cardano (ADA) is one of the biggest gainers today, rocketing by 8.24%.
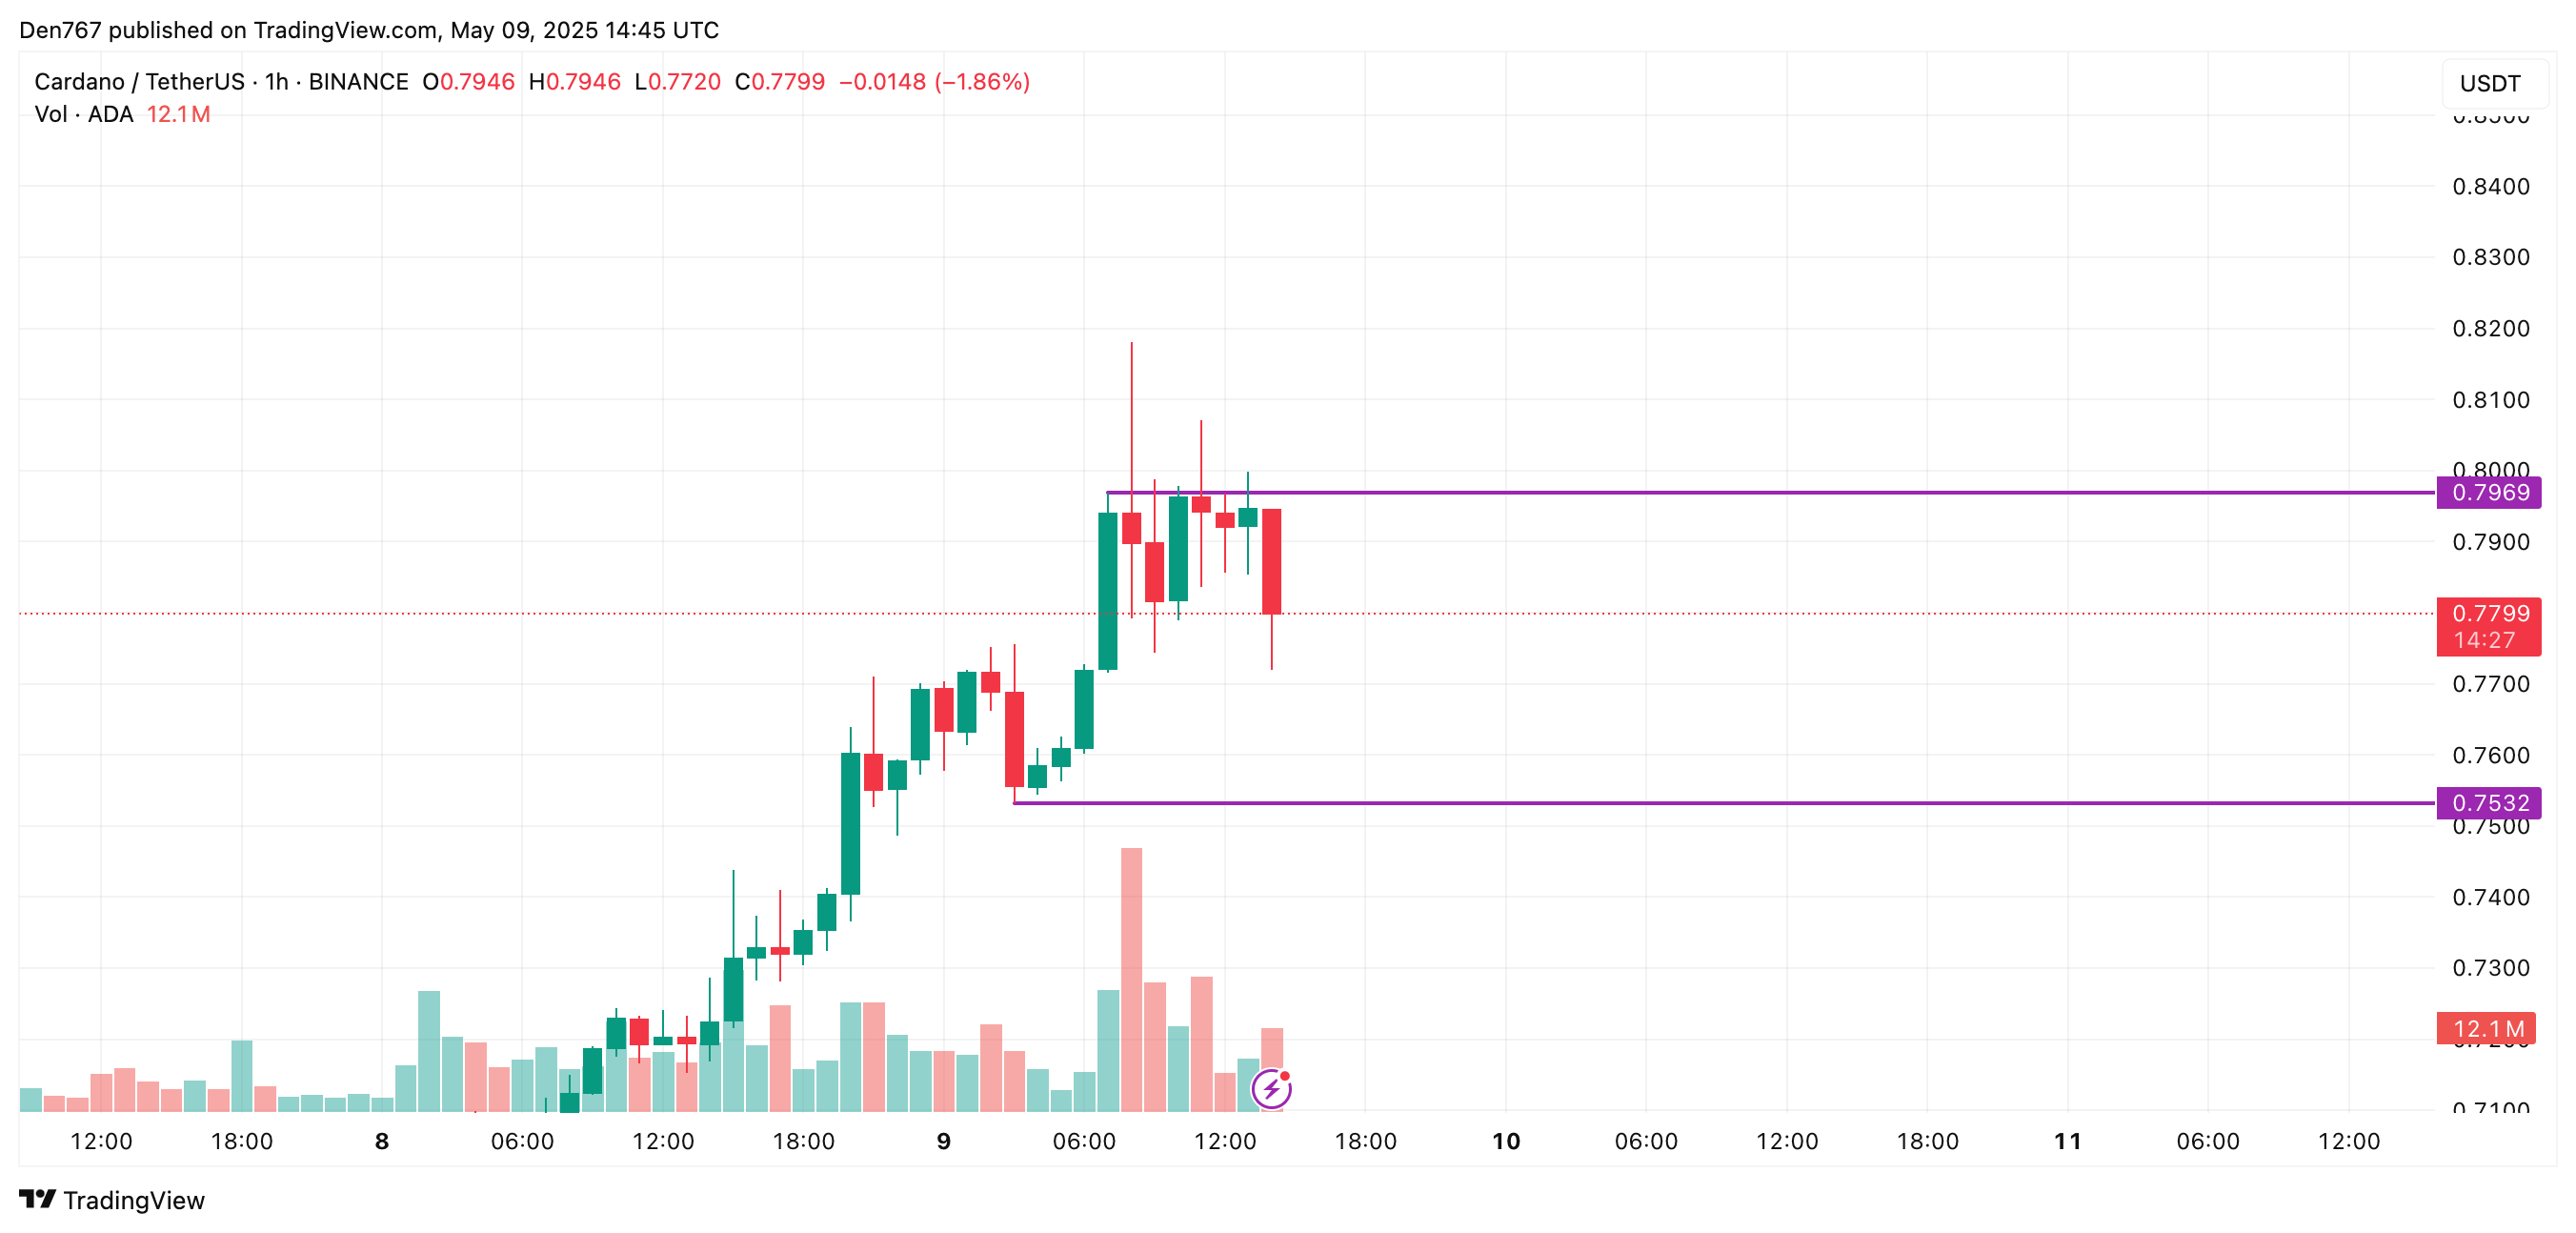
On the hourly chart, the rate of ADA is falling after a false breakout of the resistance of $0.7969. If the daily bar closes far from that level, the correction is likely to continue to the $0.76 mark.
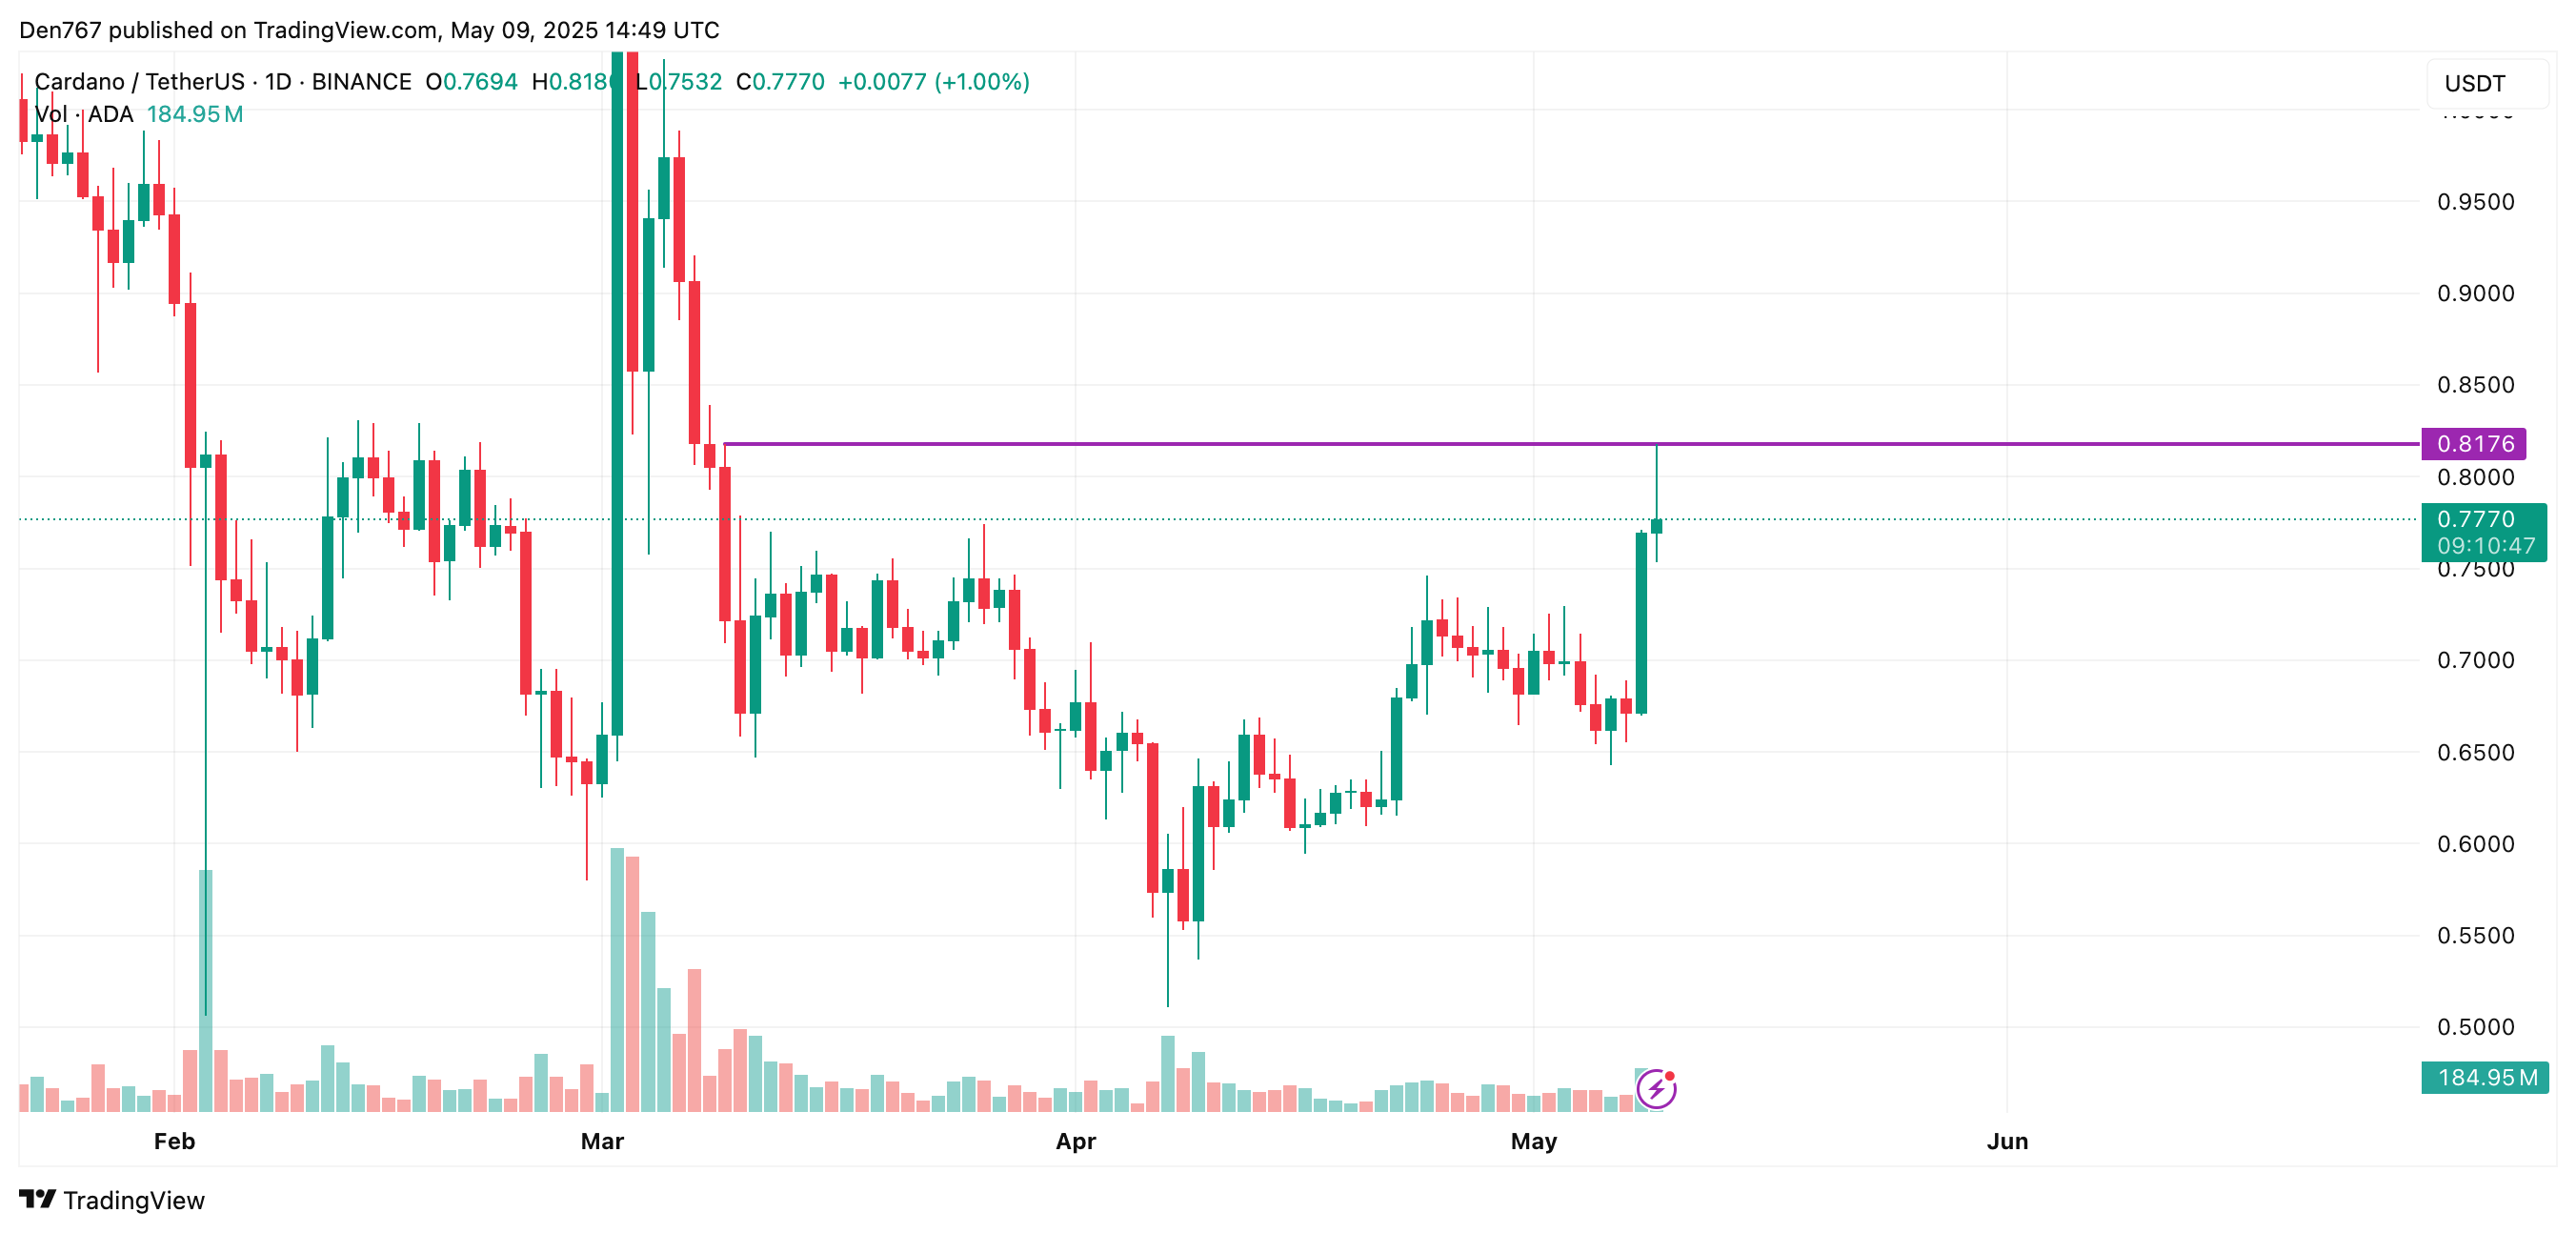
On the bigger time frame, the price of ADA has bounced off the resistance of $0.8176.
You Might Also Like

If the candle closes around current prices, there is a chance to see a correction to the $0.75 zone soon.

From the midterm point of view, one should focus on the weekly bar closure in terms of the $0.7786 level. If it happens around it or above, growth may lead to a test of the $0.85 area.
ADA is trading at $0.7810 at press time.
Ripple’s longstanding legal battle with the U.S. Securities and Exchange Commission (SEC) appears to be nearing its conclusion after both parties agreed to a $50 million settlement.
The joint motion, filed in the Southern District of New York, also seeks to lift Ripple’s injunction and release $125 million in escrowed penalties. If approved by Judge Analisa Torres, this settlement could mark the final chapter in a saga that began in December 2020.
As part of the agreement, Ripple will pay $50 million in penalties, while the remaining $75 million will be returned to the company. The SEC initially sought $2 billion, making the final figure a significant reduction. The XRP lawsuit outcome follows Judge Torres’ prior ruling that XRP sales on public exchanges did not constitute securities transactions—a landmark decision in the broader crypto regulation debate.
The SEC has filed a settlement letter in its lawsuit against Ripple, signaling a potential end to the long-running case. Source: JackTheRippler via X
In tandem with the legal breakthrough, the appointment of Paul Atkins as the new SEC Chair has brought a friendlier tone toward crypto. Atkins, sworn in last month, has pledged to build a “firm regulatory foundation” that allows innovation to flourish. This shift in regulatory climate bodes well for the Ripple ecosystem and the broader crypto market.
Following the legal update, the Ripple XRP price has shown signs of bullish continuation. XRP is currently trading around $2.31, consolidating gains from earlier in the week. Market watchers attribute the uptrend to a combination of legal clarity and a revived risk-on sentiment, further strengthened by the Fed’s decision to hold interest rates steady and President Trump’s recent trade agreements.
According to CoinGecko, the total crypto market cap has climbed to $3.175 trillion, with all top 10 digital assets—including XRP—posting gains. Bitcoin’s surge above $100,000 has reignited optimism across the board, and altcoins like XRP are benefitting from the renewed momentum.
Santiment data reveals a notable uptick in whale accumulation. Addresses holding between 10 million and 100 million XRP have grown their holdings from 10.47% in February to 12.22%—a 1.75% increase that signals growing investor confidence in XRP’s value.
Prominent crypto analyst EGRAG Crypto believes XRP could be on the verge of a significant breakout, with $4.85 as the next target. This prediction stems from historical price models, where XRP has shown the capacity for rapid, parabolic runs in previous market cycles.

A crypto analyst predicts XRP could surge to $4.85, replicating a past rally from its $0.2870 cycle low. Source: EGRAG CRYPTO via X
EGRAG outlined five such historical rallies, the most recent of which saw XRP jump to the $3 range in early 2025—an increase he had already predicted. The next milestone in his model is $4.85, based on a 1,563% rally from XRP’s cycle low of $0.2870. “This rally is coming very soon,” he stated, emphasizing that XRP could replicate its 2020–2021 run in the current market climate.
The analyst also mentioned further upside potential, including a speculative long-term target of $27, should the token mirror its most explosive historical run.
XRP’s current technical setup favors EGRAG’s bullish outlook. The token is fighting a crossover resistance at $2.21 formed by the 50-day and 100-day Exponential Moving Averages. A strong breakout above the region would open the door for a thrust toward $3.00 and then $4.85.
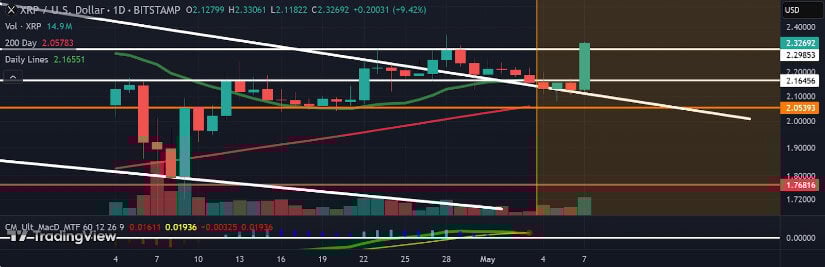
XRP price has recently broken the $2.20 resistance and reclaimed its position above $2.30. Source: Gun45 on TradingView
The Relative Strength Index (RSI) has turned higher above the 70-level, validating short-term bullish momentum. In addition, the Moving Average Convergence Divergence (MACD) line has moved above its signal line, another classic buy signal.
Options and derivatives markets also reflect rising bullish sentiment. Open Interest (OI) for XRP futures has increased by 2.46%, while options OI surged by over 20% in the last 24 hours, suggesting a renewed influx of capital and confidence.
However, not all signals are green. The SuperTrend indicator remains above XRP’s price, signaling potential resistance in the near term. A failure to flip this indicator could lead to a short-term pullback, with potential support levels at $2.21 and $2.00.
Macro factors are also helping shape XRP’s price outlook. The recent limited trade agreement between the U.S. and U.K. has been welcomed by crypto markets, which see it as a sign of economic cooperation and stability under President Trump’s administration. This comes alongside expectations of more pro-crypto trade deals in the coming months.
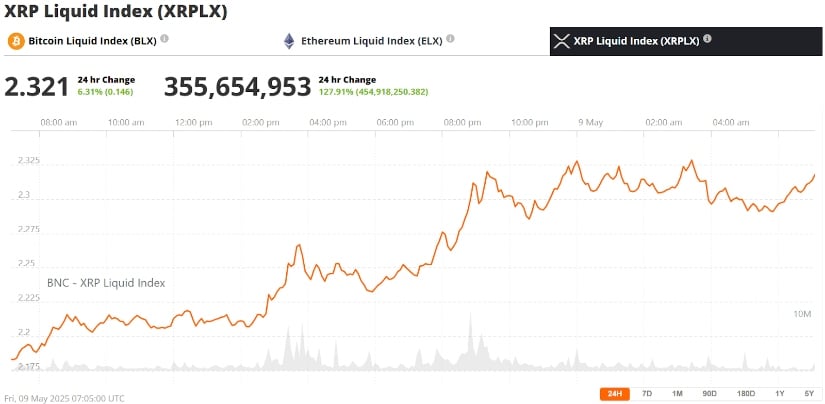
XRP was trading at around $2.32, up 6.31% in the last 24 hours at press time. Source: XRP Liquid Index (XRPLX) via Brave New Coin
Additionally, the Ripple ledger and associated Ripple exchange infrastructure are expected to see increased adoption following the end of the XRP SEC lawsuits. Partnerships, such as the one rumored with Bank of America, may resurface now that regulatory clarity is in sight.
With the Ripple lawsuit nearing resolution and bullish technicals aligning, the XRP price prediction of $4.85 appears increasingly plausible. Although short-term corrections may arise, broader market sentiment, whale accumulation, and improving regulatory clarity all suggest XRP is well-positioned for a major breakout.
As Ripple prepares for its next chapter—potentially aided by renewed institutional interest and strategic partnerships—the Ripple crypto asset may soon reclaim its position as a dominant force in the digital currency landscape.
Jakarta, Pintu News – The price of Solana (SOL) is slowly forming a very bullish chart pattern, which could potentially push its value from around $150 today to nearly $500 in the next few months.
This positive prediction is supported by on-chain data showing that the number of transactions, addresses, and fees on the Solana network is steadily increasing and even surpassing other popular blockchain networks.
Reporting from Coingape (7/5/25), the price of Solana shows volatility in the short term. However, when viewed from a long-term chart, this coin seems to be on the verge of a major breakout, which could potentially bring the price up to $500.
Read also: MOODENG Crypto Soared 91% Today (May 9): What Happened?
The chart below reveals that the SOL has been forming a giant cup and handle pattern since 2021.
The cup and handle pattern is a bullish continuation pattern that consists of three main parts: a rounded bottom, an area of resistance, and a phase of consolidation or temporary decline(pullback). The top of this pattern is around $210, while the bottom of the cup is around $10.
SOL’s current price movement is part of the handle. Therefore, in case of a price breakout above the cup area, it could trigger a bullish breakout towards $462. This price prediction is calculated from the depth of the cup – about 95% – and then measuring the same distance from the highest point of the pattern.
However, this bullish prediction could be invalidated if SOL prices fall below the important support at $94.50, which was its lowest level in April.
Also, it should be noted that this pattern may take months or even years to fully realize – for example, the initial part of the cup took more than four years to form.
Data from Nansen shows that the Solana network is performing extremely well and even outperforming some of the top blockchains in the crypto industry. The number of transactions on the Solana network jumped 48% in the last 30 days, reaching 1.66 billion transactions.
In comparison, Tron (TRX)-the second most active blockchain-processed 249 million transactions, while Ethereum (ETH) recorded only 36 million.

Read also: SOL Strategies Buys $18 Million of SOL: Will Solana’s Bullish Momentum Return?
This surge in transactions was driven by the increasing number of active addresses, mainly due to the trend of multiple meme coins on the Solana network. Active addresses rose 8.2% to 104 million, surpassing the combined active addresses on other major networks.
This high volume of transactions also led to a significant increase in revenue from transaction fees. Fees collected by the network rose 47% to $35 million, making Solana the second most profitable network after Tron.
Additional third-party data shows that the Solana ecosystem is performing solidly, which could help drive price increases in the medium to long term.
The volume of DEX transactions processed by the protocol on the Solana network in the last 30 days reached $76 billion, outperforming Ethereum ($53 billion) and Binance Smart Chain ($30 billion).
In addition, the market capitalization of stablecoins on the Solana network set a new record high of $13 billion, up from $4.7 billion on January 1. The probability of a Solana spot ETF on Polymarket’s prediction platform also increased to 77%, while JPMorgan estimated potential initial inflows of $6 billion.
That’s the latest information about crypto. Follow us on Google News to stay up-to-date on the world of crypto and blockchain technology.
Enjoy an easy and secure crypto trading experience by downloading Pintu crypto app via Google Play Store or App Store now. Get a web trading experience with advanced trading tools such as pro charting, various types of order types, and portfolio tracker only at Pintu Pro. Pintu Pro Futures is also available, where you can buy bitcoin leverage, trade btc futures, eth futures and sol futures easily from your desktop!
*Disclaimer
This content aims to enrich readers’ information. Pintu collects this information from various relevant sources and is not influenced by outside parties. Note that an asset’s past performance does not determine its projected future performance. Crypto trading activities have high risk and volatility, always do your own research and use cold cash before investing. All activities of buying and selling bitcoin and other crypto asset investments are the responsibility of the reader.
Reference:
The Dogecoin price is showing renewed bullish momentum around $0.17 while FloppyPepe (FPPE), an AI-fueled rival, is capturing crypto attention with its 8000% run, posing a challenge to DOGE’s dominance.
As the Dogecoin price hints at a potential breakout, the meme coin market is active, with FloppyPepe (FPPE)’s rapid growth seen as a rival to DOGE’s reign. This meme coin has already recorded massive milestones in its ongoing presale and previous private sale. Investors aiming to capitalize on its 8,000% rally potential can do so by exploring its presale today and accumulating tokens as early as possible.
The recent Dogecoin price activity indicates a strengthening bullish reversal. Buyer interest is returning, shown by a substantial $905 million in daily trading volume. Open interest in DOGE derivatives is also high, suggesting increased market activity with long positions dominating.
Optimism for the Dogecoin price is boosted by renewed speculation about a potential DOGE ETF, which could bring institutional investment. Analysts suggest the Dogecoin price could soon test resistance levels around $0.184 and $0.201, with a longer-term target of $1.12 being considered.
Crypto analyst, Trader Tardigrade, notes that the Dogecoin price daily chart appears to be forming a diamond bottom pattern, suggesting a possible shift from a downtrend to an uptrend for DOGE.
While the DOGE price aims to return to previous highs, FloppyPepe (FPPE) is making its mark with a distinct technological advantage, focusing on an ecosystem designed to improve users’ overall experience. This AI-driven approach features FloppyAI, a dedicated tool for real-time crypto market analysis, providing users with valuable insights.

Furthermore, FloppyPepe (FPPE) integrates Meme-o-Matic, enabling instant viral meme creation directly within the Telegram platform, and FloppyX, facilitating effortless short-form video content generation. The project’s unique approach has also garnered attention from crypto analysts, with Nass Crypto highlighting FloppyPepe’s (FPPE) potential as a standout “AI gem.”
FloppyPepe (FPPE)’s Floppynomics features a pioneering 3% transaction fee structure. This model dedicates 1% to supporting wildlife conservation, 1% is redistributed to token holders as rewards, and 1% is burned. This AI-driven approach, with broader interaction and opposition responsibilities, aims to improve the user experience level compared to most digital assets.
The FloppyPepe (FPPE) presale offers a prime early-stage investment opportunity at just $0.0000002 per token, following an impressive 8,000% run. The project’s initial private sale sold out quickly, raising nearly $1 million, highlighting strong early interest. Early participants in the ongoing presale can still benefit from an 80% bonus using the code FLOPPY80.
This presale structure strongly incentivizes early adoption of FloppyPepe (FPPE), allowing new investors to capitalize on the momentum. Furthermore, the project has undergone a comprehensive SolidProof audit, adding a layer of security and confidence for prospective investors.
The Dogecoin price shows recovery signs, yet its narrative ages as it trails its peak. While DOGE aims for $1.12, FloppyPepe (FPPE), fueled by AI, projects significant upside, already boasting an 8000% gain.
As the meme coin market shifts, AI-powered projects like FloppyPepe (FPPE) gain attention alongside the Dogecoin price recovery efforts, leaving the market to watch which path yields greater gains.
Early participants in the ongoing FloppyPepe (FPPE) presale get an 80% bonus on their purchase by using the code “FLOPPY80” at checkout on the official presale website. This generous offer, launched to reward the growing FloppyPepe (FPPE) community and capitalize on its presale momentum, substantially boosts the potential return for early backers. Capitalize on this chance to join this meme coin’s presale and see it transform into a massive bullish opportunity.
Website | Whitepaper | Telegram | X (Twitter)
Disclaimer: This content is provided by a sponsor. FinanceFeeds does not independently verify the legitimacy, credibility, claims, or financial viability of the information or description of services mentioned. As such, we bear no responsibility for any potential risks, inaccuracies, or misleading representations related to the content. This post does not constitute financial advice or a recommendation and should not be treated as such. We strongly advise seeking independent financial guidance from a qualified and regulated professional before engaging in any investment or financial activities. Please review our full disclaimer for more details.
If XRP becomes the second-largest crypto asset by market cap amid the current market environment, its price will have surged 111%.
The crypto market is currently witnessing a resurgence amid the Bitcoin (BTC) spike above $100,000 yesterday. XRP has followed suit, albeit at a slower pace, soaring over 7% in the past week to change hands at $2.37. This has pushed XRP’s market cap to $138.97 billion at press time, as it maintains the fourth spot among the largest crypto assets.
At the current position, XRP is merely $10.79 billion away from surpassing stablecoin USDT’s $149.76 billion valuation to reclaim the third spot. Notably, with its circulating supply steadying at 58.55 billion tokens, should XRP soar by an additional 8% from the current level to $2.56, it would overtake Tether.
However, the XRP community is more interested in claiming the second spot, as they already expect the asset to reclaim this third spot soon. Since November 2024, XRP has eyed the second position, but despite its massive uptrend, rallying nearly 600% to $3.3 in January 2025, it has failed to reach this milestone.
This is largely due to Ethereum’s comparative increase within this period. While XRP has largely outperformed Ethereum with a 385% gain since November 2024, ETH has observed occasional upsurges that have ensured it maintains its spot as the second-largest crypto asset.
Now, with Ethereum’s impressive 33% spike over the past seven days, as it reclaims $2,400 for the first time since March, the altcoin king has massively increased the gap between its market cap and XRP’s valuation.
Currently, XRP boasts a market cap of $138.97 billion, while Ethereum’s valuation sits at $291 billion. At this position, XRP would need to add a whopping $152 billion to its market cap before it can surpass Ethereum. However, the question remains: by how much must XRP price surge to achieve this feat?
Notably, at the current valuation of $138.97 billion, the XRP price sits at $2.37. For the asset’s valuation to increase by $152 billion to the $291 billion mark, its price must increase to $4.97 or $5, essentially a new all-time high. From the current price, XRP would need to rise by an additional 111% to claim the $5 mark.
Interestingly, multiple analysts have predicted XRP to claim the $5 price. Particularly, in February 2025, market commentator Dark Defender called attention to an ABC correction, suggesting XRP could target $5 to $8 once it is completed. Last December, Vincent Van Code also predicted a rise to $5 in February, but this failed to materialize.
XRP’s journey to $5 might take longer. However, it remains to be seen if Ethereum’s market cap will rise further, demanding a greater price for XRP to eventually surpass it. Notably, XRP was at some point the second-largest asset in the market, especially in 2017. However, it eventually slipped, with ETH gaining ground amid XRP’s seven-year underperformance.
DisClamier: This content is informational and should not be considered financial advice. The views expressed in this article may include the author’s personal opinions and do not reflect The Crypto Basic opinion. Readers are encouraged to do thorough research before making any investment decisions. The Crypto Basic is not responsible for any financial losses.


