The main tag of cryptocurrency price today Articles.
You can use the search box below to find what you need.
[wd_asp id=1]
The main tag of cryptocurrency price today Articles.
You can use the search box below to find what you need.
[wd_asp id=1]
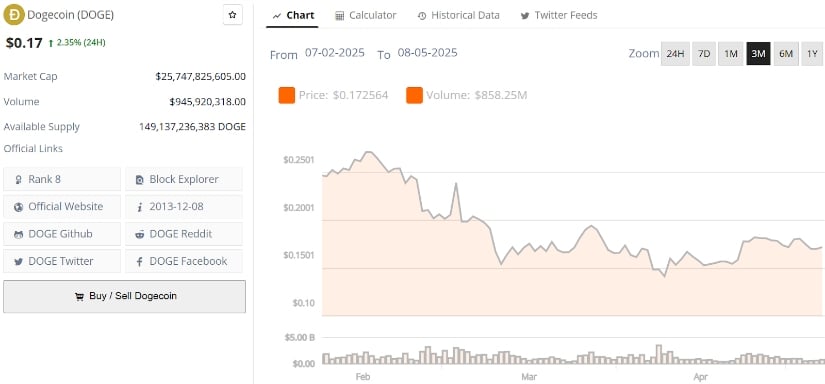
Jakarta, Pintu News – The Dogecoin price has broken through the $0.17 mark again after a 6% increase overnight.
This positive development was triggered by an announcement from China expressing readiness to negotiate a trade deal with the United States in Switzerland later this week.
Dogecoin is currently on the verge of breaking out of a descending wedge pattern, which usually signals a potential price increase.
In addition, other positive sentiments such as increased open interest in Dogecoin and the risk of liquidation of short positions also support DOGE’s chances of breaking the $0.20 mark this week.
Dogecoin is trying to bounce back after previously printing a daily low around $0.1641. However, thanks to the V-shaped reversal, DOGE showed a positive recovery.
Read also: Dogecoin Price Soars Today (May 8): What is the DOGE Prediction Now?
Currently, Dogecoin is still trapped in a descending wedge pattern on the 4-hour chart. This pattern has formed over the past two weeks as the DOGE price trend has narrowed.
The lower boundary of the pattern is defined by the lowest swing since April 2022, while the resistance line is formed from the price peaks on April 26 and May 2.
Currently, Dogecoin is struggling bullishly to break the 200 EMA line which is near the 61.80% Fibonacci level at $0.1729. The high selling pressure made it difficult for DOGE to form its fourth consecutive bullish candle.
However, a positive cycle has started within the wedge pattern, indicating a potential retest of the upper boundary of the pattern. This sudden recovery also reduces the likelihood of a “death cross” pattern between the 50 and 200 EMA lines.
The MACD technical indicator also shows a positive signal with an upward crossover, signaling a potential trend reversal. Dogecoin price predictions from this wedge pattern breakout point to a psychological target of $0.20.
Furthermore, the growing bullish sentiment towards Dogecoin could extend the uptrend. Based on Fibonacci levels, the next price targets are at $0.2299 and $0.2673.
The meeting between the United States and China that will be held on Sunday to renegotiate trade agreements and high tariffs has increased positive sentiment in the US market. As a result, major altcoin markets have seen a recovery, including price spikes in memecoins like Dogecoin.
If both parties manage to reach a new trade deal, then a recovery in global and crypto markets is highly likely. This could potentially push the Dogecoin price beyond the $0.20 mark.
In addition, the market is generally looking forward to the outcome of the FOMC meeting on May 7, which is expected to keep the benchmark interest rate fixed.
This decision may spark short-term volatility in the crypto market, but once clarity is achieved, Dogecoin has a chance to rally again.
Recently, DogeOS received $6.9 million in funding from Polychain. This funding has again lifted the positive sentiment towards Dogecoin amidst a resurgent memecoin market.
Read also: Dogecoin to the Moon? Analysts Predict 105% Spike Amid ETF Speculation!
Historically, Dogecoin price trends have often reflected short-term spikes in line with improved sentiment. Therefore, this latest funding could be a catalyst for DOGE to reach a price of $0.20.
As Dogecoin gradually rallied, the derivatives market showed increasingly bullish signals towards it. DOGE’s open interest rose by 1.45% to reach $1.69 billion, reflecting traders’ increasing interest in Dogecoin.

In addition, the open interest ratio also rose to 0.0071%, indicating increased positive sentiment among investors. With the dominance of bulls starting to show in the derivatives market, the risk of liquidation of short positions has also increased.
Based on the DOGE exchange liquidation map, Dogecoin could potentially experience a massive $10.96 million short liquidation if the price reaches $0.1755.
If the price continues to rise to $0.1761, the liquidation risk could jump to $13.65 million, which could push the price of DOGE even higher.
That’s the latest information about crypto. Follow us on Google News to stay up-to-date on the world of crypto and blockchain technology.
Enjoy an easy and secure crypto trading experience by downloading Pintu crypto app via Google Play Store or App Store now. Get a web trading experience with advanced trading tools such as pro charting, various types of order types, and portfolio tracker only at Pintu Pro. Pintu Pro Futures is also available, where you can buy bitcoin leverage, trade btc futures, eth futures and sol futures easily from your desktop!
*Disclaimer
This content aims to enrich readers’ information. Pintu collects this information from various relevant sources and is not influenced by outside parties. Note that an asset’s past performance does not determine its projected future performance. Crypto trading activities have high risk and volatility, always do your own research and use cold cash before investing. All activities of buying and selling bitcoin and other crypto asset investments are the responsibility of the reader.
Reference:
As the XRP price takes center stage, bold predictions about its future outlook persist across online forums and social media. Among the most ambitious claims is the idea that the XRP price could skyrocket to $1,000 or even beyond. In response to these projections, a crypto analyst has outlined several key factors that would need to align for XRP to reach such a target.
Factors Needed To Take The XRP Price To $1,000
While it’s tempting to imagine XRP hitting a four-digit price target, X (formerly Twitter) crypto analyst Jasmin argues that the numbers don’t support such a prediction. For the XRP price to reach $1,000, it would need to climb as high as 46,848%, accompanied by key factors like a significant rise in global adoption, especially by financial institutions.
Although Ripple, a blockchain company, has made progress in partnering with global banks and fintech firms for cross-border payments, that level of adoption is still nowhere near enough to support a $1,000 XRP price tag. To even approach this level, XRP would need to become a fundamental part of the global financial structure across different sectors, particularly in banking, remittance, and investment.
But beyond simple adoption, XRP would have to be deeply integrated into major economies in such a way that it becomes an indispensable currency for daily transactions. For this to happen, Jasmin reveals that the cryptocurrency would need widespread regulatory clarity to ensure that it can be used in multiple jurisdictions without any legal barriers.
The ongoing legal battle between Ripple and the US SEC has already created years’ worth of uncertainty around XRP’s legal status. Until this issue is resolved favorably, the cryptocurrency’s potential for mainstream adoption remains limited.
Jasmin has also highlighted that XRP would have to incorporate mechanisms that would drastically reduce its circulating supply. While the cryptocurrency’s price could grow with more aggressive token burns, a jump to $1,000 still seems unlikely. Such a high valuation would also need massive speculative trading activities, which are usually seen during bull markets.
How Market Cap Influences A $1,000 Projection
Based on Jasmin’s analysis, the most significant factor that makes a $1,000 XRP price projection unrealistic is its market capitalization. Currently, XRP has a market cap of about $125.15 billion, and for its price to hit a four-digit level, its total market valuation would need to reach $50 trillion.
To put this in perspective, the global crypto market capitalization today is $3.09 trillion, according to CoinGecko data. This would mean that XRP alone would need a market cap over 15x higher than the entire crypto market.
Furthermore, Bitcoin, the largest cryptocurrency, has never even come close to reaching a $10 trillion market cap. BTC’s market valuation currently sits at $1.92 trillion, meaning XRP would have to surpass it by over 25x to get a $50 trillion market cap.
Due to these extreme market cap requirements, Jasmin argues that a $1,000 or even $10,000 target is highly unrealistic. However, she acknowledges that a price surge to $5 or even $10 is a far more attainable goal.
The market is bouncing back today, according to CoinStats.CoinStats”>
The price of Bitcoin ![]() BTCUSD has risen by 3.28% since yesterday.TradingView”>
BTCUSD has risen by 3.28% since yesterday.TradingView”>
On the hourly chart, the rate of BTC is in the middle of the local channel, between the support of $96,226 and the resistance of $97,717.
As most of the daily ATR has been passed, there are low chances to expect sharp moves by tomorrow.TradingView”>
On the bigger time frame, the situation is bullish. The price is about to break the resistance of $97,470. If it happens and the bar closes above that mark and with no long wick, the rise may continue to the $98,000 mark.TradingView”>
From the midterm point of view, traders should focus on the $98,871 level. If the weekly candle closes above it, the accumulated energy might be enough for a test of the $100,000 range.
Bitcoin is trading at $97,458 at press time.
Dogecoin (DOGE), the original meme coin, is once again at the center of crypto market discussions as its price tests a crucial resistance near $0.1750.
After rebounding from last week’s low around $0.1680, Dogecoin is now showing signs of consolidation, with bulls and bears in a temporary standoff. A decisive breakout from this range could pave the way for a 14% surge, reigniting hopes for a rally toward the $0.20 psychological threshold.
Dogecoin is currently trading around $0.1730, reflecting a modest recovery from its recent dip. According to Coinglass and TradingView data, DOGE remains locked in a tight trading range, with key exponential moving averages (20, 50, 100, and 200-period) all converging between $0.1716 and $0.1738 on the 4-hour chart. This confluence is forming a compression zone under the $0.1750 resistance band.
DOGE has broken a 4-year consolidation, now resting on breakout support with an oversold weekly RSI—summer could be explosive. Source: Djvybe on TradingView
“The structure signals indecision,” analysts noted, “but a breakout above this zone with strong volume could flip short-term sentiment bullish.”
Technical indicators like the MACD and RSI support this thesis. The MACD hovers just above the zero line, showing a narrow bullish bias, while the RSI remains near 58, indicating mild upward momentum without reaching overbought levels. A breakout above $0.1750 could target $0.18 and $0.1850, while failure to breach it may bring DOGE back to $0.1675 or lower.
A prominent falling wedge pattern has formed on the Dogecoin chart since late April, connecting a series of lower highs and gradually narrowing the price range. This pattern is typically considered bullish and often precedes upward breakouts.

Dogecoin (DOGE) price has formed a falling wedge pattern on the daily and weekly charts. Source: VariousPear5953 on TradingView
The Dogecoin price analysis highlights that bulls recently defended the wedge’s lower boundary, leading to a small rally from $0.1680. Moreover, DOGE has seen a price rejection at levels below the 200-day simple moving average, further hinting at a potential upward reversal.
If Dogecoin breaks the upper trendline of the falling wedge, analysts expect a 14% rally that could take the DOGE price as high as $0.20. However, any rejection at resistance could cause a revisit to the $0.1560 Fibonacci support level.
In the derivatives space, sentiment has begun to shift in favor of the bulls. Coinglass data shows that long positions on DOGE have climbed to 51.83% in recent hours, pushing the long-to-short ratio to 1.076. The funding rate, which briefly dipped into negative territory, has now returned to neutral and is poised to turn positive.
This dynamic suggests that Dogecoin investors are increasingly confident about a bullish move. If DOGE manages to break above $0.1750, a short squeeze could occur, liquidating nearly $14.18 million in short positions and amplifying upward pressure on the token.
Such liquidations would not only support Dogecoin’s prediction of hitting $0.20 but also signal a major sentiment shift in the Dogecoin network.
Despite bullish signals, Dogecoin faces a slight headwind from a scheduled token unlock. Nearly 97.89 million DOGE tokens—worth about $16.57 million—will be released over the coming week, equivalent to 0.07% of the total circulating supply.
Dogecoin (DOGE) was trading at around $0.1730, up 2.35% in the last 24 hours at press time. Source: Brave New Coin
Though such a supply increase might seem significant, analysts suggest it is unlikely to cause major price disruption. The unlock is part of a linear release schedule and not expected to overwhelm market demand.
“The release is minor in context,” one trader noted. “It shouldn’t challenge the current Dogecoin rise unless paired with external bearish catalysts.”
Another unique factor influencing DOGE’s market behavior is the broader political and social backdrop. Historically, Dogecoin and other meme coins have surged during periods of political unrest or market uncertainty.
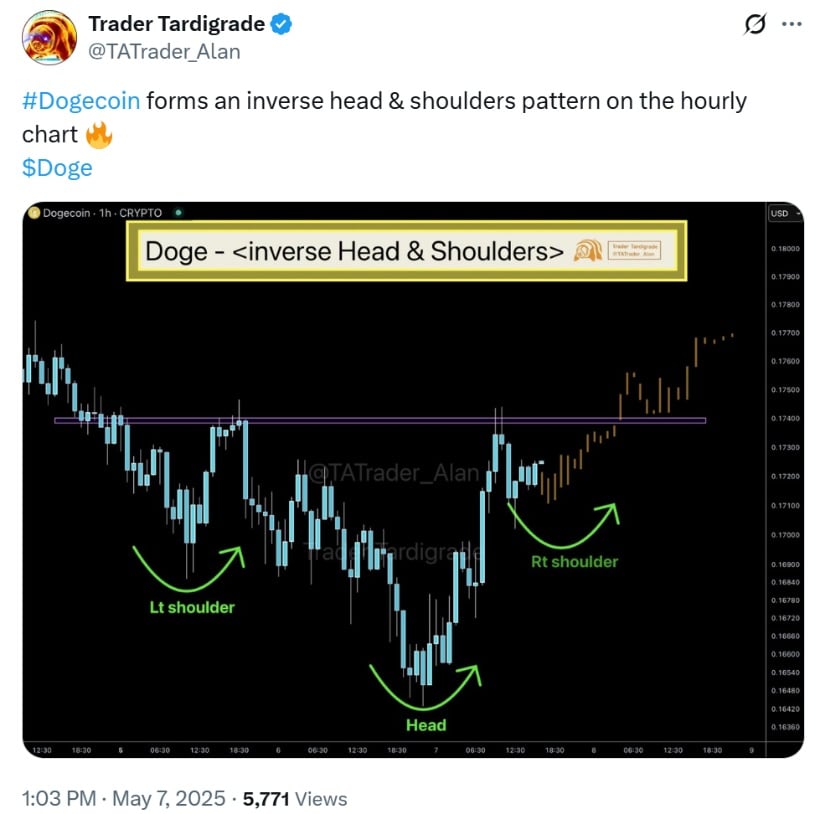
Dogecoin is forming an inverse head and shoulders pattern on the hourly chart, signaling a potential bullish reversal. Source: Trader Tradingrade via X
The renewed Dogecoin buzz follows rising global tensions and increased political debate around crypto regulation. According to market watchers, meme coins tend to thrive during such times as retail investors seek alternative assets with high upside potential.
Dogecoin prediction models suggest that if macroeconomic and political conditions continue to stir volatility, meme coins like DOGE could become short-term favorites once again. This was echoed by recent social media trends and Google search spikes for Dogecoin news and forecasts.
The near-term Dogecoin challenge is straightforward: reclaim and hold above the $0.1750 resistance. A close above that level, supported by volume, could quickly drive prices toward $0.18 and potentially $0.1850. Intraday momentum could also receive a boost if the 15-minute chart confirms a breakout above $0.1743.
On the downside, failure to hold $0.17 would likely pull DOGE back toward $0.1675 and test support at $0.1640.
While the current setup reflects compression and indecision, the convergence of bullish technical signals, growing derivatives optimism, and strong trading volume puts Dogecoin in a favorable position heading into May 8.
“Dogecoin has always been unpredictable,” one analyst concluded. “But when volume rises and the crowd gets involved, DOGE tends to surprise on the upside.”
Key points:
Bitcoin price hangs near $97,000 as traders await today’s FOMC minutes.
Bitcoin holding $95,000 as support is key for bullish price expansion in the short term.
Select altcoins are holding their respective support levels, opening the gates for a short-term rally.
Bitcoin (BTC) bulls are trying to knock down the immediate resistance at $97,895 and challenge the all-important $100,000 level. Crypto analytics platform Santiment said in a post on X that Bitcoin wallets holding between 10 and 10,000 Bitcoin are positive about further gains as they have acquired 81,338 Bitcoin over the past six weeks.
Investors have also been piling into BlackRock’s spot Bitcoin exchange-traded fund for the past 16 days, which has boosted its new capital inflows to about $4.7 billion, according to ETF Store President Nate Geraci.
Bloomberg ETF analyst Eric Balchunas also suggested that the spot Bitcoin ETF “will have triple gold’s ETF assets under management in 3 to 5 years.”
According to Bitfinex data, Bitcoin must hold above $95,000 to signal a “structural shift” into bullish territory, opening the doors for a rally to an all-time high. However, if the $95,000 level cracks, the analysts expect Bitcoin to witness a deeper correction.
Could Bitcoin challenge the $100,000 resistance? Are select altcoins showing signs of a short-term up move? Let’s analyze the charts of the top 10 cryptocurrencies to find out.
Bitcoin rebounded off the 20-day exponential moving average ($93,091) on May 6, indicating that the sentiment remains positive and traders are buying on dips.

There is minor resistance at $97,895, but if the level is crossed, the BTC/USDT pair could challenge the psychological resistance at $100,000. Sellers are expected to vigorously defend the level because a break above it could propel the pair to $107,000.
Time is running out for the bears. If they want to make a comeback, they will have to sink and sustain the price below the 20-day EMA. If they succeed, the pair could tumble to the 50-day simple moving average ($87,441).
The bears are struggling to pull Ether (ETH) below the moving averages, indicating a lack of selling at lower levels.

Buyers will try to take advantage of the situation and push the price above the immediate resistance at $1,873. If they do that, the ETH/USDT pair could pick up momentum and soar toward $2,111. There is minor resistance at $1,957, but it is likely to be scaled.
Sellers are likely to have other plans. They will try to tug the price below the moving averages, opening the gates for a fall to $1,537. Buyers will try to defend the $1,537 level, but if they fail in their endeavor, the pair may collapse to the vital support at $1,368.
XRP (XRP) fell below the moving averages on May 4, but the bears could not sink the price to the $2 support.

The flattish moving averages and the RSI just below the midpoint suggest that the XRP/USDT pair may remain stuck between the resistance line and the $2 support for some more time.
A break and close above the resistance line signals a potential trend change. The pair could then rally toward $3. Conversely, a break and close below $2 opens the gates for a collapse to the $1.72 to $1.61 support zone.
The failure of the bears to sustain BNB (BNB) below the moving averages indicates demand at lower levels.

The bulls will have to try and overcome the barrier at $620 to clear the path for a rally to the strong overhead resistance at $644. Sellers will try to halt the recovery at $644, but if the bulls prevail, the next stop could be $680.
This positive view will be invalidated in the near term if the BNB/USDT pair turns down and breaks below the $576 support. That heightens the risk of a fall to $520. Buyers are expected to aggressively defend the $500 to $520 zone.
Solana (SOL) is finding support at the moving averages, signaling a positive sentiment where dips are being purchased.

The bulls will try to strengthen their position by pushing the price above the $153 resistance. If they can pull it off, the SOL/USDT pair could climb to $180 and then to $200. That signals the pair may swing inside the large $110 to $260 range for a while.
Sellers will have to drag the price below the 20-day EMA to prevent the upside. The pair could then tumble to the 50-day SMA ($133). That indicates a consolidation between $110 and $153 for a few days.
Dogecoin (DOGE) has been clinging to the moving averages, signaling a balance between supply and demand.

If the price closes below the moving averages, the bears will try to pull the DOGE/USDT pair to the support of the range at $0.14. The bulls will attempt to keep the pair inside the range by buying near $0.14.
On the upside, buyers will have to drive and maintain the price above $0.21 to suggest a short-term trend change. The pair could rally to $0.25 and subsequently to the pattern target of $0.28.
Cardano (ADA) is witnessing a tough battle between the buyers and sellers near the moving averages.

The flattish moving averages and the RSI near the midpoint do not give a clear advantage either to the bulls or the bears. If the price moves up from the current level, it is expected to face selling at $0.75. A break and close above $0.75 could propel the pair to $0.83.
On the downside, there is solid support at $0.58. If the price rebounds off $0.58, the ADA/USDT pair could form a range. Sellers will seize control on a break below the $0.58 support. The pair may then descend to the $0.54 to $0.50 support zone.
Related: Can XRP price reach $4 in May? Analysts are watching these key levels
Sui (SUI) rebounded off the 20-day EMA ($3.14) on May 6, indicating that lower levels are attracting buyers.

There is minor resistance at $3.50, but if it is crossed, the SUI/USDT pair could ascend to $3.90. Sellers are expected to defend the $3.90 level with all their might because a break above it could propel the SUI/USDT pair to $4.25 and eventually to $5.
Instead, if the price turns down and breaks below the 20-day EMA, it suggests that the bulls are rushing to the exit. The pair risks dropping to the solid support at $2.86 and then to the 50-day SMA ($2.61).
Chainlink (LINK) is finding support at the 50-day SMA ($13.66), but the failure to start a strong rebound suggests the bears have kept up the pressure.

If the 50-day SMA gives way, the LINK/USDT pair could slump to $11.68. Buyers will try to defend the level, but the relief rally is likely to face selling at the moving averages. If the price turns down from the moving averages, the pair could fall to the support line of the descending channel.
Contrarily, if the price turns up from the current level and maintains above the 20-day EMA ($13.99), the pair could rally toward the resistance line. Buyers will have to pierce the resistance line to signal that the downtrend could be over.
Avalanche (AVAX) has slipped below the 50-day SMA ($19.90), indicating that the range-bound action could continue for a few more days.

If the price skids below $18.50, the AVAX/USDT pair could drop to the support of the range at $15.27. Buyers are expected to aggressively defend the $15.27 level, as a break below it may resume the downtrend.
Alternatively, a bounce off the current level suggests the bulls are trying to keep the pair inside the upper half of the range. Buyers will have to drive the price above $23.50 to start an up move to $28.78 and then to the pattern target of $31.73.
This article does not contain investment advice or recommendations. Every investment and trading move involves risk, and readers should conduct their own research when making a decision.
Solana (SOL) is showing all the indications of an imminent breakout, with on-chain metrics pointing to high-pressure whale and institutional investor accumulation. Currently trading at approximately $145, SOL is gaining momentum as its lightning-fast network and growing DeFi landscape attract new interest. Analysts now predict a potential sprint to $300 and beyond if market sentiment aligns. All the while, in the background, Mutuum Finance (MUTM) is gathering steam as a lesser-known but closely watched altcoin, one already being spoken of by some as Solana’s breakout sidekick during the next bull wave.
Solana (SOL) moves about $145, but according to market observers as well as on-chain patterns, that should and will indeed be changed shortly. With institutionally deep pockets constantly accumulating money and DeFi utilization increasing, SOL’s fundamentals appear primed to thrust it into the range of $250–$300 levels by 2025-end. Network speed and accelerated progress in its transaction space only strengthen the stake of a league-1 category for Solana. While volatility may still keep on bringing short-term fluctuations, the smart money is firmly betting on a breakout. Meanwhile, emerging altcoins like Mutuum Finance (MUTM) are being quietly watched as potential next-in-line runners.
Mutuum Finance is selling for a mere $0.025 in Phase 4 of its presale and already making waves with its hectic pace. Over $7.7 million has been raised from more than 9,500 investors. With a Phase 5 price increase to $0.03 and an estimated public listing price of $0.06, Phase 4 investors could be looking at a 140% return before the token even lists on exchanges. That kind of upfront potential is catching serious attention, not just from retail investors but also from Ethereum whales quietly buying up behind the scenes.
Mutuum Finance is taking a bold step in the DeFi market with a hybrid lending framework that incorporates the best features of Peer-to-Contract and Peer-to-Peer functionality. The architecture allows for passive returns by way of smart contract-managed pools as well as peer-to-peer lending between users for increased discretion and control. It’s an adaptive, dual-lane approach to borrowing and lending that’s not typical of decentralized finance.
To make it more attractive, Mutuum Finance has recently introduced a leaderboard gamified in the form of a top 50 token holders leaderboard. Such users are eligible for additional rewards, thereby creating a competitive atmosphere that encourages long-term holding as well as community engagement. The platform has also partnered with CertiK on a full smart contract audit, increasing investor confidence and transparency.
One of Mutuum Finance’s features is its mtToken program, which allows users to earn yield on tokenized assets like ETH and DAI without necessarily locking them up. This stands in stark contrast to typical staking protocols in which liquidity gets sacrificed for the sake of passive returns. Complementing this is a sensible loan-to-value framework, such as $5,000 lent against $7,000 value of ETH, for a safe-borrowing environment.
Solana’s breakout toward $300 may be inevitable, but smart money isn’t just watching SOL. Mutuum Finance (MUTM) is quickly becoming the quiet favorite among altcoin insiders, thanks to its innovative DeFi model, smart tokenomics, and early-stage upside. With Phase 4 priced at just $0.025, and a 20% price hike looming in Phase 5, this could be your last chance to buy before momentum drives it out of reach. $7.7M raised, 9,500+ investors onboard, and rising fast. If you missed Solana at $1, don’t miss Mutuum Finance now. Secure your MUTM tokens today before Phase 4 sells out and you’re left watching from the sidelines.
For more information about Mutuum Finance (MUTM) visit the links below:
Website: https://www.mutuum.finance/
Linktree: https://linktr.ee/mutuumfinance
DISCLAIMER – “Views Expressed Disclaimer: This article is not financial advice. Cryptocurrencies are volatile and unpredictable. Due diligence and caution are paramount. Views and opinions expressed are those of the authors and do not reflect the official position of any other author, agency, organization, employer or company, including NEO CYMED PUBLISHING LIMITED, which is the publishing company performing under the name Cyprus-Mail…more
Bulls are coming back to the game after a few days of market drop, according to CoinMarketCap.
The price of XRP has risen by 2.43% over the last 24 hours.
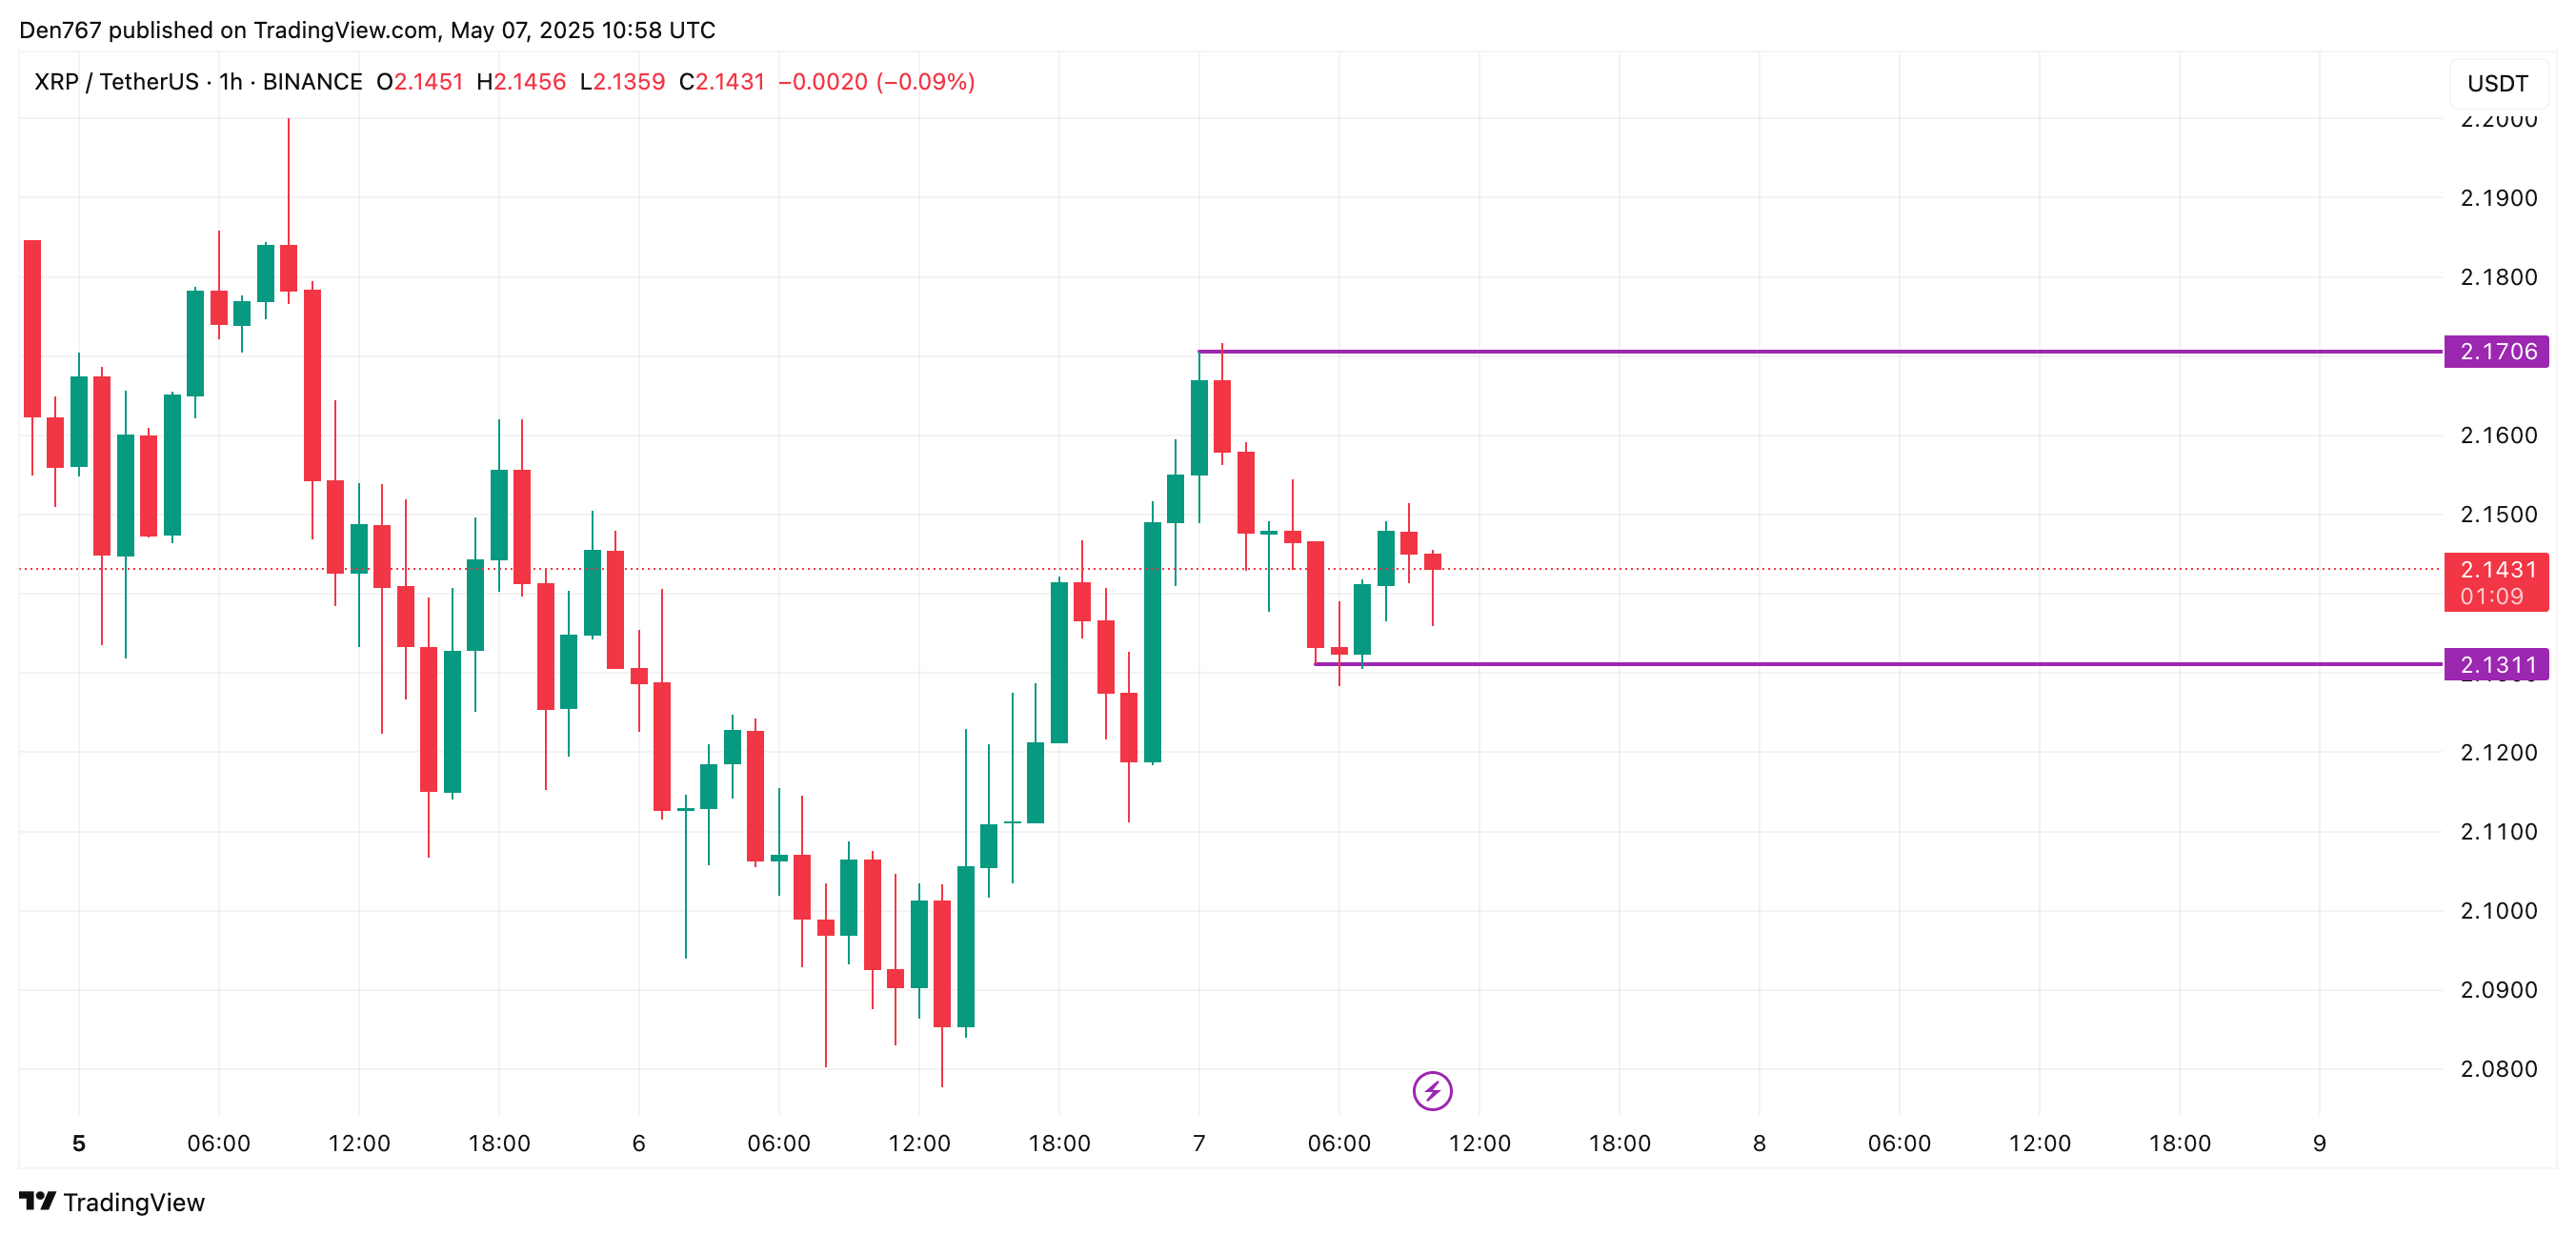
On the hourly chart, the rate of XRP is closer to the local support than to the resistance.
You Might Also Like

If buyers cannot seize the initiative by the end of the day, traders may expect a level breakout, followed by a test of the $2.12 area.
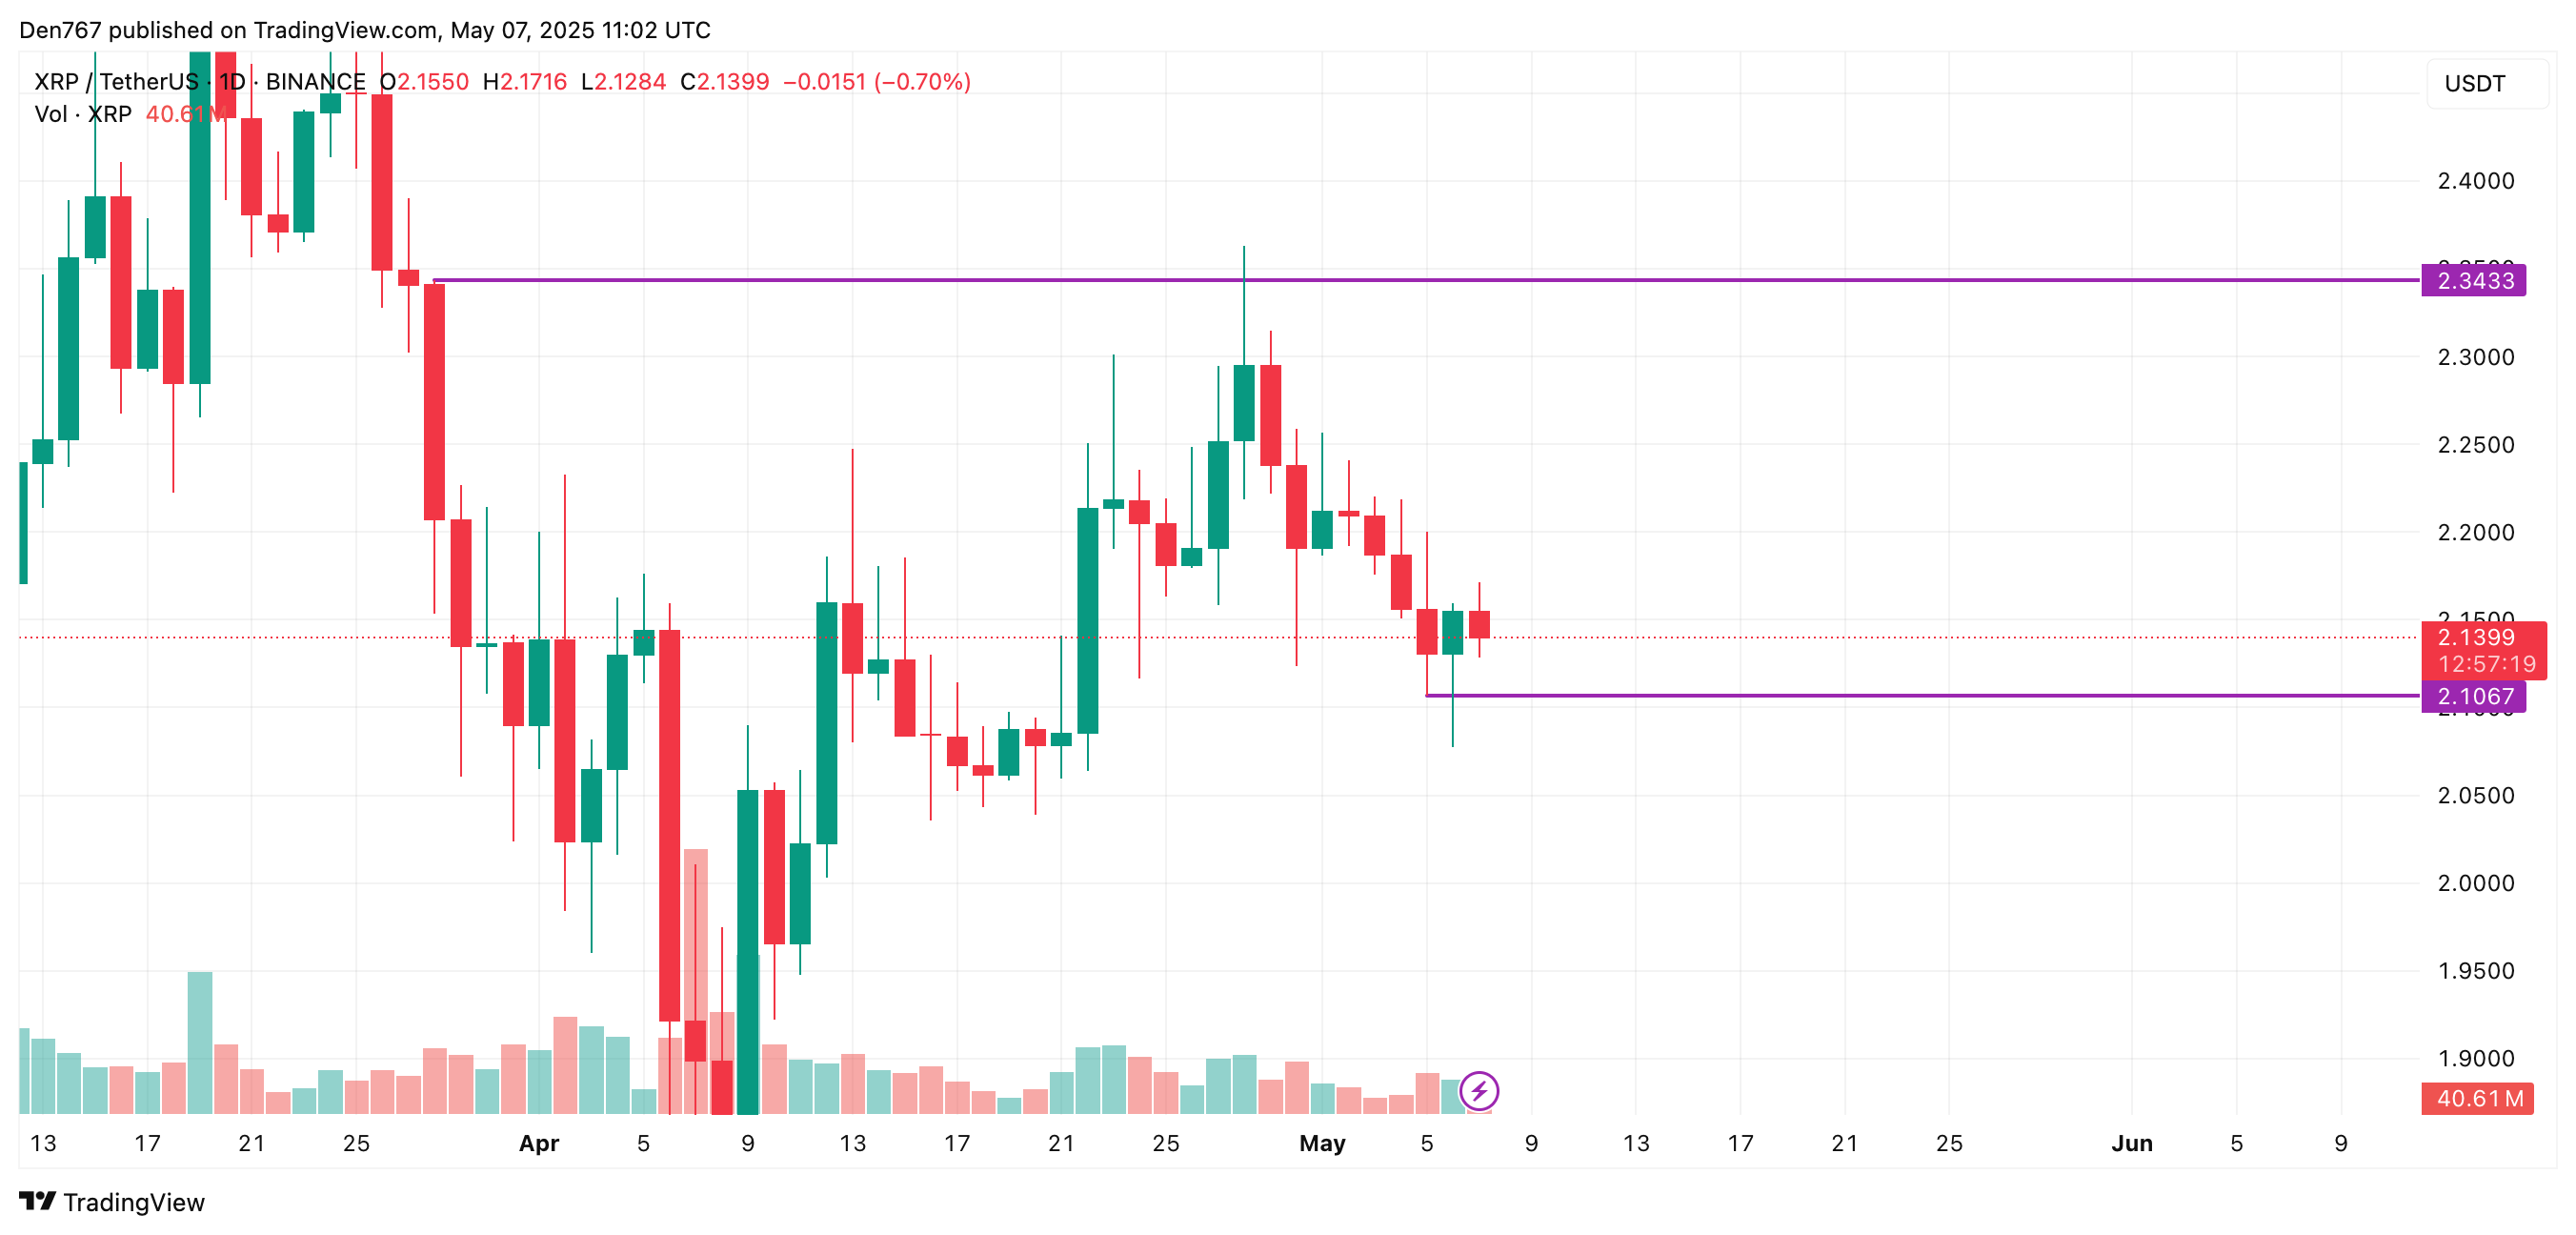
A bearish picture can also be seen on the daily time frame. If the candle closes around current prices or below, the accumulated energy might be enough for a support breakout, followed by a test of the $2.10 area.
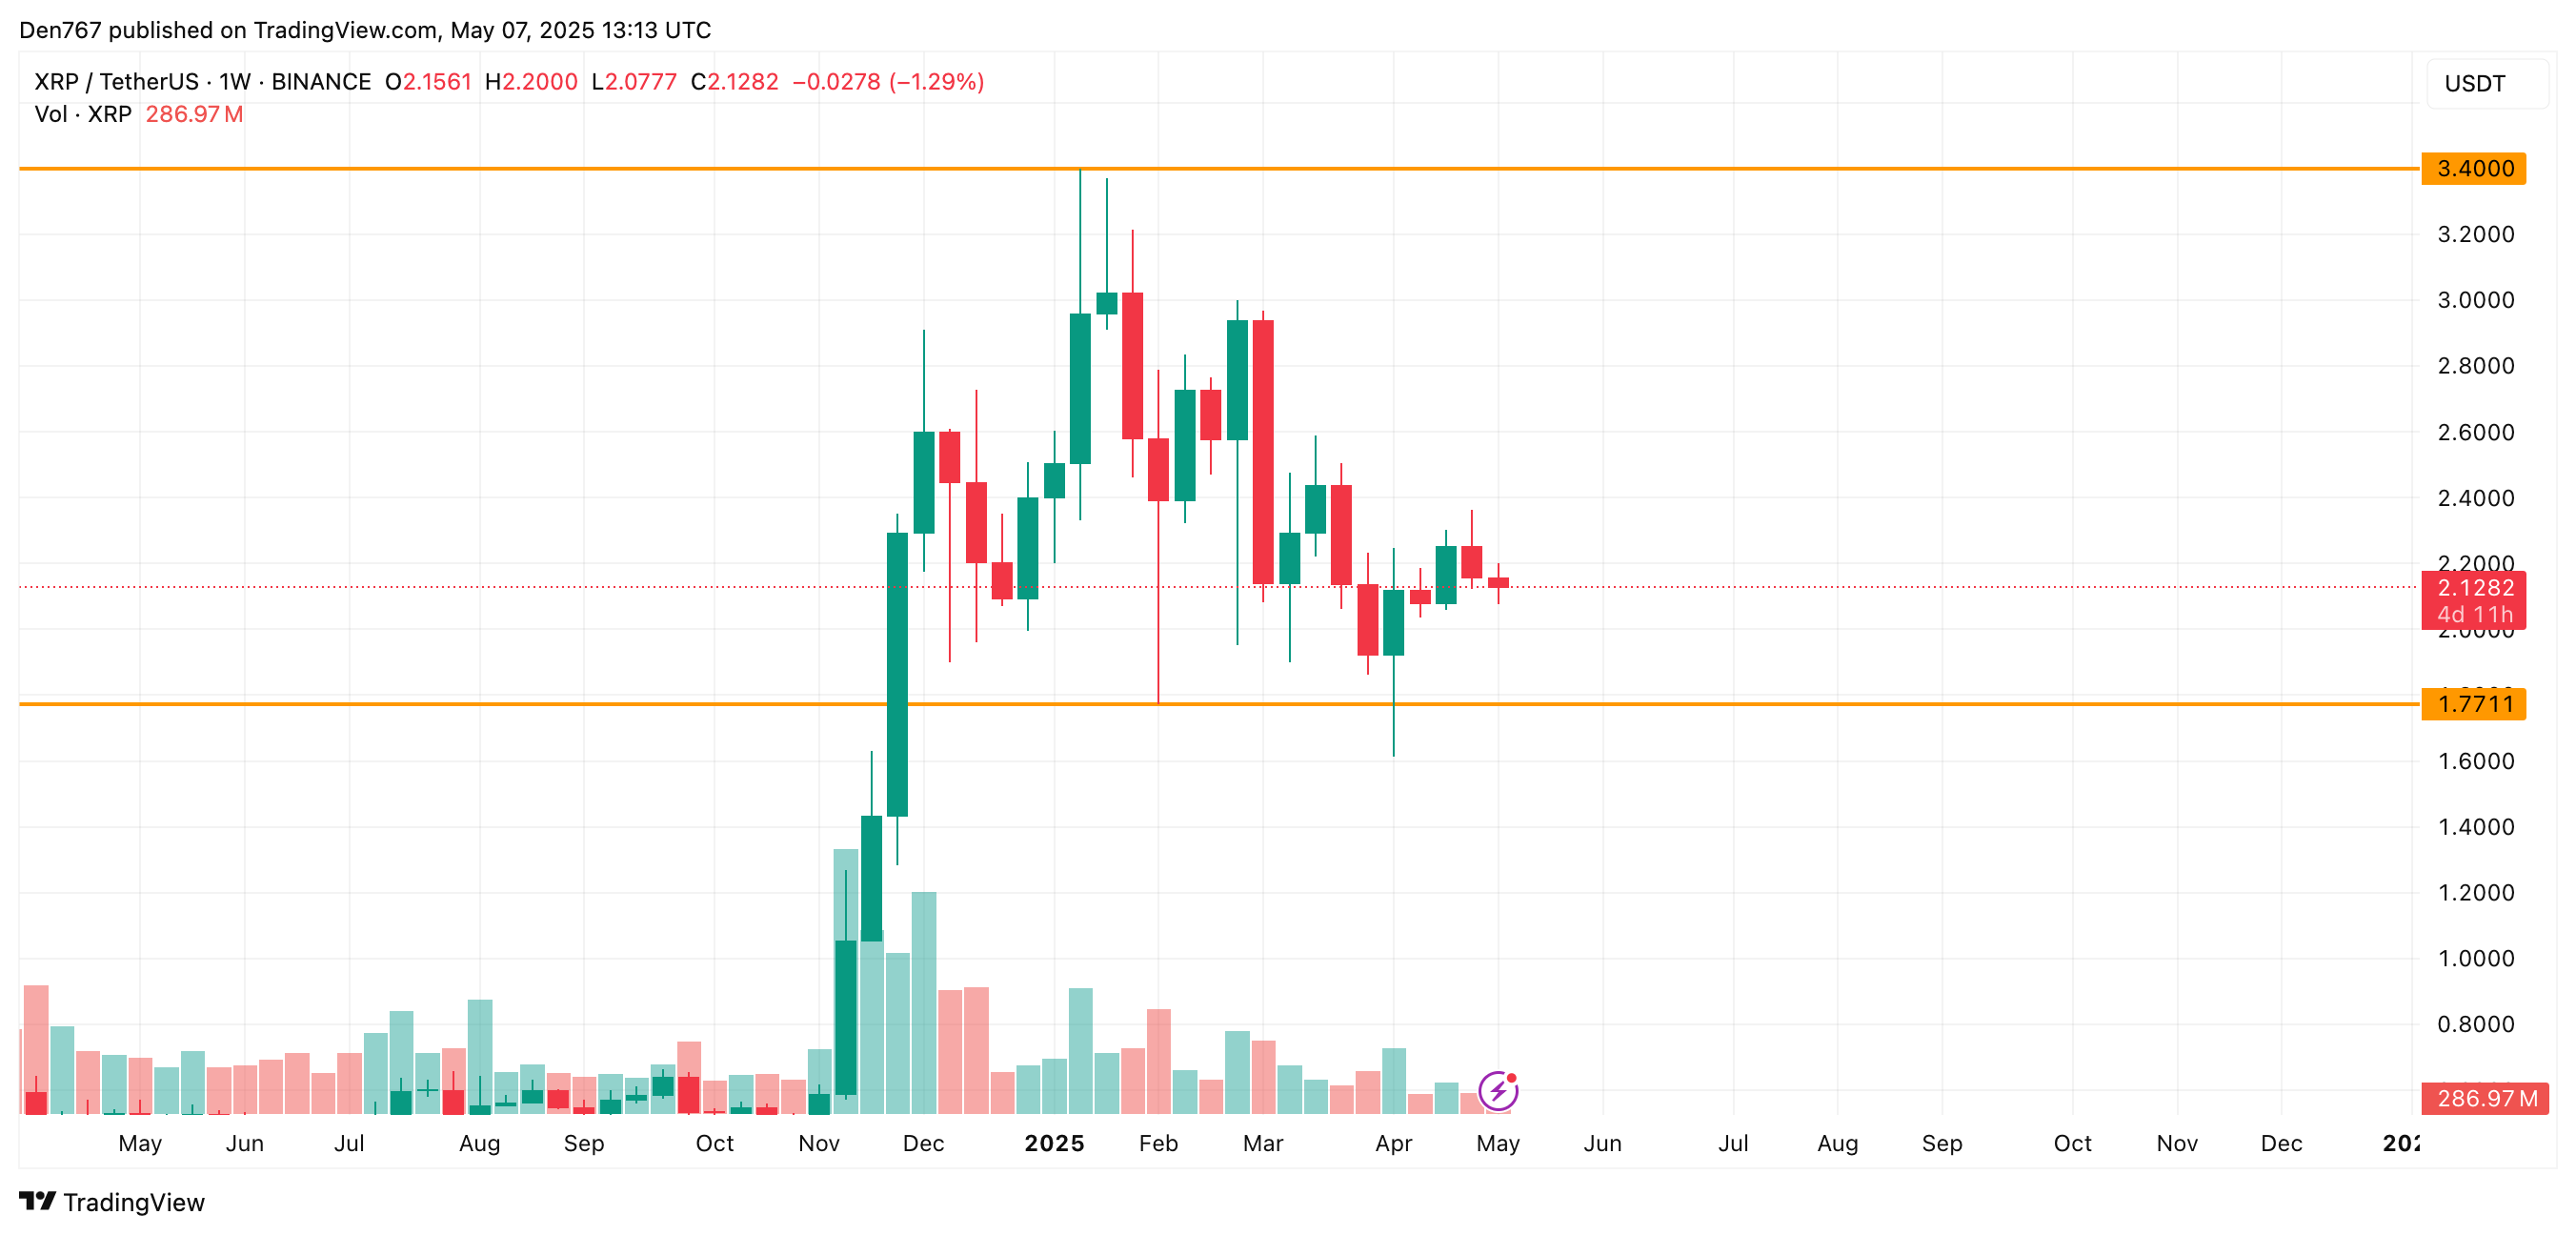
From the midterm point of view, none of the sides is dominating. In this case, one should focus on the nearest zone of $2. If the bar closes below it, the decline may continue to the support of $1.7711.
XRP is trading at $2.1263 at press time.
TradingView analyst Farid Saremi sees medium-term weakness in Dogecoin and does not anticipate any significant growth soon.
Dogecoin’s recent price action reflects a shift in sentiment, as the asset has fallen from early May highs. After briefly touching levels above $0.18 at the start of the month, the coin reversed course, dipping below the $0.175 support line by May 3.
The decline continued into May 6, with the price reaching a local low just above $0.165. As of press time, Dogecoin is trading near $0.1734, showing a minor 3% recovery over the past 24 hours.
However, this rebound has done little to resolve the growing uncertainty around its broader trend. As analysts assess the coin’s macro positioning, conflicting interpretations have emerged.
Farid Saremi, a TradingView analyst, has focused on a 3-hour DOGE/USDT chart to identify macro-level patterns. His assessment centers on equilibrium zones anchored to two significant resistance points—December 2024 and January 2025. In December, Dogecoin reached just under $0.50, while in January it peaked lower, near $0.43.

After these highs, the price declined to hover below a consolidation band between $0.18 and $0.21. This range now represents the main equilibrium zone. Notably, the price has slipped beneath this area, signaling diminished strength.
The chart interprets the drop below this zone as a breakdown, implying that buyers failed to maintain the balance. According to Saremi, Dogecoin is not ready for major growth in the medium term, and price action is expected to gravitate toward the middle zone.
Following the loss of the main equilibrium zone, Saremi identifies two additional levels to watch. The first is located at $0.10894, which corresponds to price consolidation from January 2025. This area acts as intermediate support and may become the new balance zone if the price continues downward. Further below, a deeper structural level near $0.07478 represents the final downside target. This level is based on historical price clustering from the October–November 2024 period.
Saremi emphasizes that external factors, such as actions by large holders or market news, may affect timing, but these variables will not invalidate the projected levels. He states, “We may be delayed in reaching the target, but the targets will be touched.”
In contrast, Trader Tardigrade analyzes Dogecoin’s performance against the total crypto market using a 3-day DOGE/Total chart.
#Dogecoin/#Total signals an identical Falling Wedge 🔥
It seems ready to break out.
A previous surge in $Doge/ $Total resulted in a 300% gain for $Doge. pic.twitter.com/9nEgq2wOGz— Trader Tardigrade (@TATrader_Alan) May 7, 2025
His analysis identifies a recurring pattern of falling wedges. The first wedge formed during mid-2024 and resolved in a sharp breakout, driving Dogecoin from around $0.10 to $0.46—a 300% surge. After the rally, the asset entered a correction phase, forming another wedge from February to May 2025.
This second wedge mirrors the structure of the previous one, with narrowing price ranges and compressing volume. The analyst highlights this tightening pattern as a sign of accumulation and potential breakout. He notes the technical similarity between the two wedges, implying that the current structure may precede another major move.
If the 300% rise were to repeat, Dogecoin could reach $0.6936 based on its current value.
DisClamier: This content is informational and should not be considered financial advice. The views expressed in this article may include the author’s personal opinions and do not reflect The Crypto Basic opinion. Readers are encouraged to do thorough research before making any investment decisions. The Crypto Basic is not responsible for any financial losses.
Cardano rebounds to $0.6784, breaking key Fibonacci levels. Could ADA hit $0.73 amid improved market sentiment?
As Bitcoin momentarily gains the $97,000 mark, altcoins like Cardano have surged by nearly 4%. Currently, the ADA price stands at $0.6784, witnessing a massive overnight comeback.
As the uptrend in Cardano gains momentum, the bulls have reclaimed the recently lost $0.67 high-volume zone. Will this reversal in Cardano’s price help it surpass the $0.72 decline?
Cardano’s price has made a bullish comeback from a strong support trendline on the 4-hour price chart. Coinciding with the support trendline, the 50% Fibonacci level has helped Cardano regain bullish strength.

With three consecutive bullish candles, the recovery in ADA’s price has surpassed the 61.80% Fibonacci level at $0.6732. The key Fibonacci resistance breakout also marks the breakout of a high-volume zone.
This high-volume zone had provided strong support for Cardano in late April. However, the recent breakout signals a V-shaped reversal in the ADA price trend, as well as a falling wedge breakout.
As Cardano sustains above the 61.80% Fibonacci level, buyers anticipate an upside move towards the $0.7292 resistance. This critical resistance has kept the Cardano price under check since late April.
The positive crossover in the MACD and signal lines supports the bullish outlook. According to Fibonacci levels, a potential breakout could reach the 1.272 level at $0.8372.
On the flip side, the crucial support remains the ascending trendline and the 50% Fibonacci level at $0.6437.
With the bullish recovery in Cardano, the derivatives market has witnessed stability in Cardano’s Open Interest. Since late April, according to Coinglass, Cardano’s Open Interest has sustained around the 700 million mark, currently at $735 million.
The funding rate also remains positive at 0.0065%. The derivatives market shows underlying bullish confidence with a positive funding rate and stable Open Interest.
Notably, with growing optimism, a potential surge in ADA’s price to $0.692 could result in massive short liquidations amounting to $4.46 million. This includes $427K from Binance, $232K from OKX, and $514K from Bybit.

On the flip side, a potential correction to $0.664 would result in intense long liquidations of $5.75 million. Therefore, the liquidation map reflects a double-edged position for Cardano, while the open interest and funding rate indicate a marginally bullish condition.
DisClamier: This content is informational and should not be considered financial advice. The views expressed in this article may include the author’s personal opinions and do not reflect The Crypto Basic opinion. Readers are encouraged to do thorough research before making any investment decisions. The Crypto Basic is not responsible for any financial losses.
The current phase in the cryptocurrency market is being viewed as the calm before the storm, particularly for XRP holders. Market activity is quiet, with little excitement or volatility, and this subdued atmosphere is expected to continue through the summer months.
Historically, June and July have been slow periods for crypto due to investor disengagement—many participants tend to focus on vacations or other non-market activities during this time. As a result, low trading volume and consolidation across major altcoins, including XRP, are likely to persist until late summer.
Despite this lull, broader macroeconomic developments suggest that the groundwork is being laid for a significant shift later in the year. U.S. markets are responding positively to news of resumed trade negotiations with China, with indices like the Dow and NASDAQ rising alongside crypto assets.
This momentum stems from expectations that ongoing global tariff disputes—many of which began under former President Trump’s administration—are nearing resolution.
Source – ClayBro on YouTube
The rebalancing of trade policies, including efforts to bring manufacturing back to the U.S. and open new markets, could remove significant economic uncertainties, which in turn would benefit risk-on assets like crypto.
While short-term market behavior may remain muted, there are signs that XRP could benefit significantly in the months ahead. The expected conclusion of tariff negotiations, coupled with potential regulatory clarity from the SEC, may provide a fertile environment for a broader rally in the fourth quarter of 2025.
In particular, the possibility of XRP-related exchange-traded funds (ETFs) being approved or announced—possibly by major financial institutions like BlackRock—could act as a major catalyst for price appreciation.
XRP is currently the subject of bullish price predictions, with expectations suggesting it could rally to $10 per coin—representing nearly a 5x increase from its present value.
This target is viewed as realistic within the current cycle, though further projections even suggest the potential for $XRP to reach $20 or $30 in the longer term. However, such higher valuations would require significant growth in the overall cryptocurrency market cap.
Historical patterns support the possibility of such a rise; notably, during periods when Bitcoin dominance falls, XRP has historically surged.
In 2017, a 47% drop in Bitcoin dominance coincided with an 11x rally in XRP, and in 2021, a similar 46% decline accompanied a 600% price gain for $XRP—even amid the ongoing Ripple vs. SEC lawsuit.
Analysts argue that if Bitcoin’s dominance falls again by about 40%, XRP could potentially rise to $16, based on past performance ratios. Still, the sustainability of these projections depends on the flow of capital within the market.
For XRP to reach extreme highs like $50, it would require massive capital rotation from assets like gold, real estate, or even Bitcoin, or an unprecedented increase in money supply. While such targets are not impossible, they emphasize that wealth creation in crypto markets takes time and significant market shifts.
The consensus is that XRP’s most significant growth and activity will likely emerge in the final quarter of the year, as key market and policy factors begin to align.
In the meantime, holders have a window of opportunity to prepare — while investors seeking high-potential alternatives are turning their attention to the Solaxy (SOLX) presale.
Solaxy is being hailed as one of the most promising new tokens in a market currently plagued by stagnation. While major cryptocurrencies like Bitcoin, Ethereum, and even meme coins have shown sluggish performance, the potential for breakout gains remains alive—and Solaxy is at the forefront of that conversation.
Historically, every bull market has featured multiple tokens that surged by 100x or more, and there’s growing belief that Solaxy could follow that path. Positioned as the first-ever Layer 2 (L2) blockchain built on the Solana network, Solaxy is generating significant attention and capital inflow.
With over $33.5 million already invested during one of the most fear-driven periods in the crypto market’s recent history, this token is defying the broader market sentiment. The SOLX token is currently priced at $0.001716, with less than 24 hours remaining before the next price increase.

Investors can purchase tokens using a bank card or cryptocurrency through the Best Wallet app. They can also stake their tokens at an annual percentage yield (APY) of 120%, with nearly 10 billion tokens already staked.
As Solana continues to struggle with congestion and high fees during network spikes, Solaxy aims to offer a scalable solution. When Solana gets bogged down, trades become delayed or even impossible without paying exorbitant fees.
This is where Solaxy’s architecture is crucial—it provides a more efficient alternative that can handle transaction overflow, unlocking the true potential of Solana-based applications during high-traffic periods. What’s remarkable is that this surge of interest in Solaxy is happening before the next bull run.
Historically, L2 tokens have thrived when the broader market gains momentum. Tokens like Mantle and Loopring have seen exponential growth during bull markets, with Loopring, for instance, reaching as high as $3 during the 2021 rally after trading at just a few cents.
These performance patterns suggest that Solaxy could follow a similar trajectory once market sentiment flips from fear to greed. With a growing community of over 76,000 followers, Solaxy is not only gaining financial backing but also strong grassroots support.
This combination of capital, community, and clear use-case positions it for potential long-term success. Investors are recognizing that projects like Solaxy, which offer real-world utility, are likely to outperform meme tokens when the market rebounds.
If Solaxy can attract tens of millions in funding while sentiment is at rock bottom, the upside during a bullish phase could be substantial. It represents the kind of forward-looking infrastructure project that tends to flourish when blockchain ecosystems mature and scalability becomes non-negotiable.
As the market eventually shifts toward optimism again, Solaxy may be one of the tokens leading the charge. To take part in the $SOLX token presale, visit solaxy.io.
This article has been provided by one of our commercial partners and does not reflect Cryptonomist’s opinion. Please be aware our commercial partners may use affiliate programs to generate revenues through the links on this article.

 breakout")