The main tag of cryptocurrency price today Articles.
You can use the search box below to find what you need.
[wd_asp id=1]
The main tag of cryptocurrency price today Articles.
You can use the search box below to find what you need.
[wd_asp id=1]
A recent Dogecoin chart by analyst “Steph is Crypto” highlights that DOGE continues to hold a rising trendline, with the latest bounce indicating renewed bullish momentum.
Dogecoin’s recent price action reflects resilience despite a brief bearish dip. After dropping from a high of $0.19 to a low of $0.16 earlier this week, the coin swiftly rebounded to around $0.185, signaling renewed buying interest at lower levels.
Analysts have since identified multiple structural price levels that continue to guide Dogecoin’s trajectory across various timeframes.
For instance, a chart from Steph highlighted a significant long-term rising support line, labeled the “Legendary trend-line.”
This trendline connects three major price lows over several years. It started in early 2020 above $0.001, followed by a touchpoint above $0.06 in 2024, and most recently at approximately $0.13 in 2025. At each of these levels, the price bounced, suggesting consistent defense of this trendline.
The support level around $0.13 marked the most recent contact with the trendline, which preceded the latest price recovery. Notably, Dogecoin has not breached this line during any of the recent market cycles.
According to the same chart, the formation indicates the potential for a long-term rally, with a speculative price target of $10. This would represent a 5,440% increase from the current price level. According to Step, those still holding DOGE are “absolute legend.”
#DOGECOIN road to $10!
If you’re still holding $Doge, you’re an absolute legend. pic.twitter.com/ZppO6UTzSK
— STEPH IS CRYPTO (@Steph_iscrypto) May 1, 2025
On a separate note, chart data from Trader Tardigrade focuses on daily timeframe signals, predicting a more conservative outlook. His analysis identifies a recurring pattern where Dogecoin bounces off an ascending trendline, forming higher lows each time.
These price structures are often preceded by fake reversals ahead of the main breakouts. Specifically, in September of the previous year and April 2025, DOGE followed this bounce-and-breakout pattern.
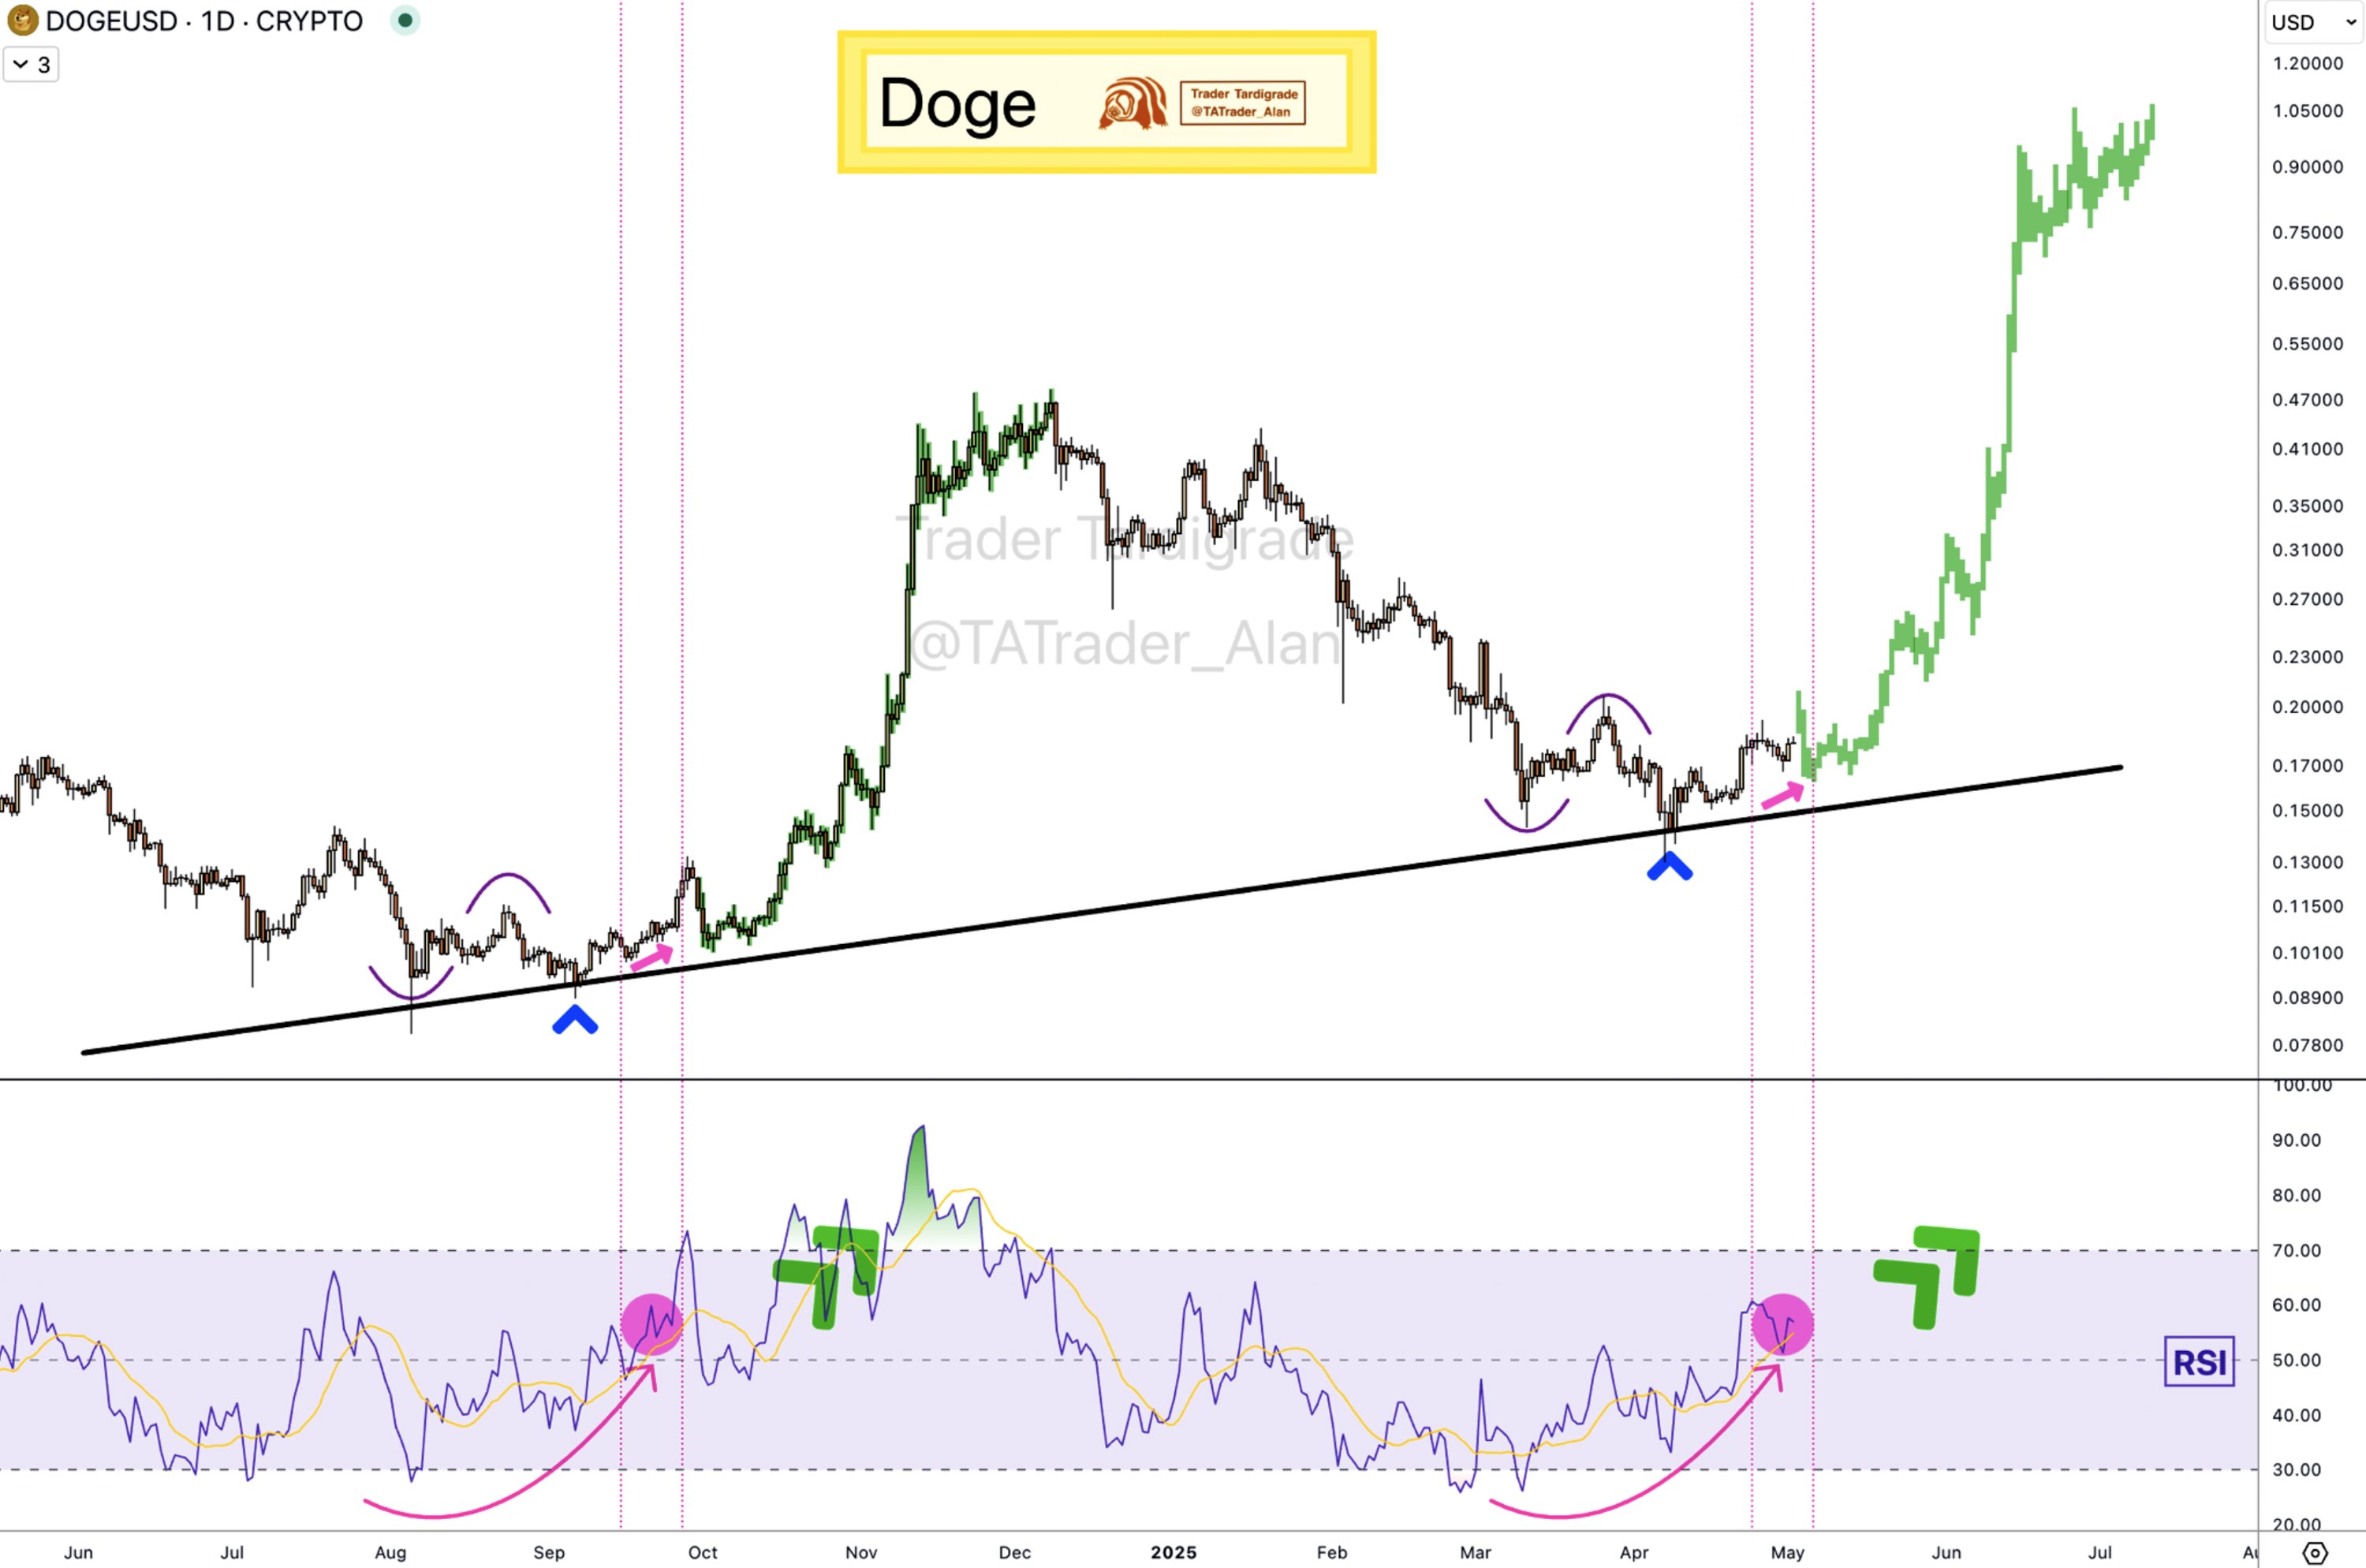
Each event aligned with a rounded bottom in the RSI curve. Historically, such RSI patterns have led to strong rallies, especially when curving upward past the 50 mark. The analyst’s chart sets an intermediate target at $1, contingent on the current bullish setup holding.
In yet another chart update, Trader Tardigrade examined Dogecoin’s price action over a 3-day timeframe, identifying a consistent pattern of prior swing highs serving as future support.
In late 2023, DOGE broke past the $0.098 resistance, then tested and held that level as support in early 2024. A similar pattern occurred when a July 2024 swing high of $0.145 was revisited and confirmed as support in April 2025.
Furthermore, the February 2025 high of $0.29 marked another key reference point before the price corrected.
The return to the $0.145 support in April maintained the structural integrity seen in past cycles. Following this pullback, the next resistance has been projected above $0.23, with the potential to reach $0.80, a level that would surpass Dogecoin’s previous all-time high of $0.73.
DisClamier: This content is informational and should not be considered financial advice. The views expressed in this article may include the author’s personal opinions and do not reflect The Crypto Basic opinion. Readers are encouraged to do thorough research before making any investment decisions. The Crypto Basic is not responsible for any financial losses.
Cardano (ADA) is showing renewed strength as whale accumulation signals a potential breakout ahead of the next major market move. Large-scale holders are positioning for upside, suggesting confidence in ADA’s long-term value. But it’s not the only token catching attention.
Lightchain AI, currently in presale at $0.007, has already raised $18.3 million and is emerging as a powerful contender in the AI-blockchain space. With both tokens gaining momentum, analysts are forecasting possible 300% surges as bullish sentiment returns. Lightchain AI’s innovative infrastructure and strong early demand place it alongside ADA as one of the top breakout candidates for the months ahead.
Current on-chain data illustrates that Cardano (ADA) has seen a rise in the number of whales who have acquired 190 million ADA in a single day. This accumulation took place at the time when ADA’s price fell between $0.65 and $0.75 in a ten-day period of consolidation. Simultaneous buying activity that is actually synchronized implies that the whales are very confident, and it can, therefore, be a factor in the price of ADA going up.
On the other hand, ADA continues to face some resistance at the $0.75 level, and if it successfully crosses that barrier, it might suggest the fact that it has a wide range of targets from $0.90 to $1.00. Meanwhile, some big investors may consider this evidence of a potential event, demanding real attention.
Lightchain AI is capturing serious investor attention with the potential for a 300% surge, thanks to its cutting-edge infrastructure and meticulously designed tokenomics. The platform features a capped total supply of 10 billion LCAI tokens, strategically allocated to ensure sustainability and decentralization; 40% for presale, 28.5% for staking rewards, and the remainder distributed across liquidity, marketing, treasury, and team reserves.
Built for efficiency, Lightchain AI’s architecture delivers ultra-low latency, empowering decentralized nodes to execute AI tasks in real time without bottlenecks. Its gas optimization mechanisms dynamically adjust fees based on task complexity, ensuring a platform that is both cost-effective and highly efficient.
With robust fundamentals and real-world utility, Lightchain AI is emerging as a standout project poised to deliver significant returns in the upcoming bull run.
Lightchain AI is making waves, much like ADA, as whales continue to accumulate tokens ahead of its presale completion. This growing interest signals strong confidence in the project’s potential, setting the stage for a surge in demand for LCAI tokens once they go live on exchanges.
By combining the power of blockchain technology with artificial intelligence, Lightchain AI is capturing the attention of a diverse group of investors—from tech visionaries to traditional finance professionals.
With both ADA and Lightchain AI building momentum, their combined growth could ignite exciting opportunities in the crypto market. Keep an eye on these projects—they have the potential to spark major shifts in the broader crypto landscape.
https://lightchain.ai/lightchain-whitepaper.pdf
A respected voice in the XRP community, known on X as “All Things XRP,” has reignited the conversation around the true damage caused by the SEC’s lawsuit against Ripple.
According to the commentator, the hit to XRP was not limited to its price. Instead, it also cost the project years of growth, innovation, and investor momentum.
The damage began in December 2020 when the SEC filed its case against Ripple. XRP plummeted 73% in days, from $0.65 to just $0.17, as major U.S. exchanges delisted the token. In parallel, liquidity dried up, and U.S. investors were locked out of the market.
While Bitcoin, Ethereum, and Solana rallied during the 2021 bull market, XRP mostly stayed stuck between $0.30 and $0.50. The commentator claims the lawsuit created a chilling effect as retail FOMO skipped over XRP, and institutions stayed away.
Nonetheless, XRP delivered notable gains in 2021 as its price rose to $1.96 by April. However, due to the regulatory weight, it lacked the momentum to break previous cycle peaks like its rivals.
Commentators stressed that the stagnation was not due to technical failures or lack of utility but mainly due to the legal uncertainty. For many, it was a period of complete price suppression, amplified by reputational damage.
Meanwhile, in July 2023, there was a brief moment of optimism. Judge Torres Analisa ruled that XRP by itself is not a security. Moreover, Ripple’s XRP sales on exchanges did not constitute securities transactions.
With this legal clarity, the price surged from $0.42 to $0.92 overnight. This rally emerged as U.S. exchanges that delisted XRP reinstated the coin.
However, the SEC’s decision to appeal brought uncertainty roaring back, though it did not deter further exchange listings.
Fast-forward to November 2024. Chairman Gary Gensler announced his resignation, and XRP jumped to above $3 a few weeks later. The move canceled out most of the losses from the previous seven years.
Meanwhile, a retracement ensued with XRP settling in the $2 range. While the SEC dropped the case against Ripple in March 2025, XRP saw a muted reaction, revealing something deeper.
According to All Things XRP, despite the long-awaited legal victory, the market had moved on. “No fireworks. No moon,” said the commentator.
While XRP’s performance has vastly improved compared to previous years, many argue it should have achieved significantly higher valuations if not for the lawsuit. However, the price is just part of the equation. According to “All Things XRP,” the real loss was time.
Specifically, Ripple’s ambitions to dominate cross-border payments slowed as institutions, particularly in the U.S., paused partnerships. Competitors like Solana and Chainlink gained mindshare and market share.
“All Things XRP” stressed that XRP’s suppression wasn’t just a temporary price dip. It was a five-year stall in progress, momentum, and trust.
With the legal saga behind it, XRP now faces a new challenge: apathy. The community is weary, and the markets are cautious. Even bullish developments like potential ETF filings, Ripple’s acquisition, and RLUSD stablecoin integrations are facing measured responses.
The commentator charged the community with rebuilding the lost spirit and concluded with a vote of confidence that XRP would bounce back even more strongly.
🔟 XRP’s Suppression Wasn’t Just Price. It Was Time.
Time lost. Opportunities missed. Reputation burned.
But now the chains are off.
Will Ripple rise to the occasion?
Or did the SEC clip its wings for good?
I’m betting that XRP will rise up. 💪🏻
Thanks for reading!
Follow…
— All Things XRP (@XRP_investing) May 1, 2025
DisClamier: This content is informational and should not be considered financial advice. The views expressed in this article may include the author’s personal opinions and do not reflect The Crypto Basic opinion. Readers are encouraged to do thorough research before making any investment decisions. The Crypto Basic is not responsible for any financial losses.
Solana Targets $180 as ETF Optimism, Strong Support Levels, and Rising Perp Volume Build a Bullish Case.
After bouncing nearly 30% off mid-April lows, SOL is now holding strong above $150, with fresh momentum building across the board.
Solana (SOL) was trading at $148.59, up 0.91% in the last 24 hours. Source: Brave New Coin
If Sol Solana Price can push through the $160–$165 zone and build momentum toward $180, we might finally see a clean breakout take shape. With the ETF buzz, growing institutional interest, and solid support around recent lows, the Solana price prediction is starting to shift more to the bullish side.Solana Eyes ETF Boost as Approval Odds Jump to 90%
In what could become a defining moment for the broader altcoin market, Bloomberg ETF analyst Eric Balchunas, has just raised the approval odds for several spot crypto ETFs, and Solana is front and center. According to the latest chart shared by Cointelegraph, Solana joins Litecoin and a crypto index basket at the top of the list, all now carrying a 90% chance of ETF approval in 2025. While Bitcoin and Ethereum have already opened the ETF floodgates, this signals a potential second wave where Solana could take the lead among the next-gen blockchains.

Solana’s ETF approval odds rise to 90%, signaling a potential surge in institutional interest and capital inflows. Source: Eric Balchunas via Cointelegraph on X.
ETF approval is a gateway to mainstream capital and institutional flows. If it gets approved, it could reframe the Solana price prediction narrative.
Solana is retesting a major support zone near $140 after a strong April rebound, and eyes are now shifting toward a potential climb back into the $180 range. According to crypto analyst Owais, the price has pulled back into a demand zone aligned with multiple moving averages, setting up what could be a clean bounce scenario if the level holds. The current consolidation also comes as part of a broader recovery effort after SOL swept March lows just under $120.
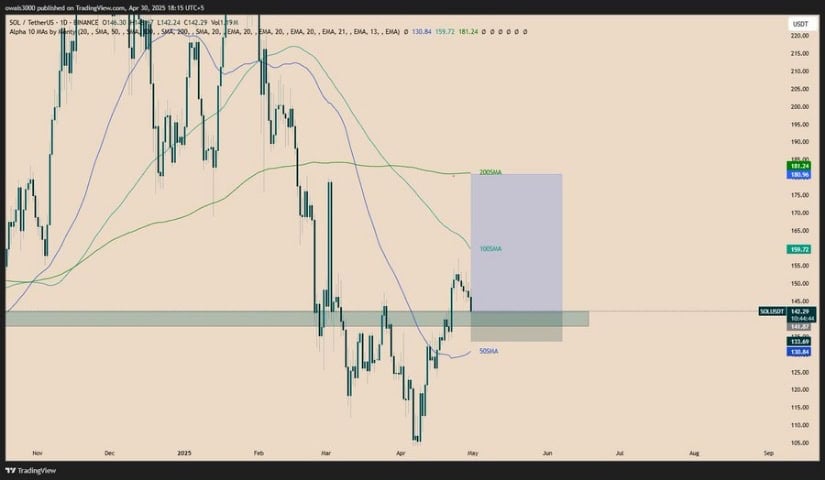
Solana retests key $140 support with eyes set on a potential rebound toward $180. Source: Owais via X
Technically, the setup looks constructive, but not without hurdles. The 50-day SMA is holding below the price at $133.69, while the 100-day and 200-day SMAs sit higher at $159.72 and $181.24, respectively. These levels mark potential resistance zones, especially the 200-day, which often acts as a long-term trend signal. If SOL can break above the 100-day and close strong above $160, the Solana price prediction toward $180 comes into play.
Momentum indicators offer a mixed but slightly bullish read. On the 4-hour chart, Bollinger Bands are starting to squeeze, a signal often associated with an impending volatility spike. Famous crypto chartist Ali Martinez pointed out, this compression phase could precede a sharp directional move. If volume returns and the support zone holds firm, Solana might be gearing up for its next leg higher.
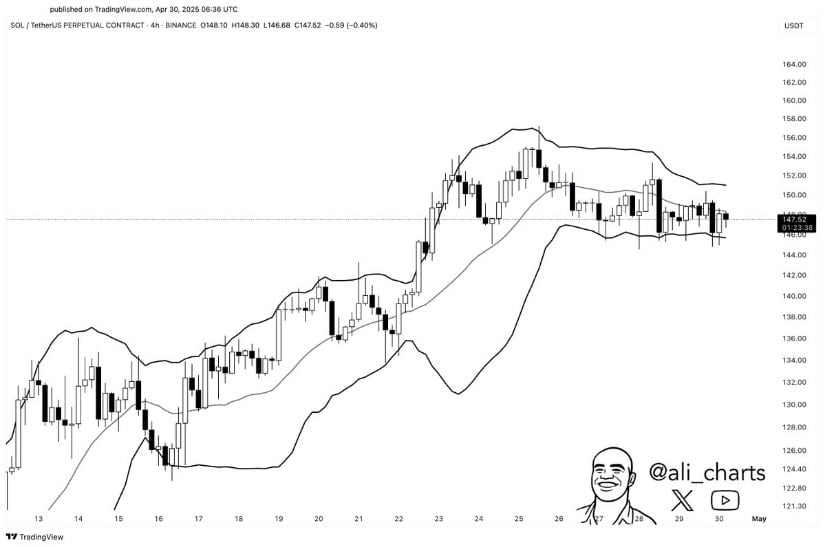
Bollinger Bands squeeze on Solana’s 4H chart signals a possible breakout ahead. Source: Ali Martinez via X.
While Solana’s price consolidates and ETF buzz brews in the background, another metric is quietly gaining momentum: the perpetual volume. As shown in the latest chart from DeFiLlama, daily Solana perp volume has stayed relatively elevated throughout March and April, even during price pullbacks. Despite some short-term dips, the pattern suggests active participation and sustained interest is there for Solana.
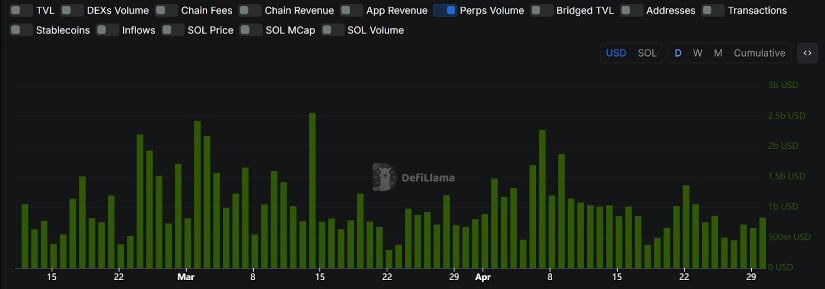
Solana’s daily perpetual volume holds strong through consolidation. Source: DeFiLlama
Interestingly, Solana’s spot trading volume has also stayed relatively steady through April, averaging between $4B to $6B daily. While it’s cooled from January’s peak, the current base suggests consistent interest rather than fading momentum.
While the ETF spotlight intensifies and perpetuals stay active, Solana has been quietly rallying 20% in a month with barely any hype around social feeds. As crypto analyst SlumDOGE Millionaire pointed out, there’s still a surprising lack of bullish noise across social timelines, despite SOL Solana price hovering near $150. That kind of price-sentiment disconnect doesn’t usually last long. Historically, these are the moments when early institutional capital starts positioning quietly before the retail crowd catches on.
Solana may be flying under the radar on social media, but the charts and capital flows are telling a very different story. With SOL currently holding above $140 and ETF optimism adding fuel to the fire, this quiet period might just be the calm before a major move. If bulls can reclaim the $160 level, which aligns with the 100-day SMA, momentum could pick up fast. The real test lies at the 200-day SMA near $181, a key breakout zone that could shift Solana’s structure from recovery to bullish.
Watch for any volume surge or price squeeze near $160 to $165. That’s the zone where things could accelerate. And if sentiment starts to catch up with price, as SlumDOGE Millionaire hinted, Solana could be looking at the beginning of a new leg higher.
The best is yet to come for Dogecoin this bull cycle, according to a prominent market analyst, who predicts an over 2,000% rally to unprecedented prices.
Market watcher Kevin shared a Dogecoin price update in a May 1 analysis amid recent positive trends. The analyst highlighted that the leading meme coin has shown strong bullish traction, citing catalysts that would propel a parabolic expansion to $3.943.
Notably, the analysis comes when Dogecoin, the largest meme coin by market capitalization, is starting to find its footing. DOGE surged 15% last week and is up an impressive 38% from April’s low of $0.129.
Kevin noted that Dogecoin has defended the macro support at the 0.382 Fibonacci extension, currently at $0.138. The support was initially a resistance trendline on the monthly timeframe, which the token broke above following its November rally. Notably, DOGE retested an ensuing wedge on the chart and has since bounced from the region to its current price.
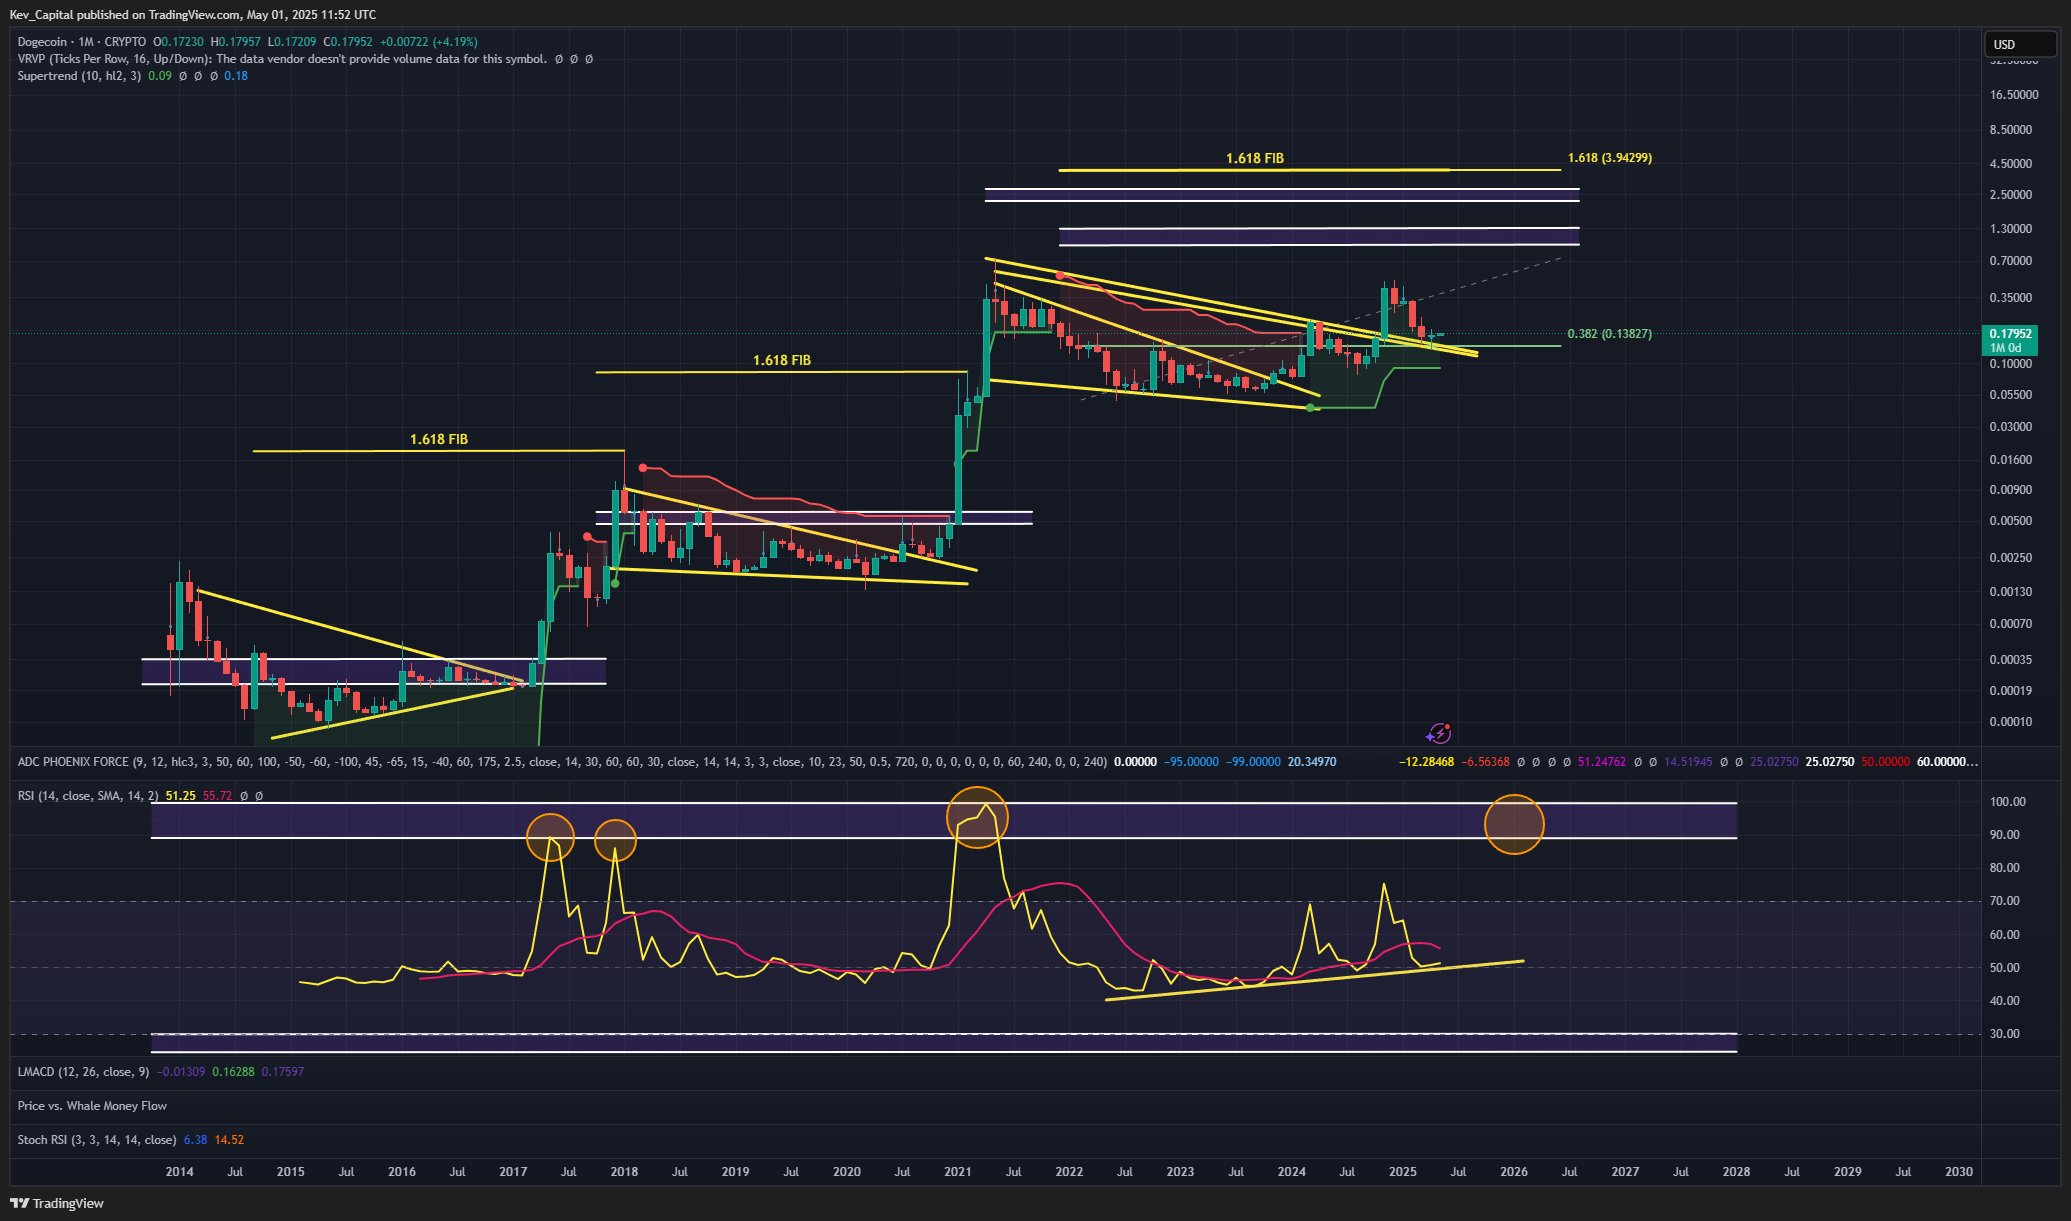
The market watcher insists that the prominent meme coin’s current price presents a phenomenal risk-to-reward opportunity. According to the commentary, Dogecoin has yet to resume its super trends on the monthly chart, and its relative strength index (RSI) is at the same level as when it traded at $0.0011 years ago.
As a result, Kevin suggests that Dogecoin has a “ton of room to run to the upside.” Specifically, he predicted an upward trajectory to the 1.618 macro golden pocket, a Fibonacci extension that DOGE has typically peaked at in all previous bull cycles. Interestingly, the level correlates with a price target of $3.94, an over 2,087% uptick from its current trend.
Meanwhile, the commentary highlighted that the macroeconomic tailwind from quantitative easing would enhance the projected Dogecoin rally. For perspective, Fed Chair Jerome Powell recently revealed that there would be at least two rate cuts before the end of the year, a proper catalyst for a crypto rally.
The watcher highlighted that the momentum, coupled with a potential peak in Bitcoin dominance, will ensure DOGE reaches its ambitious $3.94 target. According to the commentary, BTC’s market share, currently at 64.87%, is expected to reach a local peak in the summer, and altcoins like Dogecoin will resume a parabolic expansion to unprecedented prices.
Remarkably, Kevin is not the only commentator with a bullish outlook for Dogecoin; several other analysts have predicted that the meme coin will see higher prices. An outlook from CobraVanguard projects a DOGE rally to a new all-time high of $0.88, with prominent asset manager 21Shares forecasting a surge to $1.42 this year in a bullish case.
At the time of writing, Dogecoin trades at $0.1801, up 4% since the start of May.
DisClamier: This content is informational and should not be considered financial advice. The views expressed in this article may include the author’s personal opinions and do not reflect The Crypto Basic opinion. Readers are encouraged to do thorough research before making any investment decisions. The Crypto Basic is not responsible for any financial losses.
Analyst CobraVanguard identifies a bullish flag on Cardano’s 3-day chart, but traders must wait for a breakout confirmation.
Cardano (ADA) maintained a narrow trading range between $0.67 and $0.72 over the past week, reflecting short-term volatility. Although the token recorded a 2.3% gain in the last 24 hours, it dropped slightly by over 1% in the past 7 days.
However, behind the tight price action, technical indicators and derivatives market data suggest a critical phase in ADA’s consolidation.
On TradingView, analyst CobraVanguard identified a bullish continuation pattern on the 3-day ADA/USDT chart. The structure resembles a falling wedge or flag formation.

This setup follows a steep rally from early November 2024 to early December 2024, when ADA surged from around $0.30 to a peak above $1.30. This movement formed the “flagpole” of the pattern, which has since transitioned into a downward-sloping channel.
The wedge began forming in early January 2025 and continues through May 2025. Prices have oscillated within the upper resistance and lower support trendlines, failing to break either decisively. Resistance held firm at $1.30, $1.10, and $0.90, while support levels at $0.63, $0.60, and $0.56 kept the bears in check.
CobraVanguard emphasized the importance of waiting for a breakout above the flag’s upper trendline. If that occurs, ADA may aim for $1.3387, a potential 89.18% rally from its current price of $0.7076.
A second analysis by Arman Shaban, also on TradingView, added context using Smart Money Concepts. His 3-day ADA/USDT chart mapped a full market structure cycle. ADA rose sharply from $0.33 to nearly $1.32 before reversing near a Bearish Order Block. This area, located in the upper grey zone, introduced strong sell pressure that initiated a corrective phase.

During the retracement, the price declined to a Demand Zone around $0.50. This zone aligned with a Bullish Order Block. The price was then rebalanced by filling a nearby Fair Value Gap, which provided a key entry point.
ADA currently trades around $0.7082, consolidating just above the critical $0.65 support zone. According to Shaban’s observation, upcoming resistance and potential target zones are $0.75, $0.81, $0.93, and $1.05.
Beyond price charts, sentiment from the futures market supports the bullish outlook. According to Coinglass data, the ADA OI-Weighted Funding Rate chart reveals consistent positive funding since mid-April. This means long-position holders have been paying shorts, showing that more traders are betting on price increases.

Notably, this trend aligns with ADA’s gradual climb from below $0.61 to over $0.70. The synchronized rise in funding rates and price points is due to strong participation from both spot and derivatives markets. Notably, this data supports the bullish outlook presented in recent technical analyses.
DisClamier: This content is informational and should not be considered financial advice. The views expressed in this article may include the author’s personal opinions and do not reflect The Crypto Basic opinion. Readers are encouraged to do thorough research before making any investment decisions. The Crypto Basic is not responsible for any financial losses.
Ripple (XRP) price remains firmly supported at $2.20, while trading at $2.22 at the time of writing on Friday. The XRP community is growing increasingly confident in its holdings amid renewed optimism for the approval of spot XRP Exchange Traded Funds (ETFs) following the change in leadership at the Securities and Exchange Commission (SEC). Breaking above a four-month descending trendline could boost XRP’s bullish prospects and potentially drive the price towards $3.00.
The change of leadership at the SEC, with Paul Atkins as the Chair of the regulatory agency, has seen the chances of an XRP spot ETF approval jump to 85% from 65% in just two months. According to Santiment, “traders are now predicting new all-time highs for XRP, and betting platforms like Polymarket reflect this shift, with 79% odds of approval by the end of the year.”
Spot XRP ETF approval odds | Source: Polymarket
The prospects of a spot XRP ETF approval have remained steady despite the SEC postponing its decision on Franklin Templeton’s spot ETF proposal until June 17. The approval of the spot ETF could significantly alter investment dynamics surrounding XRP, potentially attracting substantial institutional interest and propelling the token into the mainstream financial sector.
XRP’s price holds firmly to confluence support at $2.20, established by the 50- and 100-day Exponential Moving Averages (EMA). Despite the pivotal movement around this level in the past week, XRP shows signs of the uptrend’s continuation towards a medium-term target of $3.00.
A buy signal in the Moving Average Convergence Divergence (MACD) indicator reinforces the bullish momentum. This signal was confirmed on April 12 when the MACD line (blue) crossed above the signal line (red).
Additionally, the indicator’s movement above the center line, accompanied by the expansion of green histograms, increases the likelihood of a breakout above the descending trendline, as illustrated on the daily chart.
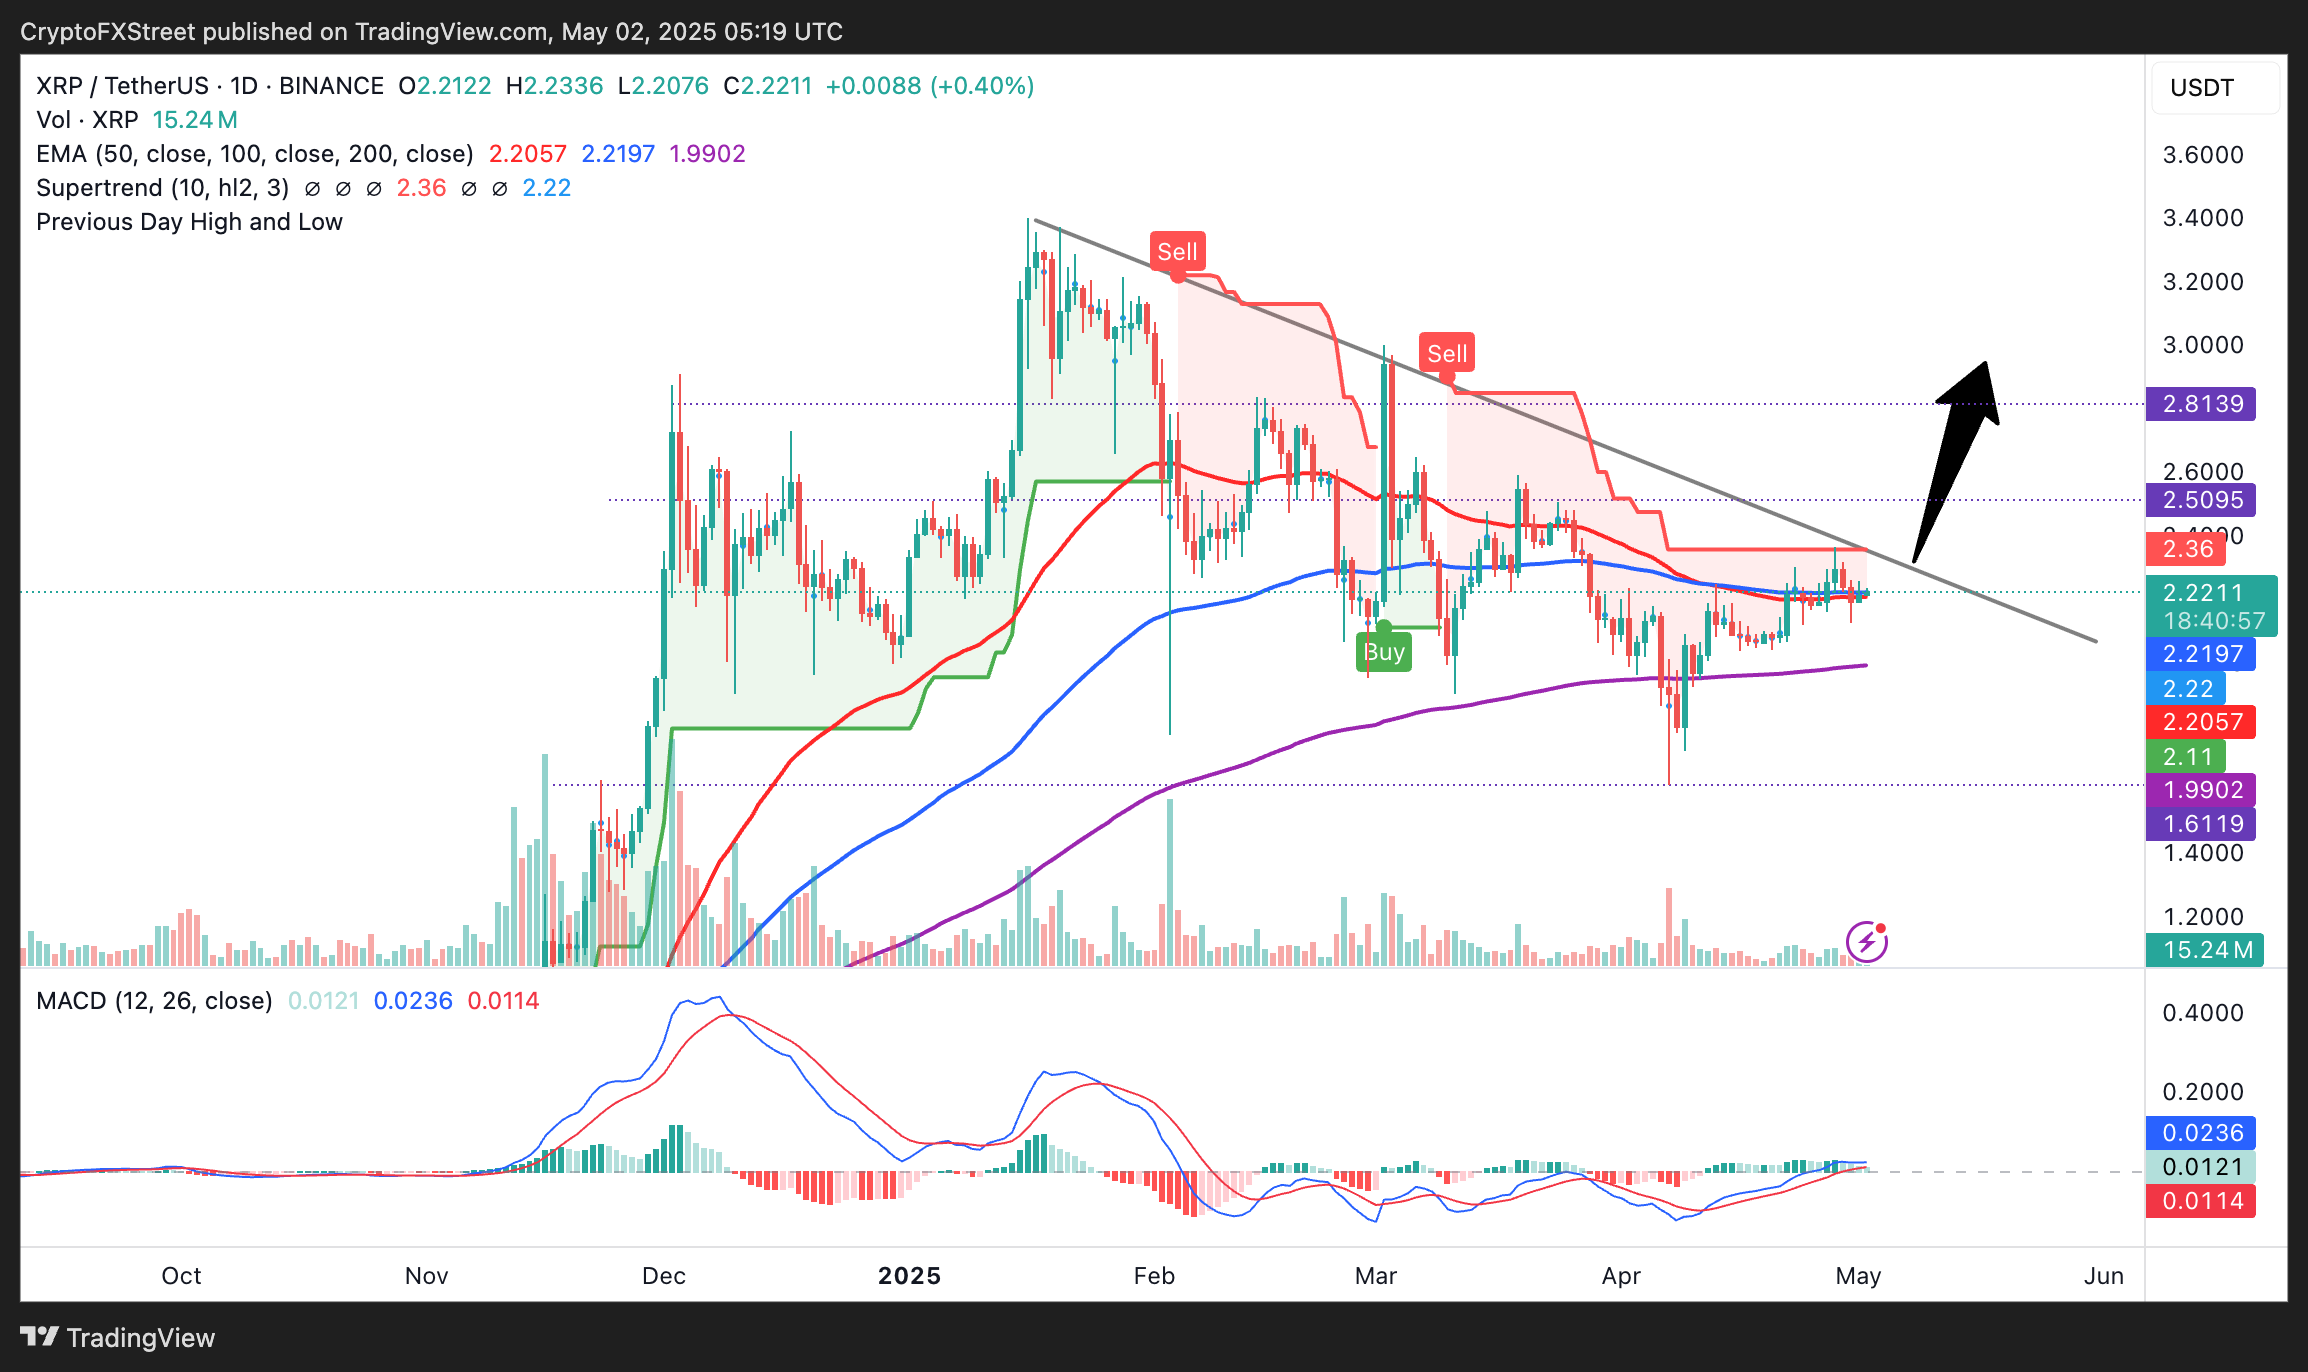
XRP/USDT daily chart
Traders should prepare for possible drawdowns at $2.50 and $2.80 supply zones. Selling due to profit-taking could overwhelm bullish momentum at these levels, slowing the uptrend or even leading to reversals.
The SuperTrend indicator’s sell signal highlights the potential selling pressure in XRP’s recovery path. This indicator sends a sell signal when it flips above the token’s price, changing color from green to red. Traders should consider the position of the SuperTrend when making decisions.
Meanwhile, Santiment’s biweekly market update notes that chatter about XRP, compared to other top cryptocurrencies, has steadily declined over the past three months. This downtrend in social dominance could hold back XRP’s uptrend.
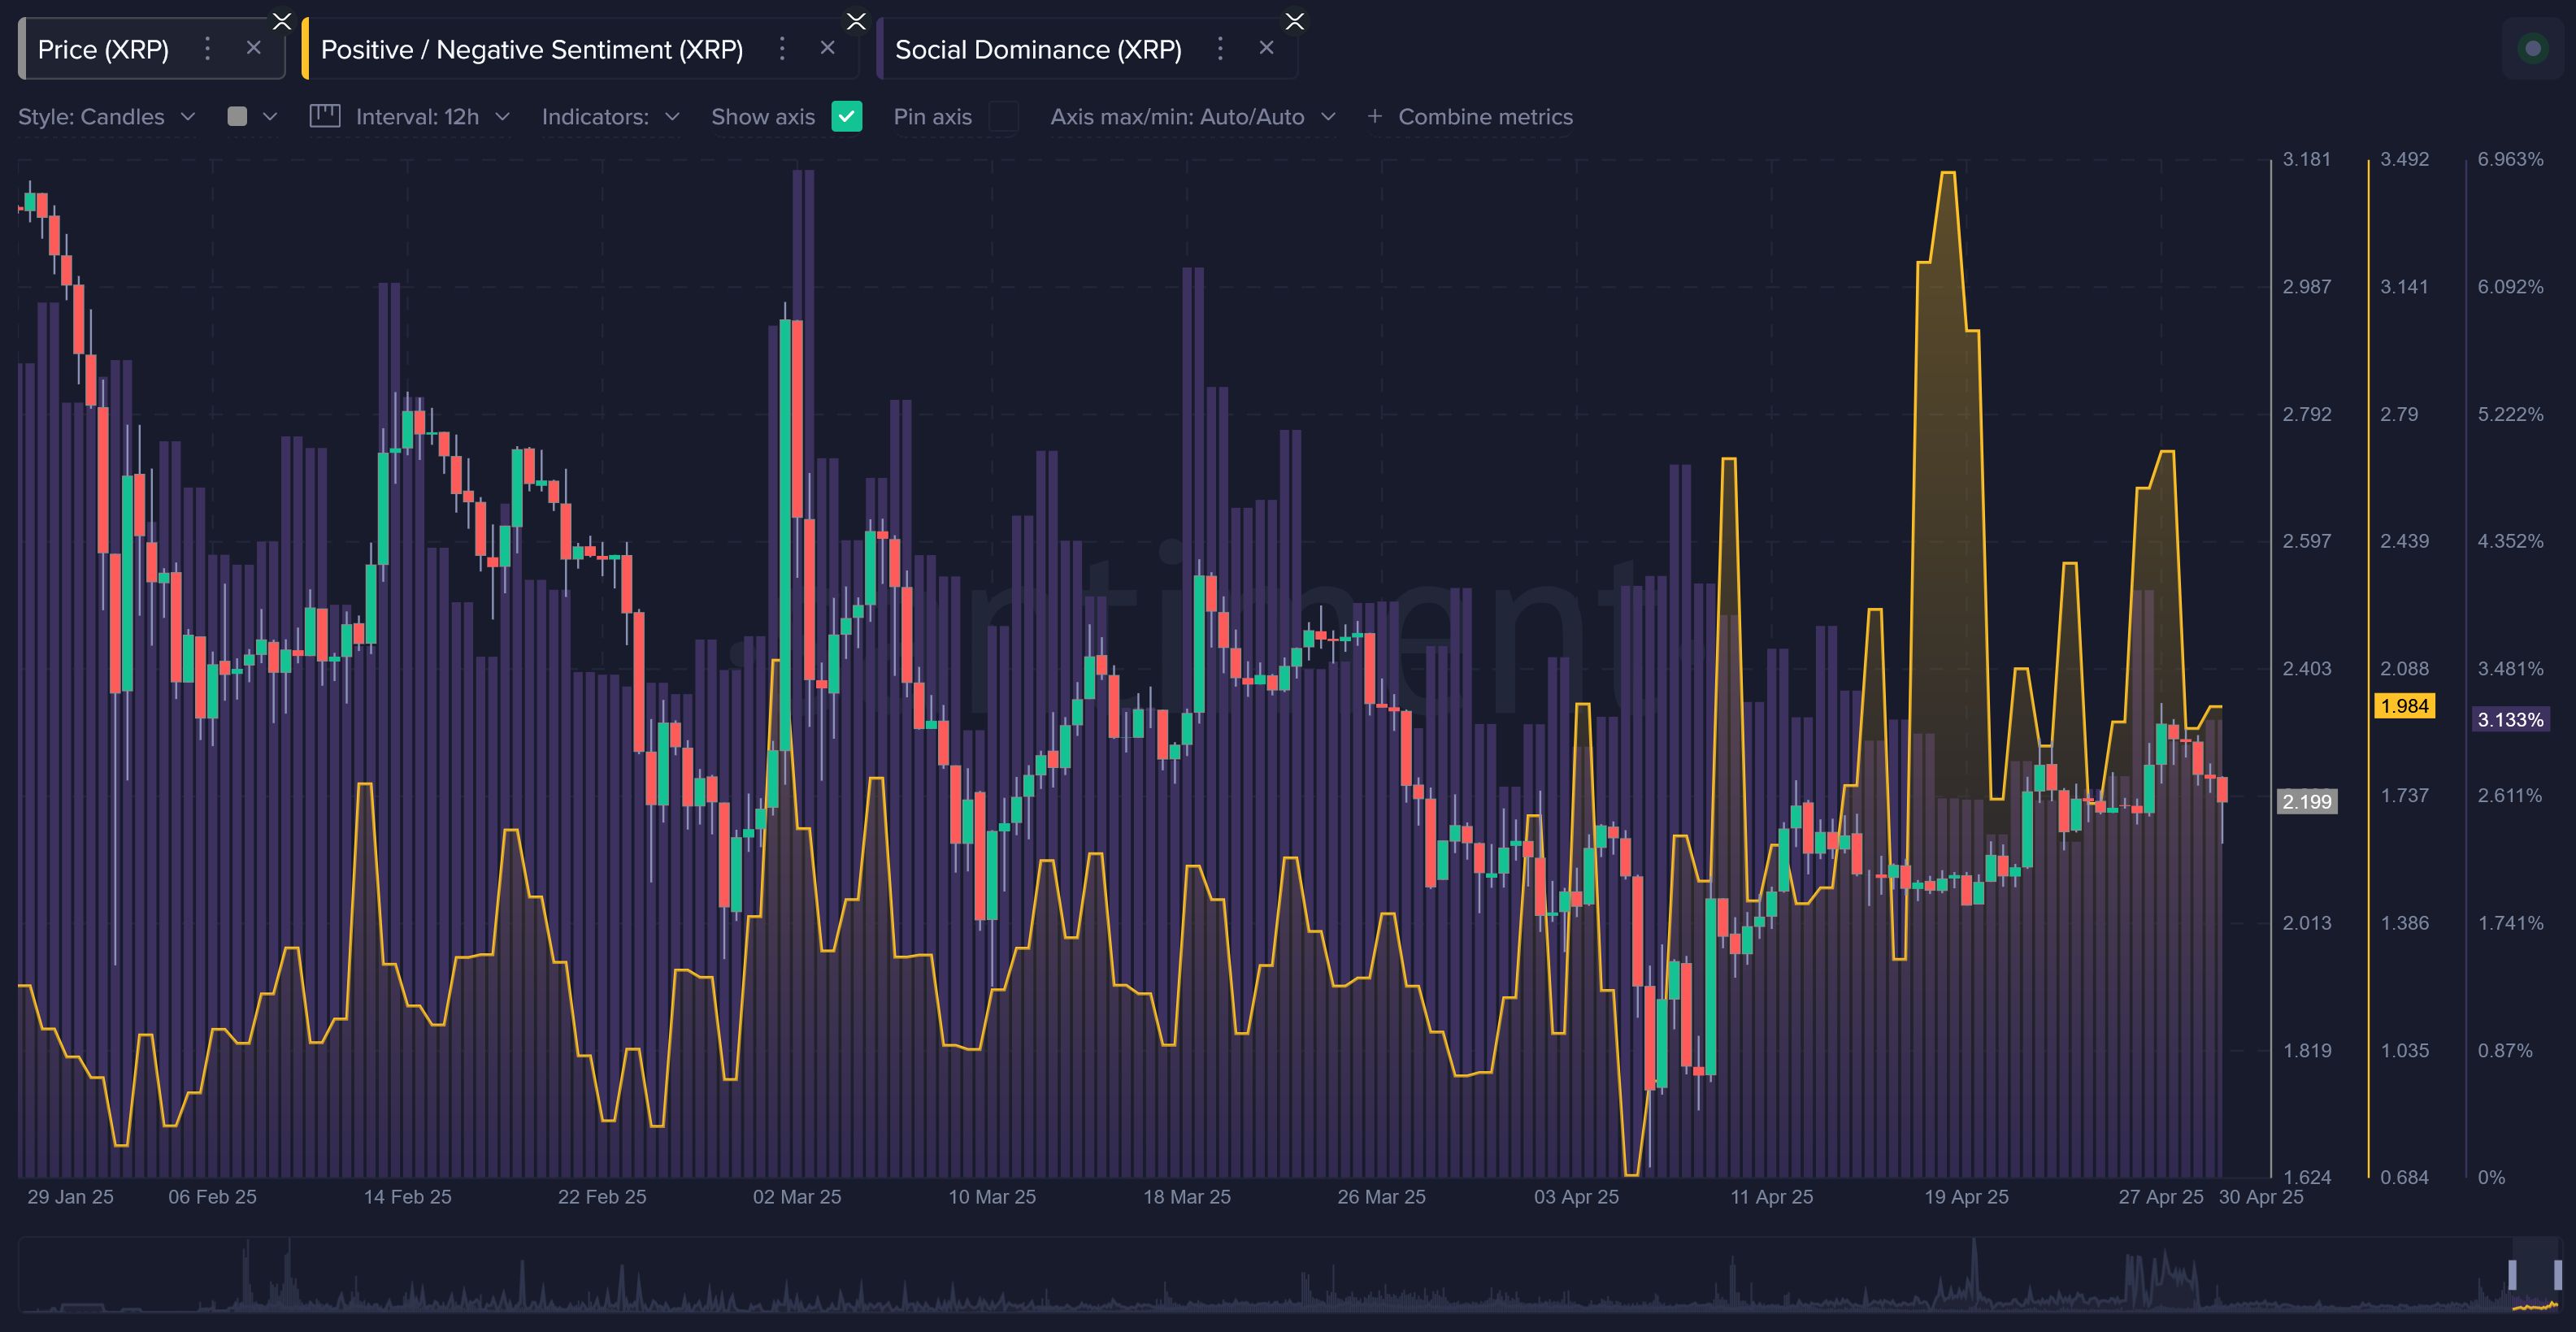
XRP’s ratio of bullish vs. bearish commentary | Source: Santiment
In the event that support at $2.20 gives way, and the XRP price slides, traders would look to the 200-day EMA at $1.99 for a potential rebound. Beyond this level, volatility could spike, creating instability and accelerating losses toward XRP’s April 7 low at $1.61.
An Exchange-Traded Fund (ETF) is an investment vehicle or an index that tracks the price of an underlying asset. ETFs can not only track a single asset, but a group of assets and sectors. For example, a Bitcoin ETF tracks Bitcoin’s price. ETF is a tool used by investors to gain exposure to a certain asset.
Yes. The first Bitcoin futures ETF in the US was approved by the US Securities & Exchange Commission in October 2021. A total of seven Bitcoin futures ETFs have been approved, with more than 20 still waiting for the regulator’s permission. The SEC says that the cryptocurrency industry is new and subject to manipulation, which is why it has been delaying crypto-related futures ETFs for the last few years.
Yes. The SEC approved in January 2024 the listing and trading of several Bitcoin spot Exchange-Traded Funds, opening the door to institutional capital and mainstream investors to trade the main crypto currency. The decision was hailed by the industry as a game changer.
The main advantage of crypto ETFs is the possibility of gaining exposure to a cryptocurrency without ownership, reducing the risk and cost of holding the asset. Other pros are a lower learning curve and higher security for investors since ETFs take charge of securing the underlying asset holdings. As for the main drawbacks, the main one is that as an investor you can’t have direct ownership of the asset, or, as they say in crypto, “not your keys, not your coins.” Other disadvantages are higher costs associated with holding crypto since ETFs charge fees for active management. Finally, even though investing in ETFs reduces the risk of holding an asset, price swings in the underlying cryptocurrency are likely to be reflected in the investment vehicle too.
The XRP price is poised for a significant rally as its technical indicators and fundamentals converge. It has formed a giant bullish pennant pattern, while Ripple Labs is supercharging its ecosystem growth organically and through acquisitions. This article explores whether XRP can realistically surge from $2.2 to $100 by 2030.
XRP has some of the best fundamentals in the crypto industry. First, the network recently launched a stablecoin that is slowly gaining market share in the crypto industry. It has already crossed the important milestone of a $320 million market cap, and this growth will likely continue in the coming years.
RLUSD remains a small player in a large pond, where Tether (USDT) dominates with its $148B market capitalization. Still, eventually, RLUSD will become a significant part of the XRP Ledger due to the estimated market size of the stablecoin market.
Visa estimates that these tokens will be worth $1.6 trillion by 2030. If this is true, and RLUSD achieves a 5% market share, it will have over $80 billion in assets. Assuming that US Treasuries yield 3% annually by then, it will generate more than $2.4 billion in annual revenue.
Second, there is a likelihood that the Securities and Exchange Commission (SEC) will approve over ten spot XRP ETFs this year. JPMorgan estimates inflows of $8 billion in the first year. Assuming this is accurate, and assuming that the annual inflows will average $1 billion, it means that there will be more than $13 billion in inflows by then.
Third, and most importantly, Ripple is keen to become a major player in the payment industry. The RippleNet payment technology is widely seen as a better option compared to Swift because of its faster speeds and low transaction costs.
With the SEC vs Ripple case done, there are signs that it will focus on this business in the next few years and gain market share. Again, a 10% market share is a huge one for the XRP Ledger. Since Swift handles $150 trillion a year, it means that the RippleNet would be handling $15 trillion.
Read more: XRP Price Forecast: Should You Sell in May and Go Away?
Everything is usually possible in the crypto market as evidenced by Bitcoin’s surge from below $1 in 2009 to nearly $100,000 today. However, it seems like a far-fetched idea that the XRP price will surge from the current $2.2 to $100 by 2030.
XRP has a market cap of $130 billion. Assuming its circulating supply remains intact at 58.4 billion by 2030, it means that the coin will have a market cap of over $5.8 trillion. XRP would have a fully diluted valuation of $10 trillion if it jumped to $100 by 2030. These are huge numbers considering that the world Gross Domestic Product (GDP) is about $110 trillion today.

The most optimistic XRP price forecast predicts a price of approximately $24, representing a 990% increase from the current level. Such a move would bring its market cap to $1.4 trillion, less than Bitcoin’s $1.9 trillion.
This target is achieved by using the weekly chart above. This chart shows that the coin is slowly forming a giant bullish pennant pattern whose flagpole is 620% tall. Measuring the same distance from the upper side of the flag points to a surge to $24.
Everything described above needs to happen perfectly, and the crypto market needs to be on a strong rally.
In an environment like that, it’s very difficult to get overly aggressive in the Bitcoin market. The 50 day EMA and the 200 day EMA both sit in this area. And with that being said, it does make a certain amount of sense that we would continue to see a little bit of hesitation if we can break above the $86,000 level, then we go looking at the $90,000 area. This is an area that will continue to be massive in its implications.
Underneath, if we were to break down the $75,000 region is an area of pretty significant support. I think Bitcoin remains very noisy over the next several weeks. But if we can finally clear that $90,000 level, that will be the sign that traders are willing to step in and start picking things up again. In that environment, breaking the $90,000 level, I think opens up $100,000, which of course is a large, round psychologically significant figure.

After that, you have the $110,000 level, which had been a bit of a problem area for buyers, but that would obviously be the target. If we were to break down here, then somewhere around $65,000, you’ll have a pretty significant supply. This is an area that has been important for some time, and I think this continues to be a region you will have to pay close attention to.
Ready to trade daily Bitcoin forecast? Here are the best MT4 crypto brokers to choose from.
DOGE, the most well-known meme coin, has been in the spotlight for over a decade with its unpredictable price swings — and April 2025 was no different. Although the token gained 2.5% compared to March, it’s currently seeing a slight decline.
So, what could May bring for Dogecoin (DOGE)? Will the trend shift again, or is a slowdown likely to continue? Here’s what we know in our Dogecoin price prediction for May 2025.
Dogecoin was launched in 2013, originally inspired by the viral Shiba Inu meme, but it quickly gained traction as a serious cryptocurrency. Over the years, it has built a dedicated global community and attracted attention from major public figures like Elon Musk.
Technically, Dogecoin runs on a Litecoin-based codebase and uses the Scrypt algorithm, enabling faster and cheaper transactions than Bitcoin. One key characteristic is its unlimited supply — new coins can be mined without a cap, which makes it an inflationary digital asset rather than a deflationary one.
What factors could shape Dogecoin price prediction for May 2025? Is Dogecoin a good investment?
Nasdaq has officially taken a big step toward making DOGE more accessible by applying to the U.S. SEC for the first-ever 21Shares Spot Dogecoin ETF in April 2025. If it gets approved, investors would be able to invest in Dogecoin without the need for crypto wallets.
Such approval could significantly influence Dogecoin’s price by introducing new demand from both institutional and retail investors who previously stayed away from crypto due to complexity or regulatory concerns.
The added credibility and accessibility from a regulated ETF could drive up investor confidence, increase liquidity, and potentially lead to upward price momentum — particularly if launched during a favorable market cycle or crypto bull run.
As of April 30, 2025, DOGE is trading at $0.17, down about 5% in the past day and week.
In May 2025, we could see Dogecoin’s price move up and down, depending on a few important happenings in the market. One of the biggest factors is the ongoing talk around the 21Shares Dogecoin ETF. If the SEC gives the green light for the ETF, it could spark more interest from institutional investors and possibly lead to a significant price increase.
Additionally, Dogecoin’s price may be affected by overall market conditions and broader cryptocurrency trends. Any news regarding regulatory changes, network upgrades, or major partnerships could further impact its price.
On the flip side, market corrections or delays in ETF approval could exert downward pressure, resulting in short-term price declines.
What are the analytical platforms forecasting in their Dogecoin price prediction for May 2025? Will Dogecoin go up or down?
CoinCodex’s Dogecoin coin price prediction suggests that DOGE could see a small drop next month, with the potential to lose 2.45% and remain at approximately the same price level of $0.17 by May 29.
The DOGE price prediction for April 30 leans bearish, as 18 indicators signal a decline, while 11 suggest a possible rebound.
According to DigitalCoinPrice’s Dogecoin price forecast, DOGE might increase by nearly 78% in May, potentially reaching a maximum price of $0.36.
Wallet Investor’s DOGE projections are also positive, indicating that the meme coin could reach a maximum price of $0.255 by the end of May.
Should you invest in Dogecoin? Only if you’re okay with some volatility. There’s a lot of excitement around its community and the possible ETF, but expectations for May 2025 are mixed, so it’s worth being cautious.
What happens with DOGE next month will depend on market events and time.
Disclosure: This article does not represent investment advice. The content and materials featured on this page are for educational purposes only.


")
