The main tag of cryptocurrency price today Articles.
You can use the search box below to find what you need.
[wd_asp id=1]
The main tag of cryptocurrency price today Articles.
You can use the search box below to find what you need.
[wd_asp id=1]
Dogecoin price could surge significantly in the future, with projections showing up to a 3,700% increase at a $1 trillion market cap.
Notably, the largest meme coin has entered another consolidation phase after a brief rally that saw its price briefly surpass $0.19. As of now, Dogecoin trades around $0.174, and despite recent bearish trends, longer-term market sentiment remains positive.
Market watchers are specifically optimistic about the future, predicting potential price surges if Dogecoin’s market capitalization grows. At press time, Dogecoin’s market cap is around $26 billion.
Notably, with a $100 billion market cap, DOGE could reach approximately $0.6709. This represents a 285.55% increase from its current price of $0.174.
If Dogecoin were to achieve a $500 billion market cap, its price could climb to around $3.35, marking a significant 1,827.82% increase.
Additionally, if Dogecoin were to hit a $1 trillion market cap, it could rise as high as $6.71, reflecting an astronomical surge of about 3,755%. These projections, though ambitious, highlight the potential for substantial long-term growth, depending on how the market evolves.
It is worth mentioning that this analysis assumes Dogecoin’s current supply of 149 billion tokens remains the same.
Analysts at Changelly have provided additional insight into Dogecoin’s potential price trajectory over the next decade. According to the platform, DOGE could hit $0.6 by June 2029.
Furthermore, Dogecoin might reach $3.2 by February 2034, with an average price of $3.40 and a maximum of $4. By November 2034, Changelly expects DOGE to surpass $5.
Amid the decade-long predictions, several technical analysts have pointed to key patterns that suggest how Dogecoin’s price may perform. MasterAnanda, for instance, noted that Dogecoin has recently completed an ABC correction, positioning the crypto for a potential bullish rally.
The correction began from a high of $0.4846 on December 8, 2024, with the first wave seeing a 46% drop to $0.2626. The B-wave then saw a 66% rebound to $0.4350 in January, followed by a C-wave, which resulted in a 70% drop to local support at $0.1298.
While Dogecoin has rebounded from this support level to its current price, the analysis suggests the asset remains undervalued. MasterAnanda projects a possible rally to $0.703.
In addition, Trader Tardigrade examined Dogecoin’s price action using a three-day chart spanning from 2014 to the present. The chart reveals multiple symmetrical triangle formations, which have historically preceded significant breakouts. After the final breakout in late 2024, Trader Tardigrade now forecasts a potential surge to $2.9.
DisClamier: This content is informational and should not be considered financial advice. The views expressed in this article may include the author’s personal opinions and do not reflect The Crypto Basic opinion. Readers are encouraged to do thorough research before making any investment decisions. The Crypto Basic is not responsible for any financial losses.
XRP jumps as XRPL Labs founder proposes 90% reserve cut. Lower costs may boost adoption, while technicals hint at bullish continuation near $2.22.
Ripple’s XRP is seeing renewed interest after Wietse Wind, founder of XRPL Labs, proposed a 90% reduction in the XRP Ledger’s minimum reserve requirement.
This reserve, set to prevent network spam, is the amount of XRP users must hold to activate a wallet. Wind’s proposal is currently under review and would make it easier for developers and users to interact with the XRPL ecosystem.
Why? Lowering costs for newcomers while keeping security. By reducing the reserve requirement the network can invite more participation, from startups building on XRPL to individual users trying crypto for the first time. If passed it would be a big shift in accessibility and usability for the XRP ecosystem.
XRP/USD
The market responded fast. After the proposal was announced XRP went past $2.22 with big buying pressure, evidenced by large withdrawals from Binance – long term holders are moving tokens off exchanges in anticipation of more gains. 24 hour trading volume reached almost $3 billion, XRP is in the top 5 by volume.
The reserve cut aligns with a broader strategy to increase on-chain utility. Lower entry costs will encourage wallet creation, dApp usage and more XRPL accounts.
Key Points:
This is happening against a complex regulatory backdrop as Ripple is talking to the SEC and waiting for clarity on crypto policy. Analysts say easing regulatory pressure + lower ledger costs will cement XRP as a leading digital settlement asset.
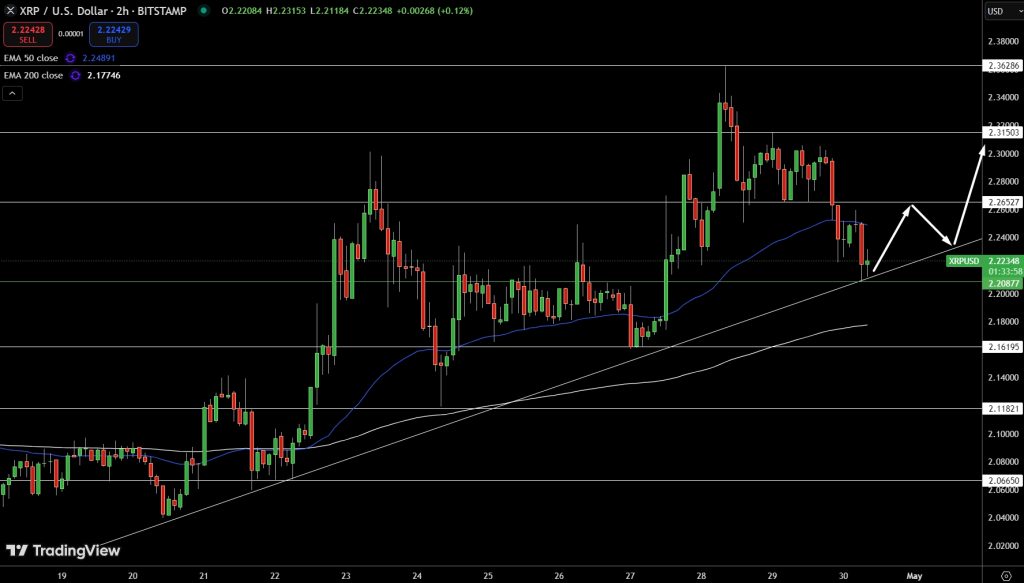
From a technical standpoint XRP/USD is showing strength. Price is hugging the rising trendline near $2.22 – an area that has been a launchpad since mid April. The 50 EMA at $2.25 is now resistance, $2.20 is the support level. Below that the next floor is $2.1619.Candlesticks show long lower wicks, buying is strong. 200 EMA at $2.1774 is still up, bullish trend is intact. MACD is flat, consolidation before the next move. A clean break above $2.2652 and XRP will target $2.31.
Trade Setup:
As long as bulls hold this trendline with volume XRP will keep the bullish momentum and attract new interest with network utility upgrades.
Maham Arslan
Crypto News Writer | Blockchain & Web3 Reporter
Maham is a crypto news writer and market analyst specializing in breaking down the latest developments across blockchain, digital assets, and decentralized finance (DeFi). With hands-on experience covering high-impact stories—from regulatory shifts and token launches to macro-driven price movements—she delivers timely, accurate, and SEO-optimized content for fast-growing crypto media platforms.Her expertise lies in producing daily news reports, price predictions, technical summaries, and coverage of market-moving events. Maham tracks real-time updates across global newswires, X (Twitter), and on-chain data to provide actionable insights tailored for retail traders, crypto enthusiasts, and institutional readers.With a strong grasp of crypto fundamentals and Web3 trends, she delivers content that’s informed, accessible, and always on time.
Solana targets $180 as transfer volume, capital inflows, and DePIN dominance fuel bullish momentum.
Solana’s momentum is clearly accelerating, backed by a sharp rise in transfer volumes, growing on-chain activity, and improving price structure. After a strong breakout, attention is now turning toward the $170 zone, a level that’s starting to look more achievable as broader market sentiment leans risk-on. With fresh inflows and rising network strength, the current Solana price prediction is beginning to carry more weight.
Blockchain activity is heating up again, and the latest transfer volume stats shared by research platform cryptorank.io reveal where real momentum is building. With around $300B moved in just 30 days, USDT remains the dominant force, but it’s the Layer 1 battleground beneath the surface that has caught attention.
Solana surpasses Ethereum and BNB in transfer volume, moving $28.07B in 30 days. Source: CryptoRank via X
Solana just pulled ahead of Ethereum and BNB in net transfer volume, clocking in at $28.07B and firmly securing second place behind stablecoins. That’s not just a chart win, it’s a signal of growing real-world usage across the ecosystem. As more value flows through the Solana network, the bullish case for $SOL only gets stronger, especially with fundamentals now lining up with technical strength.
In an interesting detail shared by an on-chain & financial metrics platform, Glassnode, over the past 7 days, Solana’s hot capital doubled, jumping by $4.72B to reach $9.46B, its highest since March. That marks the largest weekly spike since January, signaling a rapid return of activity and confidence to the network.

Solana sees $4.72B in fresh capital inflows in one week, hitting $9.46B and marking its biggest spike since January. Source: Glassnode via X
With Solana already taking the lead over Ethereum and BNB in transfer volume, this surge in fresh capital is a bullish confirmation. It reflects rising institutional interest, growing liquidity, and increasing conviction behind SOL.
After weeks of grinding through a downward channel, chart analyst AMCrypto believes that the short-term downtrend for Solana price is done. It is now convincingly pushing past the trendline resistance of the wedge, and that too with strong bullish momentum. The sharp move came on the back of a clear reversal structure and healthy volume, reinforcing the strength behind this rally.
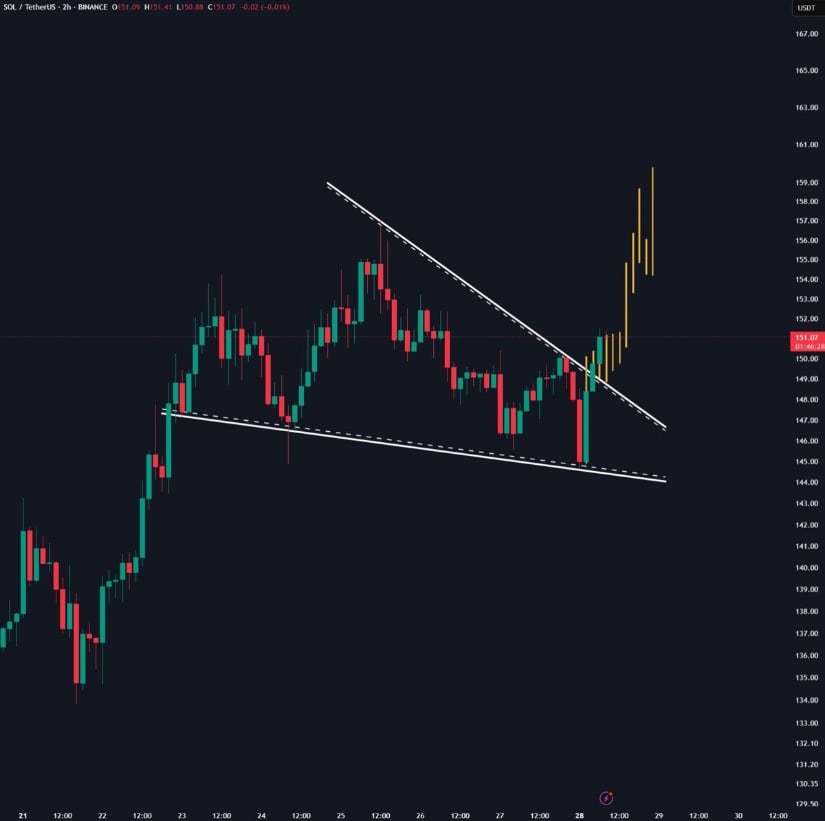
Solana breaks out of a falling wedge with bullish momentum, setting sights on the $170 to $180 price zone. Source: AMCrypto via X
According to AMCryptoAlex, Solana has cleanly broken out of a falling wedge pattern and is now trading around $145. If SOL Solana price holds this breakout, immediate targets lie around $170 to $180. Should momentum continue, a new all-time high could be in play by Q3 or Q4, especially as demand-side factors begin to align with this technical setup.
While the breakout narrative gains traction, another seasoned analyst, Crypto Target, argues that the recent bottom was more than just support; it was a classic bear trap. His chart outlines how SOL reversed sharply from the $116 to $120 range after trapping shorts, flipping the script with a swift V-shaped recovery. The Solana price is now charging toward the $160 to $165 resistance zone, which aligns with prior key supply levels.
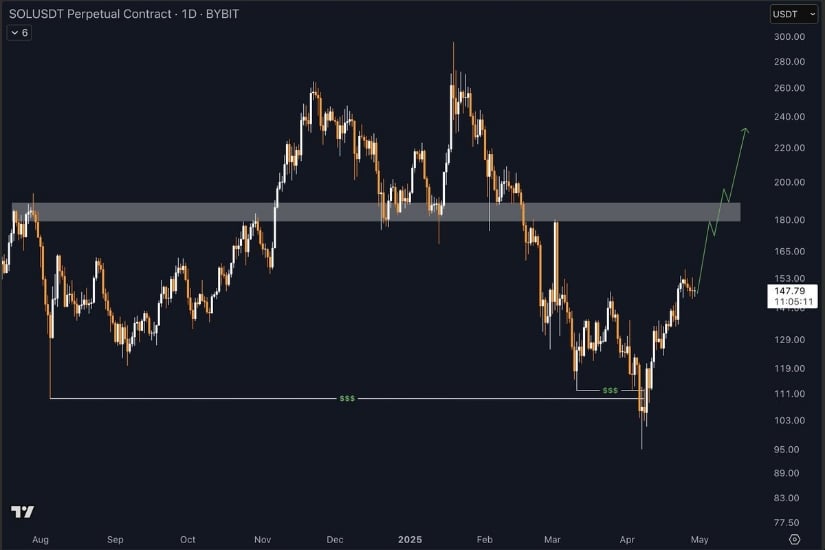
Solana’s V-shaped recovery signals strong bullish momentum. Source: Crypto Target via X.
With Solana already leading in transfer volumes and fresh capital inflows confirming renewed confidence, this setup could be the beginning of a more sustainable price rally ahead. The Solana Price Prediction shared by Crypto Target points to that possible ongoing expansion phase, with eyes set firmly on the $220+ mark.
Solana confirms yet another lead, as fresh data from Dune Analytics, shared by The Solana Post, shows Solana now holds a massive 46.5% of the total DePIN market cap, more than any other blockchain. What makes this even more impressive is that this dominance comes with just 17 Solana-based assets compared to 70 on EVM chains, which only account for 39.3%.
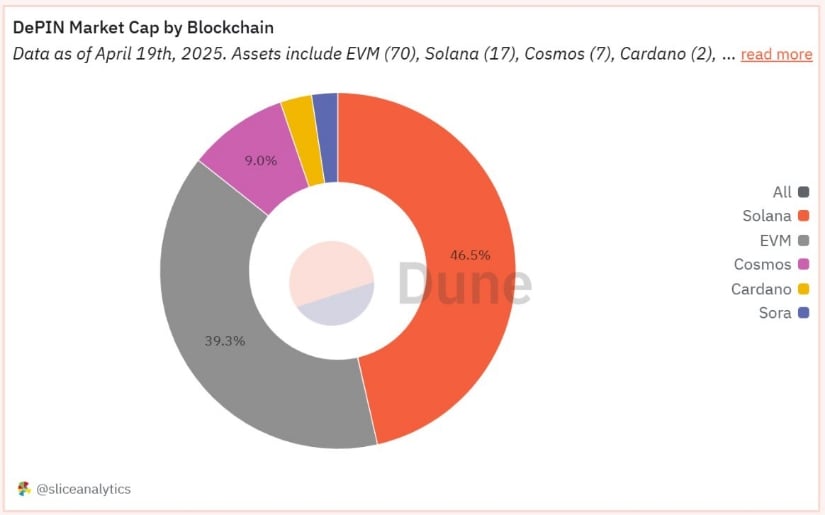
Solana dominates the DePIN market with 46.5% share, signaling strong growth potential and laying the groundwork for price appreciation. Source: The Solana Post via X.
The Solana Post believes this growing dominance in DePIN isn’t just about market share, it’s laying the groundwork for potential price appreciation. As we’ve seen with Solana’s breakout above $150 and rising transfer volumes, real-world usage is starting to catch up with technical strength. Add in the $4.7B capital inflow last week, and the pieces are coming together for a much stronger bullish narrative heading into the second half of 2025.
Solana is closing in on a strong narrative heading into the second half of 2025. With a clean breakout above $150, rising DePIN dominance, and billions in fresh capital flowing in, the network is aligning both technicals and fundamentals. If price holds above $165, the next leg toward $180 and possibly $220 could be within reach. Momentum is building, and Solana might just be setting the tone for the next big Layer 1 run.
Ripple (XRP) is in the spotlight yet again, riding high on the news of the SEC’s approval of three ProShares XRP ETFs, including leveraged and short positions. This milestone marks a significant turning point for Ripple after its lengthy legal battle with the SEC, which wrapped up in March. These developments are fueling bullish sentiment, and analysts are closely watching XRP’s market performance amid these breakthroughs. But while Ripple’s recent successes gain attention, savvy investors are setting their sights on a more lucrative opportunity in Ruvi AI , the innovative blockchain project offering unmatched presale rewards for early participants.
Ripple’s long-awaited regulatory win and the launch of its ETFs are reaffirming investor confidence, potentially heralding a new wave of institutional interest in XRP. With futures ETFs providing exposure to both long and short positions, traders have new tools to capitalize on market momentum. However, these gains may pale in comparison to the potential returns Ruvi’s early-stage investors can achieve.
Ruvi is shaking up the blockchain space by focusing on real-world solutions for global industries like healthcare, data security, and supply chain logistics. This isn’t just another speculative token. Ruvi integrates AI-driven technology to tackle inefficiencies and enhance productivity in critical sectors. Its blockchain platform is built for sustainable scalability, ensuring lasting value beyond the typical market hype.
Ruvi’s presale rewards structure offers early investors a unique chance to maximize their returns. Here’s a glimpse into how participation in the presale can amplify your portfolio:
This model doesn’t just benefit individual investors but empowers the community to actively participate in Ruvi’s success.
Ruvi’s rewards extend far beyond financial gains. The project is cultivating a decentralized ecosystem with real opportunities for participants to shape its growth. From governance rights to beta access to cutting-edge blockchain tools, Ruvi ensures its investors are integral to the decision-making process.
Additionally, early supporters benefit from NFT-based incentives, providing exclusive access to collectible assets and additional income streams. Combine this with Ruvi’s low-token-entry point, and it’s clear why this project is considered a game-changer in the blockchain space.
While Ripple’s ETFs signal progress for crypto mainstream adoption, Ruvi’s presale offers a rare opportunity to join a project still in its ground-floor phase. Ruvi differentiates itself by solving real-world challenges, delivering extraordinary value aligned with long-term growth.
Ripple’s bullish run may be grabbing headlines, but Ruvi is where the smart money is heading. Its presale rewards structure is designed to offer unprecedented upside, making it the ultimate crypto investment opportunity of 2025.
Don’t wait for the rewards to diminish or the presale to sell out. Seize your chance to join Ruvi today and secure your position in a blockchain revolution. The future is Ruvi, and there’s no better time to act than now.
Learn More
Buy RUVI: https://presale.ruvi.io
Website: https://ruvi.io
Whitepaper: https://docs.ruvi.io
Telegram: https://t.me/ruviofficial
Twitter/X: https://x.com/RuviAI
Try RUVI AI: https://web.ruvi.io/register
Post Views: 113
Ripple (XRP) price jumped 1.9% in the last 24 hours to trade at $2.27 on a 65% surge in trading volume to $4.8 billion. Today’s gains are a 7.5% increment over the past week.
The price spike came after news broke that the U.S. Securities and Exchange Commission (SEC) greenlit ProShares Trust to launch three XRP futures exchange-traded funds (ETFs).
The financial instruments are set to hit the market on April 30, 2025. Will XRP cement a bullish momentum with this news?
The SEC’s approval of ProShares’ XRP futures ETFs is the talk of the town. Crypto analyst John Squire shared in an April 27, 2025, X post that these ETFs won’t directly hold XRP tokens. Instead, they will track Ripple price movements through futures contracts.
This move is a big deal for institutional exposure. It gives Wall Street a regulated way to bet on the price of XRP without touching the real stuff. John Squire outlined key benefits in his post.
These include increased legitimacy in traditional finance, a stronger positive narrative for XRP adoption, and heightened institutional interest. But here’s the thing: there is no direct buying pressure on XRP’s supply, meaning no immediate price explosion.
Plus, futures ETFs can bring volatility and hidden costs like rollovers and slippage. The market reacted swiftly, with over $30 Million in Ripple trades reported within 30 minutes of the launch buzz. This surge reflects strong interest from whales, indicating significant investor activity.
Meanwhile, XRP price got a little pump, making it the top gainer among the top 10 tokens on April 28. But not everyone’s popping champagne.
Critics acknowledge the futures ETF as progress but emphasize its limitations. Many in the community believe a spot XRP ETF would be the breakthrough.
However, it remains highly anticipated. Brazil reportedly already has a spot XRP ETF by Hashdex, leaving the U.S. lagging. Analysts remain bullish, predicting the Ripple could hit $5 short-term and even $20 long-term if a spot ETF gets approved.
The XRP/USDT 3-day chart reveals a sharp 50% correction, pulling back from recent highs. Despite this setback, bullish momentum remains strong, signaling potential recovery ahead.
The chart also shows a breakout above a bull pennant, signaling that bullish momentum is building up. The RSI has hovered around 60, indicating neutral-to-bullish conditions buoyed by a nice, steady grind to the upside.
A Fibonacci retracement level at $2.32 is the next immediate resistance. If XRP breaks this level, it could trigger a push toward the $3.00 psychological barrier. Intense FOMO might drive momentum even further, potentially revisiting the previous high of $3.39.

If Ripple falls below $2.05, bears could gain control over the market. A further decline might see targets around $1.97 or even $1.62, signaling increased bearish pressure.
The April 30th XRP futures ETF launch could bring more volatility in the short term. Albeit it won’t directly pump XRP price, the increased exposure might draw more institutional players. This set the stage for a spot XRP ETF down the road.
If Ripple remains above $2.05 and breaks above $2.32, the price could rally to $3.39 in the coming weeks. In the long term, the community is banking on a spot XRP ETF.
A total of 18 spot XRP ETF filings are currently under SEC review, adding to market anticipation. Approval deadlines from major firms like Grayscale and Bitwise in October 2025 heighten the stakes for investors.
A spot ETF would mean real buying pressure, potentially sending the price of XRP to double digits. XRP is at a pivotal moment.
The ProShares futures ETF launch is a flex for its legitimacy, but the real fireworks will come with a spot ETF. The chart shows bulls are still in the driver’s seat, with $2.32 and $3.39 as the following significant levels to watch.
In this article, the views, and opinions stated by the author, or any people named are for informational purposes only, and they don’t establish the investment, financial, or any other advice. Trading or investing in cryptocurrency assets comes with a risk of financial loss.

Disclaimer: This is a Press Release provided by a third party who is responsible for the content. Please conduct your own research before taking any action based on the content.
Solana’s chart is coiling into a signature coil, and everybody is thinking about one question: can this market-leading layer-1 treasury move from the mid-$140s to the $180 marker underlined in today’s news header?
The momentum indicators already reflect early green, whales are re-stacking on-chain, and a tidal wave of Pay-Fi news is fueling euphoria across the board. On the other side, Remittix (RTX) gains traction, giving SOL investors another high-beta proxy on the same payments theme.
The first move in any Solana price prediction this week is the $150 pivot. After falling to $146.70 (down 2.05 %), SOL recovered on rising spot volume that has nearly doubled to $3.69 billion over the last 24 hours. A bullish engulfing candle on the four-hour chart, along with an RSI reset to 42, suggests sellers may be exhausted.
If bulls can close the daily candle above the 20-day EMA at $150, then the next resistance band at $163 just so happens to be the price at which Binance liquidation heat maps are demarcated by large short interest poised to be squeezed. Breaking there would open the way for the road to the psychological goal of $180 that governs this Solana price forecast cycle.
Under the bonnet, wallets with balances of 10,000 – 100,000 SOL have slept with around 920,000 coins since 1 May, according to CoinMarketCap records. That accumulation is simultaneous with institutionally themed news such as Worldpay’s decision to add USDG settlements on Solana rails and DeFi Development Corp’s $1 billion SOL treasury proposal.
All of them kindle the fantasy that Solana’s fee market could see explosive growth, the key driver for any medium-term Solana price prediction. Options desks note: seven-day call skew stands at 14 %, an increase from –2 % last week, meaning traders are happy to pay a premium for upside protection.
Not everyone is predicting smooth sailing for the rally. Funding rates on perpetuals have risen to +0.12 %, their highest since March, as long positions are building. Meanwhile, social-media chatter of Solana validator intermittent outages continues, and a further glitch could derail momentum.
To maintain the $180 Solana price prediction on track, bulls must continue to hold the $140–$143 demand zone firm since late April. A clean breakdown below would turn the structure bearish and resurrect the 200-day MA at $128 as a contender.
While SOL enjoys SOL eyes $180, Remittix (RTX) has the imagination of the same deep-pocketed investors. At $0.0757 a price, the token has already had $14.6 million pre-committed and 530 million RTX in circulation.
Remittix’s value proposition is straightforward: users can remit BTC, ETH, XRP—or even Solana itself into a non-custodial bridge and receive local fiat in their bank account in mere minutes. That “crypto-in, cash-out” approach has grown daily active users 17 % week-over-week as small Nigerian and Filipino traders adopt the service.
Each exchange burns a portion of RTX, making usage dependent on scarcity. Future Solana Pay and EVM integrations in Q3 will integrate the protocol into millions of wallets, a future not beyond Solana whales who have already started accumulating stealth positions.

Management is also seeking EU e-money licenses and a U.S. MSB registration, measures that can unlock compliant channels in more than 50 jurisdictions. If those licenses come on schedule, analysts see RTX outpacing today’s price by multiples, powered not by inflationary staking rewards but by real, fee-share earnings.
Early OTC desk models suggest that if Remittix can merely capture 0.05 % of the $190 trillion global payments market, fee flows on an annualised basis would justify a $1 valuation in the next cycle.
And for SOL holders unwilling to leave the payments thesis but who would like some diversification, RTX offers an asymmetric kicker—one that could outperform even an aggressive Solana price target.
Bottom line: a steady close over $150 supports the $180 Solana price target, with increasing institutional inflows and long derivatives positioning providing fresh tailwinds. But the wisest pockets aren’t playing Solana for a cinch—they’re playing Remittix for outsized upside too. Together, the pair might define the payment story of the next bull cycle.
Join the Remittix (RTX) Community
Disclaimer: This is a Press Release provided by a third party who is responsible for the content. Please conduct your own research before taking any action based on the content.
/div>
Over the past 30 days, the memecoin market has displayed a massive comeback. Notably, the Meme segment has added 17.42% in its valuation to $56.16 billion from $47.66 billion. With this, top meme coins have added notable value to their respective portfolios.
Reportedly, the Dogecoin price today is exchanging hands at $0.17659 with an intraday trading volume of $917.05 million, a massive drop of 30.86%. However, this memecoin has surged 6.89% this month, highlighting an increase in the bullish sentiment for the altcoin in the longer time frame.
Moreover, the rule change in filing to list 21Shares Dogecoin ETF by NASDAQ could play a crucial role in the price action of this altcoin during the upcoming month.
With its next major test zone around the $0.20 mark, will Dogecoin price maintain its bullish stance and lead the memecoin market toward a major bullish cycle. In this article, we bring you the monthly DOGE price prediction.
After experiencing a nose dip this year, the market dominance of Dogecoin memecoin has stabilized for the first time. Notably, this memecoin has witnessed a sideways trend with a minor variation during the entire month of April, highlighting a decline in the bearish force.
On the other hand, the Open interest of this project has increased from 973.13 million to 1.53 billion, a jump of 57.22% in just 29 days. This suggests a massive rise in the accumulation phase for the largest Ethereum-based memecoin in the crypto market.
Open interest (OI) is a vital metric in the world of cryptocurrencies as it provides crucial insights into the market’s liquidity and sentiment. Ideally, it highlights the total number of outstanding contracts that have not been settled or closed at the time of analysing.
As the crypto market stabilizes, the DOGE crypto price displays a neutral price action over the past week. This highlights a cool-off in the buying and selling pressure for the largest memecoin. Notably, this memecoin is on the path of forming a strong bullish trajectory with a strong support around the $0.15 mark, suggesting a positive outlook.
The EMA 50-day acts as a vital support to the Dogecoin price chart around the $0.1790 mark. On the other hand, the EMA 200-day displays a potential retest around the $0.22 range in the daily time frame. This suggests a mixed price action for the largest meme coin in the market.
Furthermore, the RSI indicator continues hovering above the neutral point in the daily time frame. With its average trendline constantly acting as a support, this meme coin may continue gaining momentum in the upcoming period.
If the odds favor the bulls, in that case, the Doge coin price could prepare to retest its immediate resistance level of $0.20. Maintaining the value above that level could result in it pushing its price toward the upper resistance level of $0.25 during May.
Conversely, a bearish pullback may result in it dropping toward its $0.15 mark. Reportedly, if the bulls fail to regain momentum at that point, the DOGE memecoin could plunge toward its crucial support level of $0.125 in the coming time.
Also Read: Bitcoin Price Prediction For May 2025: BTC To Hit $100k?
ADA Targets $0.88 Level as Cross-Chain Integration and ETF Speculation Fuel Bullish Momentum.
Cardano’s latest moves toward deeper Bitcoin integration are creating a fresh wave of interest across the crypto space. With major developments like the Bitcoin bridge and rising ETF speculation in play, ADA’s outlook is starting to shift positively.
Cardano takes a major step toward deeper cross-chain integration. Charles Hoskinson has confirmed that a Bitcoin bridge and Bitcoin integration into Cardano’s Lace wallet are officially in the works. This update, shared by TapTools, marks a potential game-changer for how ADA and BTC can interact within the Cardano ecosystem, opening the door for new liquidity flows and cross-chain use cases.
Cardano advances Bitcoin integration with new bridge and Lace wallet integration plans. Source: TapTools via X.
If Cardano can seamlessly integrate Bitcoin, it would strengthen the network’s position among multi-chain platforms. With recent developments in the pipeline, Cardano could be setting up for a quietly powerful narrative shift heading into the rest of 2025.
Cardano is once again closing towards a bullish breakout. As highlighted by analyst Ali Martinez, ADA is approaching a major resistance level at $0.74, which is the upper boundary of a descending parallel channel that has capped price action for months. If bulls can finally push through this technical ceiling, it could open the door for a fresh move up toward $0.88, a level that aligns with previous support-turned-resistance from early Q1.

Cardano’s ADA nears key breakout zone at $0.74, with eyes set on a potential move toward $0.88. Source: Ali Martinez via X.
Ali Martinez believes that while momentum has been gradually building, ADA needs a clean and sustained close above this zone to confirm any bullish continuation. With on-chain developments like Bitcoin bridge news adding positive narrative fuel, momentum may be quietly building.
As Cardano continues to gain ground behind the scenes, ETF speculation is heating up. According to Polymarket data shared by Crispy, the odds of an ADA ETF launching in 2025 have surged dramatically, from just 20% to 70%. That’s a big shift in sentiment and suggests that institutional interest in Cardano is gaining momentum.
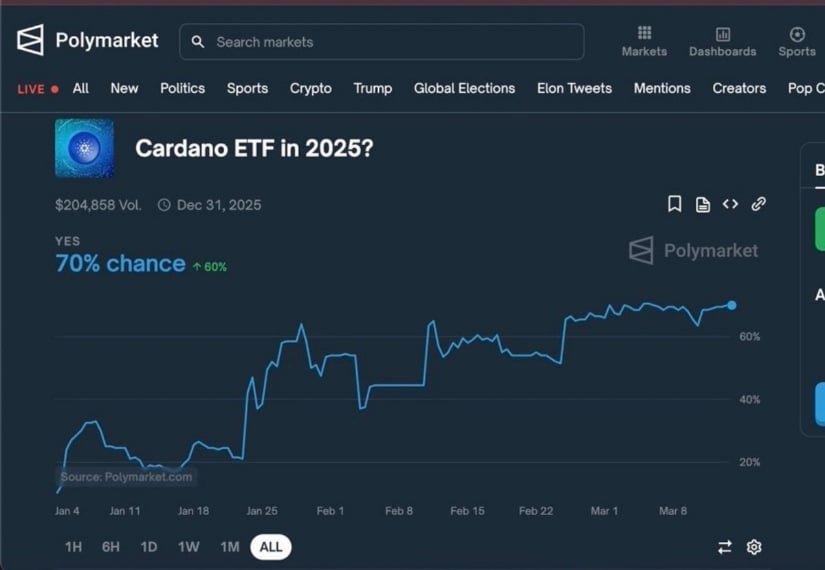
Speculation around a potential ADA ETF surges, with odds jumping from 20% to 70%. Source: Polymarket via Crispy.
ADA Cardano price movements will positively react to these macro catalysts, especially when paired with improving technicals. With price still trading within a broader consolidation range, sentiment-driven catalysts like the ETF buzz could potentially lead to a breakout, especially from a descending parallel channel.
ADA Cardano price is forming a strong technical structure as it continues to ride the momentum from recent developments like the Bitcoin bridge announcement. Price action is respecting an ascending trendline while repeatedly testing the $0.69 to $0.70 zone, which now acts as a solid support level. Analyst KlejdiCuni shows, ADA is currently trading above this key structure, suggesting buyer strength remains intact. A move above the short-term resistance at $0.74 could quickly send ADA to the $0.76 “quick target” zone.
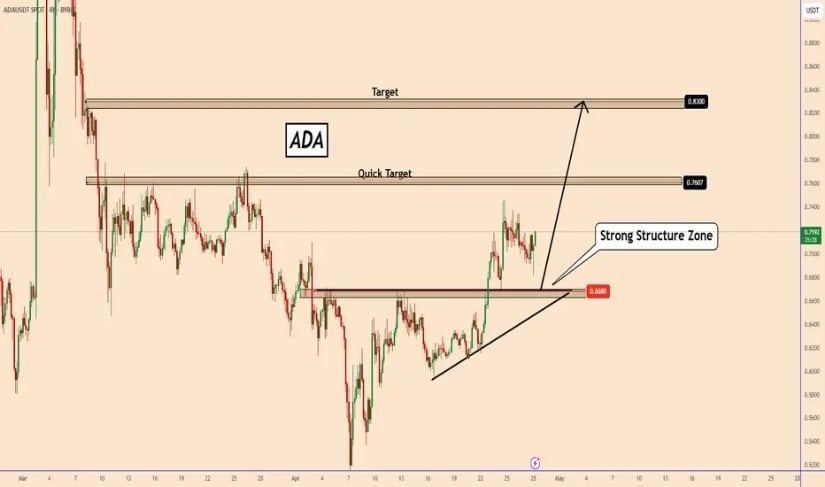
Cardano holds strong above key trendline support, eyeing $0.76 and $0.83 as next upside targets. Source: KlejdiCuni via TradingView.
Looking further ahead, the broader setup hints at a potential push toward $0.83, a level that lines up with the next major resistance from March. Combined with the recent boost in sentiment around cross-chain integration and ETF speculation, the technicals offer a promising backdrop heading into May.
Amid the ongoing technical and fundamental developments, the Cardano community is showing clear confidence. Fresh community sentiment data from CoinMarketCap shows that around 89% of nearly a million voters are leaning bullish on ADA, while only 11% see things turning bearish. That’s a pretty strong signal, especially when it lines up with everything else happening around Cardano right now, from the Bitcoin bridge news to ETF rumors heating up.
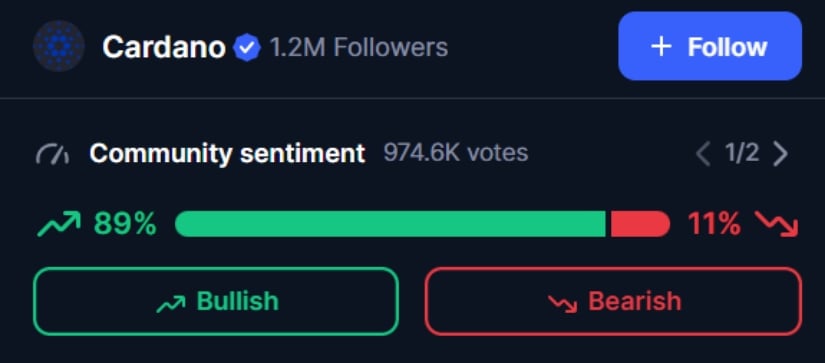
Cardano community shows 89% bullish sentiment for ADA. Source: CoinMarketCap via X.
As the majority leans positive, it doesn’t guarantee a rally, but it does suggest that momentum is quietly building for ADA. If price action can back this sentiment with a strong technical breakout, especially above key levels like $0.74, the current Cardano Price Prediction aiming toward $0.76 and possibly $0.83 could positively reflect in price.
Cardano is starting to line up a lot of things in its favor, both on the charts and behind the scenes. With the combination of a bullish community sentiment, strong support structure, and upcoming catalysts like Bitcoin bridge integration and ETF speculation, a solid foundation for cautious optimism is created. And technically, if ADA can clear resistance levels around $0.74, the current Cardano Price Prediction targeting $0.83 to $0.88 could gradually play out.
Ripple has been one of the most important names in the cryptocurrency market for a long time, and at its current price of approximately $2.15, the asset seems primed for a bullish run. Ripple is not the only cryptocurrency that is in the news in 2025. Ripple is showing bullish signs, while another upcoming project, , is gaining massive attention from investors. Rexas Finance is primed for enormous growth and could go from a price of $0.20 to $20 by the end of 2025, which would be a 100x increase. Early investors would greatly benefit if such an increase occurs. Positive news concerning XRP and market observers suggest the cryptocurrency might reach a price point of $6.50 in the next 3 months due to a combination of legal wins and increased token usage. Investors willing to check XRP’s growth usually find this status appealing. However, with Rexas Finance (RXS) still in the presale stage, there is limitless potential for making gains through Rexas Finance (RXS).
After outpacing Ethereum in volume, does Solana price prediction imply a structural rally capable of pushing SOL towards higher zones?
Solana (SOL) is beginning to find its footing after a steady decline through March and early April. As of Apr. 29, SOL is trading around $148.96, with a market cap of approximately $77 billion.
The recent recovery follows a move where Solana reached a multi-week high of $153 on Apr. 28. This gain was supported by improving sentiment across the broader altcoin market as well as a rally in Bitcoin (BTC).
Although SOL has experienced a minor pullback of about 2.5% over the past 24 hours, trading activity remains strong. Daily volume has reached around $3.08 billion, indicating renewed engagement from traders.
On a weekly basis, Solana has gained close to 10%. The recovery suggests that buyers are gradually returning after a longer correction phase that began when the price declined from around $178 in early March.
With market conditions showing signs of shifting and Solana appearing to stabilize, it is worth taking a closer look at what is unfolding around SOL and exploring the current Solana price outlook.
Solana’s recent strength can be traced back to several key developments that are expanding its role within decentralized finance.
Over the last 24 hours, Solana captured nearly 38% of total decentralized exchange trading activity, recording about $3.39 billion in volume.
This performance places Solana ahead of Ethereum (ETH), which handled approximately $1.65 billion, as well as other major networks like Base and BNB Chain (BNB).
One reason behind this rising activity is Solana’s improved network efficiency. Average transaction fees recently fell to around $0.0025, their lowest level in six months, representing a decline of more than 92% compared to the peak fee levels seen in January.
Lower costs, combined with faster processing speeds, have made Solana increasingly attractive to developers and users seeking reliable and scalable DeFi solutions.
Another important development is the expansion of 1inch (1INCH), a DEX aggregator, onto the Solana blockchain. As of Apr. 29, 1inch users can now access over one million Solana-based tokens through the platform’s decentralized application.
The integration also brings 1inch’s Fusion protocol to Solana for the first time, offering users customizable swap features and improved pricing through a competitive bidding system among market makers.
For developers, the move opens access to six new APIs via the 1inch Developer Portal, supporting further application building within the Solana ecosystem.
Wider data over the past three months shows that Solana has been steadily outperforming other major DeFi platforms. It recorded 33% higher DEX trading volume compared to Ethereum and leading layer-2 networks, processed nearly 400% more transactions, and supported 180% more active addresses, according to Dune Analytics.
Interest from institutional players is also gaining momentum. DeFi Development Corp., previously known as Janover, disclosed plans to expand its Solana holdings as part of a $1 billion securities offering filed with the United States Securities and Exchange Commission.
The company has already purchased about $48.2 million worth of SOL and intends to operate validators on the network to earn staking rewards.
Janover’s strategy reflects a criticla shift among corporations seeking to add digital assets like Solana to their balance sheets, following earlier models seen with Bitcoin acquisitions.
As of Apr. 29, Solana is trading around $148, showing a slight decline over the past 24 hours but still holding on to its weekly gains. From a technical perspective, indicators present a mixed but cautiously positive outlook.
The daily Relative Strength Index currently stands at 61.36, reflecting neutral momentum with room for further upward movement before entering overbought territory.
However, the presence of a bearish MACD crossover, with the MACD line at 2.73 and the signal line at 8.46, suggests some near-term selling pressure that traders should monitor closely.
Moving averages offer additional context. The 50-day simple moving average (SMA) is positioned at $131, indicating that the intermediate-term trend remains supportive of bullish sentiment. Meanwhile, the 200-day SMA currently stands at $181 levels.
The divergence between shorter- and longer-term averages points to underlying strength in the current rally but also highlights the need for sustained momentum to support longer-term growth.
On the four-hour chart, Solana has been forming a bullish flag pattern near the $145 level. A successful breakout above the immediate resistance at $150 could open the path toward the $160 area.
Weekly timeframes show additional signs of strength. A bullish engulfing pattern has emerged, often seen as a positive signal for continued buyer dominance.
In the immediate term, Solana may test the $160 level if resistance at $150 is cleared with convincing volume. Over the medium term, a range between $180 and $205 appears achievable if technical patterns continue to play out and market conditions stay favorable.
While Solana’s technical patterns suggest the potential for strong growth, short- and medium-term forecasts remain cautious.
One analysis from Ali Charts points to a large cup and handle formation spanning from mid-2022 to early 2024.
In technical terms, this pattern typically signals a period of deep correction followed by gradual recovery and consolidation, setting the stage for a potential breakout.
According to the analysis, the resistance zone for the cup formation is located between $195 and $200. If Solana breaks above this range, the classical projection method suggests a target near $392, based on the depth of the pattern.
Longer-term interpretations even suggest that prices could climb toward a range between $600 and $3,300, although such outcomes would depend on broader market dynamics.
In contrast, short-term forecasts are more restrained. CoinCodex projects that Solana could hover around $150.77 over the next five days. Over the next one to three months, the platform forecasts a mild decline toward $139.56 and $137.51 respectively.
Meanwhile, DigitalCoinPrice presents a more optimistic scenario. Their forecast for 2025 places Solana’s average price around $293.91, with a potential maximum reaching up to $325.80.
Over the longer term, their models suggest that Solana could continue to appreciate, with possible average prices near $521.54 by 2027 and $794.91 by 2030.
While technical structures and broader adoption trends present opportunities, it is important to approach projections with a measured perspective.
Investors and traders considering Solana should be aware that cryptocurrency markets are highly volatile and that predictions, even when backed by historical patterns or models, are not certainties. Trade wisely and never invest more than you can afford to lose.


 Price Prediction: Could it reach soon? Analysts Are Betting on Ruvi AI (RUVI) for 242x Returns During Altcoin Season")


