The main tag of cryptocurrency price today Articles.
You can use the search box below to find what you need.
[wd_asp id=1]
The main tag of cryptocurrency price today Articles.
You can use the search box below to find what you need.
[wd_asp id=1]
Key points:
Bitcoin price pushed above $95,000, increasing the chance of a rally to $100,000.
Institutional investor demand is back, suggesting that the bearish trend could be over.
Select altcoins could break above their respective overhead resistance levels if Bitcoin remains strong
Bitcoin (BTC) bulls are trying to sustain the price above $95,000, but they are likely to face significant resistance from the bears. Will buyers succeed in pushing the price toward the psychologically important level of $100,000, or is a pullback around the corner? That is the big question on the traders’ minds.
A positive sign is that inflows for US spot Bitcoin exchange-traded funds have increased since April 21, per Farside Investors data. Coinbase Institutional head of strategy John D’Agostino said in a recent interview with CNBC that several institutions purchased Bitcoin in April to hedge against currency inflation and macro uncertainty as Bitcoin mirrors “the characteristics of gold.
However, some analysts doubt the sustainability of the current Bitcoin rally. One of the red flags is that the sentiment, as measured by the Crypto Fear & Greed Index, slipped from a score of 72 out of 100 on April 23 to 60 on April 25, though Bitcoin is trading close to $95,000. Select analysts expect Bitcoin to pullback toward $87,000.
Could Bitcoin sustain above $95,000, triggering buying in altcoins? Let’s analyze the charts of the top 10 cryptocurrencies to find out.
Bitcoin has been trading near the $95,000 level, suggesting that the bulls are holding on to their positions as they anticipate a move higher.

The 20-day exponential moving average ($87,437) is sloping up, and the relative strength index (RSI) is near the overbought zone, signaling that the bulls are in command. A close above $95,000 could drive the BTC/USDT pair to $100,000.
Sellers will try to halt the up move at $100,000, but if the bulls do not allow the price to dip below $95,000, the prospects of a break above the overhead resistance increase. The pair may then climb to $107,000. The bears will have to yank the price below the moving averages to regain control.
Ether’s (ETH) relief rally is facing resistance at the 50-day SMA ($1,812), but a positive sign is that the bulls have not allowed the price to dip below the 20-day EMA ($1,696).

The 20-day EMA is flattish, but the RSI has jumped into the positive zone, signaling a slight advantage to the bulls. If the 50-day SMA is scaled, the ETH/USDT pair could reach the breakdown level of $2,111. The bears may pose a strong challenge at $2,111, but if the bulls overcome it, the pair could skyrocket to $2,550.
Sellers are likely to have other plans. They will try to pull the price below the 20-day EMA. If they can pull it off, the pair could tumble toward $1,537.
XRP (XRP) has been trading near the 50-day SMA ($2.18) for the past two days, indicating that the bears are fiercely defending the level.

A minor positive for the bulls is that they have not allowed the price to skid below the 20-day EMA ($2.13). The bulls will again try to propel the XRP/USDT pair to the resistance line, which is a critical level to watch out for. The pair could rally to $3 if buyers pierce the resistance line.
On the downside, a break and close below the 20-day EMA suggests that the bears remain in charge. The downside momentum could pick up on a break below $2. The pair may then plummet to $1.60.
BNB (BNB) turned down from $620 but is taking support at the moving averages. This suggests a change in sentiment from selling on rallies to buying on dips.

Buyers will try to push the price above $620. If they manage to do that, the BNB/USDT pair may rally to $644. Sellers will try to stall the up move at the $644 level, but if the bulls prevail, the pair could soar to $680.
This bullish view will be invalidated in the near term if the price turns down and breaks below the moving averages. That could sink the pair to $566, indicating that the markets have rejected the breakout above the downtrend line.
Solana (SOL) is struggling to stay above the $153 level, indicating that the bears are active at higher levels.

The upsloping 20-day EMA ($136) and the RSI in the positive zone indicate that the bulls are in control. If buyers push and maintain the price above $153, the SOL/USDT pair could jump to $180.
The moving averages are the crucial support on the downside. A break and close below the 50-day SMA ($129) suggests that the pair could consolidate between $153 and $110 for a few days.
Dogecoin (DOGE) bounced off the 20-day EMA ($0.16) on April 24, indicating that the bulls are buying on dips.

The DOGE/USDT pair could reach $0.21, which is a crucial resistance to watch out for. If buyers pierce the $0.21 level, the pair will complete a double-bottom pattern. This bullish setup has a target objective of $0.28.
Contrarily, if the price turns down and breaks below the moving averages, the pair may remain range-bound between $0.21 and $0.14 for a while. The advantage will tilt in favor of the bears on a break below the $0.14 support.
Cardano (ADA) closed above the 50-day SMA ($0.68) on April 23, signaling that the bears are losing their grip.

The 20-day EMA ($0.65) has started to turn up, and the RSI is in the positive zone, suggesting that the path of least resistance is to the upside. The ADA/USDT pair could rally to $0.83, where the bears may step in.
Any pullback is expected to find support at the 20-day EMA. If the price rebounds off the 20-day EMA, it signals a bullish sentiment. Sellers will have to drag the price below the 20-day EMA to sink the pair to $0.58.
Related: SUI’s 73% weekly price gains top crypto market — New price record in reach?
Sui (SUI) picked up momentum after buyers pushed the price above the moving averages on April 22.

The rally of the past few days has pushed the RSI into the overbought territory, suggesting a minor consolidation or correction in the next few days. Any pullback is expected to find support in the zone between the 38.2% Fibonacci retracement level of $3.14 and the 50% retracement of $2.94.
A shallow pullback increases the possibility of a rally to $4.25 and then to $5. Sellers will be back in the driver’s seat if they pull the SUI/USDT pair below $2.86.
Chainlink (LINK) has started a recovery, which is expected to face strong selling at the overhead resistance of $16.

If the price turns down from $16, it is expected to find support at the 20-day EMA ($13.53). A solid bounce off the 20-day EMA increases the likelihood of a break above $16. The LINK/USDT pair may then climb to the resistance line of the descending channel pattern. A break above the channel signals a potential trend change.
Sellers will have to tug the price below the moving averages to regain control. The pair may then drop to $11.89 and eventually to the support line.
Avalanche (AVAX) is facing resistance at the overhead resistance of $23.50, but a positive sign is that the bulls have not ceded much ground to the bears.

The 20-day EMA ($20.22) has started to turn up, and the RSI is in the positive territory, indicating that buyers have the edge. If the price breaks and closes above $23.50, the AVAX/USDT pair will complete a double-bottom pattern. That could open the doors for a rally to the pattern target of $31.73.
Alternatively, if the price turns down and breaks below the moving averages, the pair could remain stuck inside the $23.50 to $15.27 range for a few days.
This article does not contain investment advice or recommendations. Every investment and trading move involves risk, and readers should conduct their own research when making a decision.
XRP has recently captured the attention of investors following a bold prediction from Sistine Research, an AI-driven investment research firm. According to the platform, XRP could rise to a price range of $33 to $50 — a forecast they describe as “conservative.”
This projection comes amid XRP’s ongoing recovery, which has been partially driven by the upward trajectory of Bitcoin, which recently surged past the $93,000 level. While XRP’s pace has been more gradual, it has still shown a 5% gain in the past seven days and continued to climb modestly.
Sistine Research attributes the bullish outlook to technical patterns observed in the market. Notably, a breakout from a symmetrical triangle pattern dating back to November marked a pivotal moment, triggering renewed optimism among traders.
This movement was further intensified following Donald Trump’s election victory in late 2024, during which XRP spiked to a local high of $3.39 in January before undergoing a typical market correction.
The firm’s current expectations center on XRP surpassing its previous all-time highs, suggesting a significant rally that could push the asset into new price territory. Beyond Sistine’s forecast, other analysts have echoed similar sentiments.
Some suggest that XRP could reach $77 or even $100, driven by both technical strength and broader market momentum. Additionally, the recent announcement regarding XRP futures launching on the CME added some positive sentiment.
CME Group has revealed plans to launch regulated and capital-efficient XRP futures on May 19, featuring both standard and micro contracts to provide flexible trading options.
Source – ClayBro on YouTube
XRP is currently showing signs of bullish strength after holding its critical support zone around the $2.15 level. This area acted as both a fair value gap and a key support level, contributing to a brief recovery.
However, despite these bullish signals, momentum for a significant move higher remains uncertain. Spot volume has declined by around 10% over the past 24 hours, and while some early leverage has entered the market, it’s not yet enough to confidently fuel a breakout.
A short-term push toward $2.22–$2.23 seems likely, but for XRP to reach $2.25 or higher, stronger and more sustained leverage or fresh bullish news would be required.
If Bitcoin shows weakness, especially below the $92,700 level, $XRP could easily retrace toward the $2.05 range due to its correlation with the broader market.
Looking ahead, investors are setting their sights beyond XRP to diversify their portfolios, with Solaxy (SOLX) emerging as a promising opportunity after raising over $31.6 million during its presale.
Solaxy is positioning itself as a utility-driven project, with its core appeal centered around being the first-ever Layer 2 (L2) solution built on the Solana blockchain.
Unlike many other meme coins that simply ride the wave of hype, Solaxy introduces a significant layer of technical innovation by addressing Solana’s scalability through a future-proof, high-performance infrastructure.
Positioned as a next-generation chain, Solaxy promises infinite scalability, multi-chain compatibility, and near-zero downtime—three key features that could set it apart in an increasingly competitive crypto landscape.
The fundamental goal behind Solaxy is to unlock the full capabilities of the Solana ecosystem by enhancing its performance through L2 efficiencies. It aims to provide a seamless experience with fast transaction speeds, better scalability, and greater accessibility for new projects and developers.
The latest developer update confirms that the Solaxy TestNet Block Explorer is now live. In terms of data availability, testing indicates that with optimal configurations, Solana mainnet can sustain data throughput at 140KB/s, significantly improving storage speed and user experience.
Minor adjustments have also been made to the CLI interface. On the performance front, efforts are ongoing to boost rollup throughput, with a current goal of reaching 10,000 TPS.
Additionally, proper CORS support has been implemented in the SDK, and the team is actively resolving bugs where the rollup’s behavior deviates from the expected Solana L1 standards in user interfaces.
The key to Solaxy’s long-term success will lie in the team’s ability to maintain transparency, meet development milestones, and foster an active and supportive community.
According to available data, the project has been audited by the security firm Coinsult, adding another layer of trust for those concerned about legitimacy and smart contract vulnerabilities.
At present, their social channels appear lively and well-maintained, which suggests that the project team is actively working to deliver on its roadmap. For those looking to enter before a potential listing pump, now might be a strategic entry point.

The $SOLX token is currently priced at $0.001706 and is available for purchase through the Best Wallet app. Investors also have the option to stake their tokens at an annual percentage yield (APY) of 127%, with over 9 billion $SOLX tokens already staked.
There’s more development lined up for the Solaxy project. If successfully executed, it could become a foundational layer for future meme coins and decentralized applications (dApps) aiming to leverage Solana’s core infrastructure.
With market sentiment leaning bullish and technical indicators aligning in favor of XRP and emerging projects, the next phase for crypto could bring significant movement. To take part in the $SOLX token presale, visit solaxy.io.
This article has been provided by one of our commercial partners and does not reflect Cryptonomist’s opinion. Please be aware our commercial partners may use affiliate programs to generate revenues through the links on this article.
The price of Dogecoin could rise to $10 within the next few years if DOGE experiences a steady growth of 5% monthly.
The latest crypto market downturn has dealt a heavy blow to Dogecoin, causing its price to plunge by 6.13% over the past day. This saw the price of DOGE crash from the $0.18 mark to $0.1702. Despite the latest bloodbath, DOGE is still up 9.3% in the past seven days.
Notably, market watchers are still optimistic about Dogecoin’s prospects. Some expect it to soar to an ambitious target of $10. Hitting the $10 target requires a surge of 5,775% from the current price. Several experts, including Ali Martinez, believe Dogecoin can achieve the $10 milestone.
As this projection gains momentum, we estimated how long it would take Dogecoin to reach the $10 target if it records a monthly gain of 5%. We can estimate a 5% gain on DOGE by multiplying the current price of $0.1702 by 1.05%. Accordingly, if DOGE’s price grows by 5% in May 2025, it will trade at $0.17871 by the end of the month.
Another 5% growth in the following month would push the price to $0.18764 by June. Notably, Dogecoin would finally cross the $0.2 mark by August 2025.
If this continues and DOGE records a minimum increase of 5%, its price would clinch the $10 target within the next 84 months or seven years. This implies that the price of DOGE would hit $10 by April 2032, so long as the firstborn meme coin records a monthly increase of 5%.

At the $10 target, a portfolio of 5,000 DOGE, valued at $851 at the current price, would be worth $50,000, representing an ROI of over $49,000.
Notably, Dogecoin’s market cap would soar to approximately $1.49 trillion from the current value of $25.35 billion. This analysis assumes that Dogecoin’s circulating supply remains at the same level of 148.98 billion tokens.
Moreover, there is no guarantee that Dogecoin could see or sustain a monthly 5% through the seven-year period.
Meanwhile, The Crypto Basic consulted other crypto prediction platforms like Changelly and Telegaon to assess their Dogecoin predictions for April 2032.
Analysts affiliated with Changelly’s trading platform suggest that Dogecoin will trade at a maximum target of $2.02 by April 2032. This represents an increase of 1,086% from the current price of $0.1702. As for the $10 price, the analysts do not see DOGE at that level in the foreseeable future.
However, Telegaon indicates that Dogecoin would trade between $18 and $28 within the projected timeline of 2032. It noted DOGE could reach $10 much earlier in 2029.
Notably, these timelines remain speculative.
DisClamier: This content is informational and should not be considered financial advice. The views expressed in this article may include the author’s personal opinions and do not reflect The Crypto Basic opinion. Readers are encouraged to do thorough research before making any investment decisions. The Crypto Basic is not responsible for any financial losses.
The crypto market is abuzz with fresh optimism as Ripple’s XRP inches closer to institutional recognition, following news that the CME Group—the world’s largest derivatives exchange—is preparing to launch XRP futures.
Slated for a May 19 debut, the move could significantly reshape the Ripple market and bolster long-term XRP value projections.
CME Group confirmed plans to roll out cash-settled XRP futures, pending regulatory approval. This development positions XRP alongside other major digital assets like Bitcoin, Ethereum, and Solana already featured in CME’s crypto derivatives portfolio. The contracts will be offered in two sizes: 2,500 XRP and 50,000 XRP, both settled against the CME CF XRP-Dollar Reference Rate, calculated at 4 PM London time.
CME Group announced it will launch regulated, capital-efficient XRP futures on May 19, offering both large and micro contract options for flexible exposure. Source: CME Group via X
Giovanni Vicioso, Global Head of Cryptocurrency Products at CME Group, emphasized the rationale behind the product launch. “Interest in XRP and its underlying ledger (XRPL) has steadily increased as institutional and retail adoption for the network grows,” he said. “We are pleased to launch these new futures contracts to provide a capital-efficient toolset to support clients’ investment and hedging strategies.”
Ripple CEO Brad Garlinghouse welcomed the news as “an incredibly important and exciting step” towards the future development of the XRP market. The listing of XRP futures would, for the first time, allow institutions to access regulated exposure to the Ripple-linked asset, a milestone in Ripple XRP news.

Ripple CEO Brad Garlinghouse called the upcoming XRP futures launch a long-overdue but significant and exciting milestone for the XRP market’s growth. Source: Brad Garlinghouse via X
The timing also comes in sync with a shifting regulatory climate in the U.S., with the Trump administration showing a more open mind towards digital assets. This may end up accelerating the settlement of the ongoing XRP case between Ripple and the U.S. Securities and Exchange Commission (SEC). A favorable court judgment on the Ripple case will also boost investor sentiment and institutional participation.
XRP price has been trading at $2.18, revealing consolidation following mid-week highs at $2.30. As much as there was a little pullback at $2.11, there is still bullish momentum. Technical analysts are carefully watching for a potential 25% breakout to $2.74, driven by a bullish inverse head and shoulders pattern on the 8-hour chart.
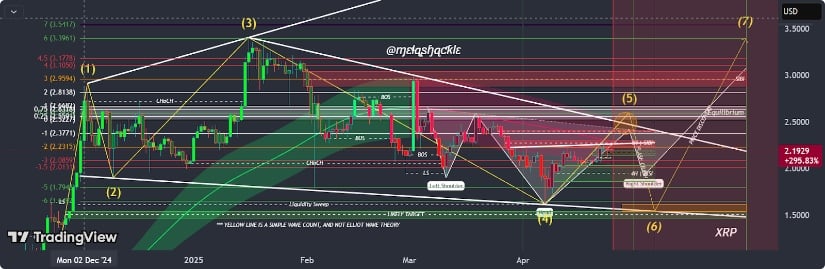
XRP’s ongoing price suppression, seen by some as deliberate manipulation, is viewed as a sign of its immense long-term potential. Source: MetaShackle on TradingView
For the rally to occur, XRP must bounce back from its resistance at $2.22, which is also its short-term 200-day Exponential Moving Average (EMA). If this is violated, the token can test intermediate resistance at $2.50 before attempting again to reach the target of $2.74.
However, technicals are a motley crew. The Relative Strength Index (RSI) has fallen to 55.98, just below the neutral 50 line, which could indicate declining bullish momentum. A breakdown below it can prompt XRP price to test support at approximately $2.00.
Coinglass Open Interest information shows a 0.21% decline in the last 24 hours at $3.86 billion. This suggests a lack of strong conviction among traders amid the current consolidation. Long liquidations have outpaced short positions—$5.63 million versus $1.99 million—indicating that bullish sentiment faces mounting pressure.
The CME announcement is the latest in a series of steps expanding Ripple’s institutional footprint. In recent weeks, XRP trading volume on U.S. exchanges has steadily risen, and multiple asset managers—including Bitwise, Franklin Templeton, and 21Shares—have filed for XRP-based ETFs.
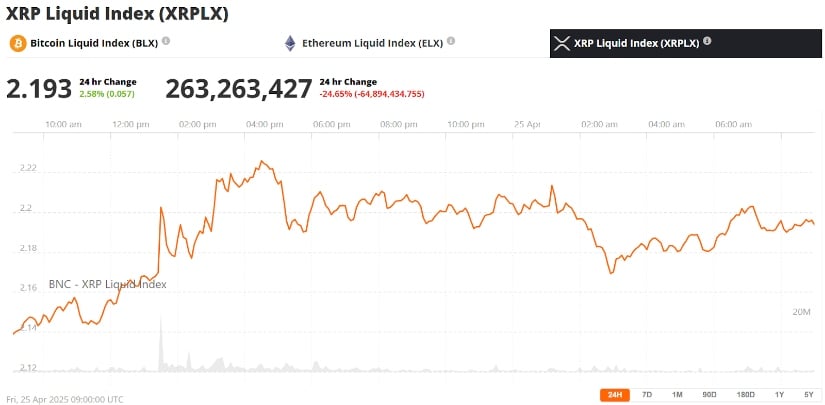
Ripple (XRP) was trading at around $2.19, up 2.58% in the last 24 hours at press time. Source: XRP Liquid Index (XRPLX) via Brave New Coin
If Ripple can overcome its scalability challenges and successfully resolve its legal battle with the SEC, analysts believe XRP could eventually replace traditional systems like SWIFT for global payments. This would significantly increase XRP value over time and cement its position as a cornerstone of cross-border finance.
With CME’s XRP futures on the horizon and institutional interest surging, Ripple XRP news is turning decidedly bullish. While the outcome of the XRP SEC lawsuit remains a wildcard, the market is beginning to price in optimism.
As Brad Garlinghouse noted, this moment is not just overdue—it’s a milestone. Whether XRP price follows through with the anticipated breakout or retraces under pressure, one thing is clear: the Ripple exchange ecosystem is entering a new era.
The cryptocurrency industry shows trending changes after Solana (SOL) demonstrated price instability and Ripple (XRP) and Rexas Finance (RXS) received rising levels of interest. Recent weeks have brought downward movement in prices for Solana which operates as one of the fastest blockchain networks currently active. XRP maintains its operation through regulatory uncertainties while RXS establishes itself as a new competitor by implementing a real-world asset (RWA) tokenization model.
Solana Faces Market Volatility
Solana has seen price drops over the past week, with its value decreasing by approximately 3.66%.. Solana exceeded $150 in price but quickly retreated to trade at around $138 at present. The price correction of Solana results from profit-taking behavior according to market analysts and the present market patterns. Despite its recent decline, Solana maintains a strong position in the crypto market with a market capitalization of around $70.62 billion. Others in the Layer-1 blockchain sphere currently present increasing competition to Solana’s role as a platform for dApps and NFTs and decentralized application development. Parents are observing indicators of market recovery but other investors move their capital toward new projects which demonstrate robust principles.
Ripple’s Price Movements Amid Regulatory Developments
XRP token from Ripple has maintained its position as one of the most observed cryptocurrencies after it faced legal challenges from the United States Securities and Exchange Commission (SEC). XRP reached its highest point at $2.80 during February 2025 and then reversed back to the present trading level at $2.33. Experts track XRP resistance points to confirm if it will surpass $2.20 support levels for continued upward price activity.
https://x.com/DefendDark/status/1906288198877155620
Ripple’s market capitalization stands at approximately $135.26 billion, keeping it among the top digital assets. Some investors remain optimistic about its long-term potential, especially if regulatory clarity improves. However, ongoing legal proceedings continue to create uncertainty about XRP’s future price trajectory.
Rexas Finance Gains Momentum as an Emerging Competitor
Rexas Finance (RXS) established itself in the market to create digital versions of real-world assets including real estate, commodities as well as intellectual property. Through this model users gain access to trading fractionalized high-value assets stored on the blockchain. The pre-sale effort of the project managed to capture investor interest by raising $47 million which represents 91.28% of the total token supply being sold.
https://x.com/rexasfinance/status/1903514983000113618
RXS started at $0.03 and has increased to $0.20 in its final presale stage. It is set to launch on June 19, 2025, at a listing price of $0.25. Analysts suggest that the token’s real-world use case could drive demand, setting it apart from speculative cryptocurrencies. A CertiK audit ensures investors obtain complete transparency along with secure conditions in the project.
Price Predictions for 2025-2030
Capital market analysts predict that Solana and Ripple and Rexas Finance prices will change differently between 2023 and 2025. Network adoption developments of Solana lead experts to believe it might recover its value to achieve increased levels. The expansion of Solana might be affected by other active blockchain platforms operating in the market. Ripple’s price performance depends on both regulatory decisions and institutional business integrations. The abolition of legal uncertainties about XRP could allow the token to exceed former market value peaks according to predicted scenarios. The course of events related to its SEC case potentially threatens to diminish investor confidence in the company. Rexas Finance, as a new entrant, has attracted interest due to its unique approach to blockchain-based asset ownership. Analysts believe that RXS could experience strong growth, particularly as more investors seek exposure to tokenized real-world assets.
Dogecoin breaks out of a falling wedge pattern, signaling the potential for a bullish trend reversal, according to a prominent market watcher.
Dogecoin (DOGE) has shown significant upward momentum over the past week, rising from around $0.16 to slightly over $0.18 between April 19 and April 25, 2025. This 7-day performance reflects a solid 17.2% increase, with a 24-hour figure of +6.1%. The recent price surge is accompanied by a breakout from a falling wedge pattern, signaling a potential for further gains.
The breakout from the falling wedge pattern is a notable technical development, often seen as a bullish reversal signal. According to an analyst on TradingView, the pattern had previously held DOGE within a downtrend, testing resistance at $0.28 in February and again at $0.16 in April.
Notably, the recent breakout, which occurred near the $0.18 mark, comes with rising volume and reclaiming previous support levels. These indicators suggest a potential trend reversal and a continuation of the upward movement.
The falling wedge pattern typically signals a shift from a bearish to a bullish trend, and DOGE’s breakout aligns with this. With strong support at the $0.143 and $0.16 levels, the analyst is targeting a price of approximately $0.46, representing a 170.59% rise from the current value.

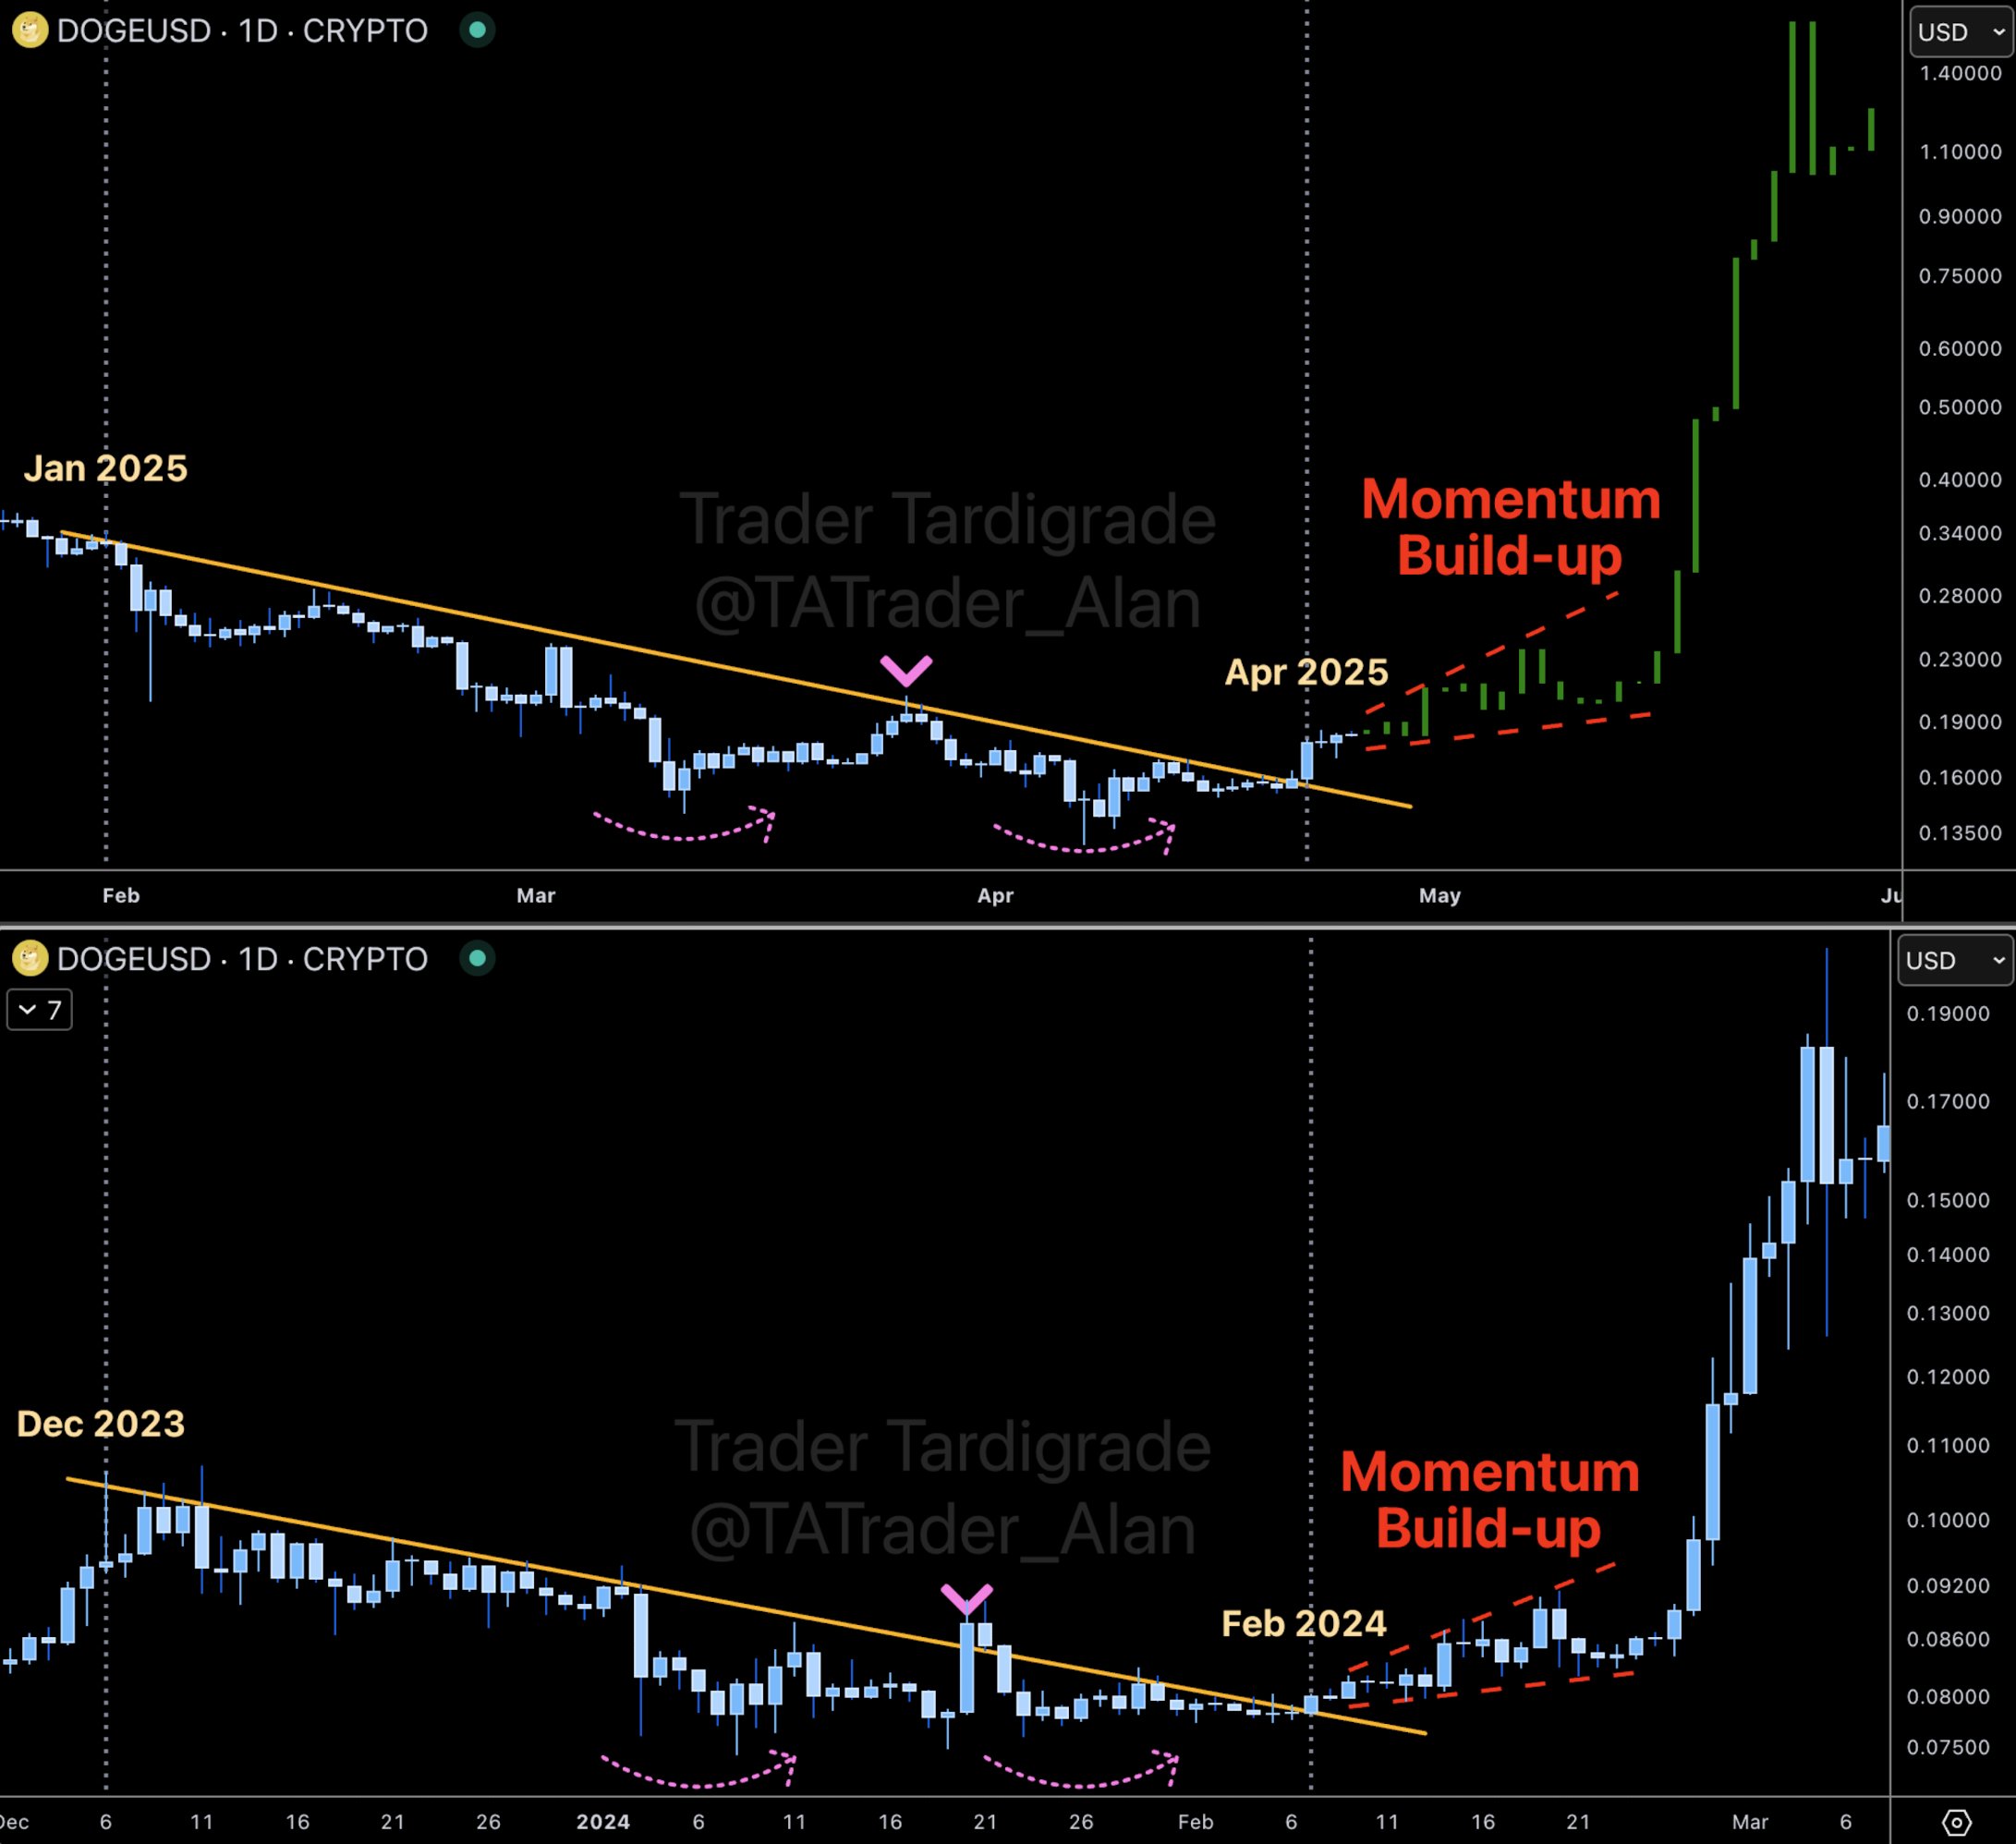
Furthermore, other market analysts have noted the potential for a bigger spike in Dogecoin’s price. Trader Tardigrade, an analyst on X, also confirmed that DOGE has broken through a significant mid-term resistance trendline.
According to Tardigrade, the breakout is not a false one, and the price movements resemble those seen in February 2024, which preceded a massive price rally. If the current momentum continues, Tardigrade suggests a significant surge could push DOGE past the $1 mark by May 2025. This prediction builds on the earlier price action of DOGE, which has already begun to show strength.
The bullish outlook for Dogecoin is also supported by a surge in DOGE Futures Open Interest, as observed by data from Coinglass. Open interest refers to the amount of capital locked in DOGE futures contracts, which has risen by 8.58% to $2.01 billion, a level last seen in late March 2025.
This increase reflects the growing confidence in the asset, with more capital being invested in DOGE futures as traders take long positions in anticipation of future price increases.

DisClamier: This content is informational and should not be considered financial advice. The views expressed in this article may include the author’s personal opinions and do not reflect The Crypto Basic opinion. Readers are encouraged to do thorough research before making any investment decisions. The Crypto Basic is not responsible for any financial losses.
ADA breaks months-long downtrend as volume surges past $1B, fueling a bullish Cardano price prediction toward $0.90.
Cardano is back in focus as momentum starts to build again. With technical breakouts and positive on-chain developments, ADA is gaining attention across the board. The Cardano price prediction is starting to lean bullish after months of silence.
Cardano (ADA) is trading at around $0.68, up 9.57% in the last 24 hours. Source: Brave New Coin
Cardano is starting to turn heads again. In the last 24 hours, ADA trading volume crossed $1 billion, marking a strong 46% rise. That kind of jump in activity shows more traders and investors are getting involved, and that usually means a move could be on the way. Volume spikes like this often happen when momentum is building, especially after a long period of weak price movement.

Cardano’s ADA trading volume surges by 46%, reaching over $1 billion, signaling growing investor interest. Source: TapTools via X.
With ADA trading just under $0.70, this boost in volume gives a reason to stay watchful. TapTools highlighted this surge, pointing out how rare such daily spikes are. As the market cap now sits above $24 billion, Cardano’s growing activity might set the stage for steady upside in the short term.
After nearly five months of grinding lower, Cardano has finally broken out. Shared by analyst Crypto Chino, the chart highlights a clean breakout from a long-standing resistance line that’s capped every rally attempt since late 2024. It’s the kind of move that doesn’t guarantee a bull run, but it does put ADA back on the radar.
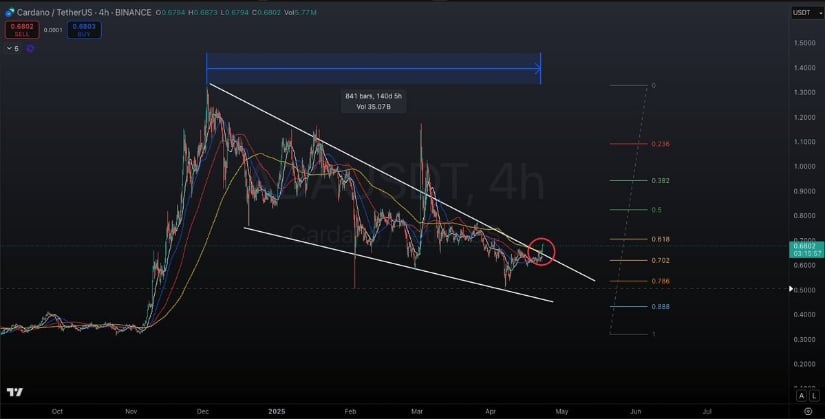
Cardano breaks free from a 140-day downtrend, signaling potential for a new bullish phase. Source: Crypto Chino via X.
What makes this breakout interesting is the timing. Altcoins are starting to stir again, and Cardano stepping out of a prolonged downtrend could signal it’s ready to join the rotation. Volume is starting to build, and if this momentum holds, ADA might finally be carving out a new narrative. For a token that’s been mostly quiet lately, this is the loudest it’s looked in a while.
While Cardano recovers after breaking out of a 140-day downtrend, it’s doing so with surprisingly low short-term bubble risk, according to fresh data from Into The Cryptoverse. The indicator currently sits below the more critical thresholds, suggesting ADA’s momentum hasn’t entered overheated territory just yet. That’s a positive sign for those hoping the breakout has room to run.
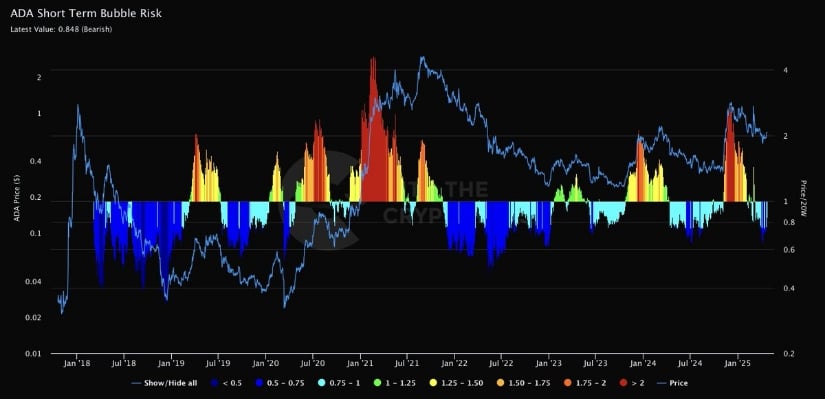
Cardano is at low bubble risk despite a strong breakout. Source: Into The Cryptoverse via X.
In past cycles, ADA tends to show higher bubble risk just before local tops, but we’re not seeing that here. This setup could give bulls some breathing room as ADA attempts to reclaim key resistance levels. With price action improving and risk levels staying modest, the current trend looks healthier than many expected.
Cardano just made a serious move that’s turning heads across the charts. After weeks of grinding through resistance, ADA has finally closed above the 12-hour trendline, a structure that’s kept bulls in check since March. This breakout isn’t a fake; it’s a solid technical shift that could now open the gates toward higher levels next. And with momentum building, that zone is looking more like a stepping stone than a ceiling for the ADA Cardano price.
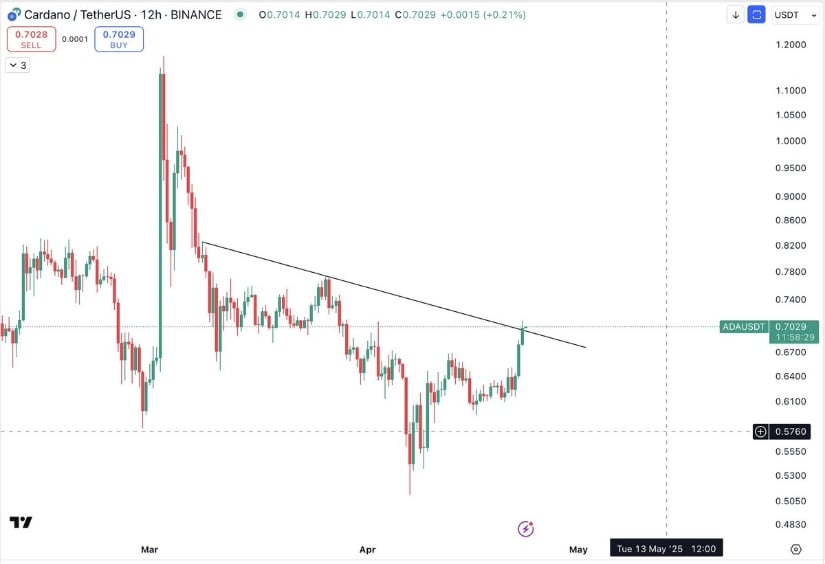
Cardano’s breakout signals a potential rally, with the next targets at $0.78-$0.80. Source: The Cryptomist via X.
According to crypto analyst The Cryptomist, this breakout marks a major confirmation point. She highlights that a clean 12-hour close above this trendline strengthens the setup for further upside. If ADA maintains this level, she believes the next immediate targets sit between $0.78 and $0.80, signaling a continuation of the rally. It’s a pivotal moment as buyers are finally starting to take the steering wheel.
Cardano’s environment is starting to change, and now the charts are starting to reflect it. As the broader market shows signs of recovery, ADA seems to be leading the charge with a cleaner structure and increasing momentum. According to the latest Elliott Wave reading by analyst Mr. Brownstone, Cardano appears to be in the early stages of a five-wave impulsive move, aiming for the $0.90 range in the short term. The structure suggests we’re past wave II and currently working on wave III.
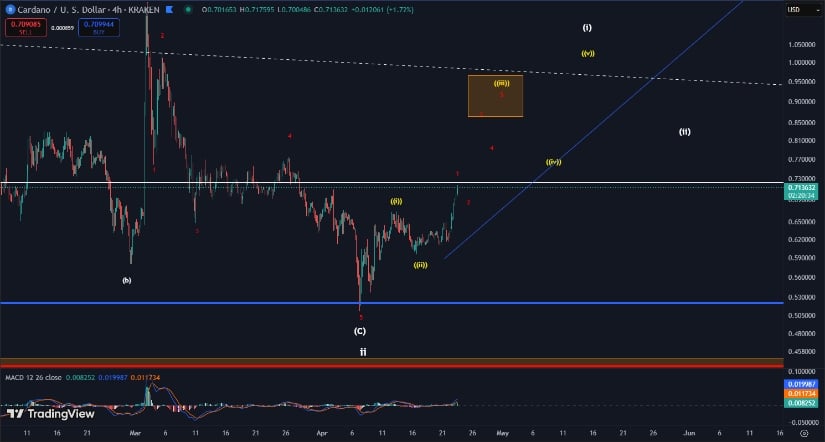
Cardano’s bullish setup targets $0.90, with key breakout levels at $0.73-$0.75. Source: Mr. Brownstone via X.
The key breakout level to watch remains the $0.73-$0.75 zone, and holding above the ascending trendline may confirm further upside. Additionally, the indicators and on-chains are aligning, which adds more weight to the current Cardano price prediction, especially after a long consolidation.
As ADA Cardano price reclaims technical levels and moves past a major 140-day downtrend, all eyes are now on whether it can sustain this momentum. The current market structure shows ADA has shifted into a more constructive phase, breaking out of consolidation and forming higher lows. Technically, if Cardano can hold above the $0.70–$0.73 support zone, the next few sessions could bring retests of $0.78 and possibly $0.80. This zone previously acted as resistance, so flipping it into support would be a strong signal for trend continuation.
Bitcoin, Ethereum, and XRP have had a great week, with Bitcoin at $93,718.70, Ethereum at $1,781.20, and XRP at $2.20 as of April 25, 2025. They’ve seen strong gains, but the rally might be cooling off, and we could see prices dip soon. Let’s break it down.
Bitcoin has seen a nice rally this week, up about 9.5%. The price hit $95,000 briefly, but now it’s hanging around $93,718.70. This price is right near a big resistance point at $95,000, which means it’s struggling to push higher. The market cap is $1.86 trillion, with a 24-hour trading volume of $32.81 billion.
If Bitcoin doesn’t manage to push past that $95,000 level soon, we might see a small pullback. If that happens, the next major support level to look out for is $90,000. That’s a key psychological level that could help Bitcoin bounce back if it drops. But if Bitcoin does break past $95,000, it could go all the way to $97,000, which would be a strong rally.
Ethereum has had a strong week too, with a 10% gain. It rose to $1,834 but couldn’t quite break through the $1,861 resistance. Right now, Ethereum is at $1,781.20. The market cap for Ethereum is $214.66 billion, and it has a daily trading volume of $15.19 billion.
The thing with Ethereum is that its momentum seems to be slowing down. The RSI (Relative Strength Index), which measures buying pressure, is at 52, just hovering near neutral.
If Ethereum fails to stay above $1,700, we could see it dip back down to $1,449. However, if it manages to hold above $1,700 and push past $1,861, it could go higher.
XRP has had a quiet but steady performance, currently trading at $2.20. It couldn’t break above $2.23, which is its key resistance level right now. XRP’s market cap is $128.46 billion, with a 24-hour trading volume of $4.14 billion.
XRP’s momentum looks similar to Ethereum’s, with the RSI sitting at 52. That suggests the buying pressure is fading a bit. If XRP can’t push above $2.23, it might start to fall back and test the next support level at $1.96. On the flip side, if it breaks through $2.23, we could see it reach $2.50, or even $3.00.
All three of these coins—Bitcoin, Ethereum, and XRP—are showing signs of slowing down after solid gains this week. Bitcoin is sitting near a critical resistance level at $95,000.
Ethereum is hitting a wall at $1,861, and XRP can’t seem to get past $2.23. If either one breaks through these points, we could see more upward movement. But if they don’t, a pullback might be on the cards.
Right now, it’s all about keeping an eye on those key levels. If Bitcoin stays above $90,000, Ethereum holds strong above $1,700, and XRP manages to break that $2.23 resistance, we could see more upside. On the flip side, if any of them dip below these levels, a correction could be coming.
Also Read: Bitcoin Price Retests $94,000! BTC To Hit $100k This Week?
Solana is back in focus after a 15% price surge, breaking past resistance at $145 after a $500M institutional investment from Sol Strategies and renewed on-chain momentum.
The Layer 1 giant has climbed nearly 15% in the past two trading sessions, sparking fresh interest across both retail and institutional circles. With technicals firming up and momentum shifting, some are beginning to wonder if a larger breakout could be forming.
Solana just got a major vote of confidence. Sol Strategies has announced a $500 million convertible note to buy into SOL. This isn’t a minor headline; it’s a clear signal of conviction in Solana’s long-term potential. As institutions start treating Solana like a core asset rather than a speculative play, this kind of move helps shift the narrative from hype to serious capital deployment.
Sol Strategies’ $500M bet on Solana signals growing institutional confidence. Source: MisterCrypto via X
MisterCrypto highlights that Sol Strategies is now the MicroStrategy of Solana. The parallels are hard to ignore. Much like how MicroStrategy reshaped institutional sentiment around Bitcoin, Sol Strategies might be doing the same for Solana.
After Sol Strategies’ bold move on Solana, the technical charts also started to reflect that optimism. Scott Melker, a famous analyst, points out that Solana price has printed its first higher high since the downtrend began in January. More importantly, the falling resistance line that capped price action for months has now been decisively broken.

Solana’s price breaks its downtrend as Scott Melker highlights the shift to higher highs. Source: Scott Melker via X.
According to Scott Melker, this move stands out not just because Solana printed a higher high, but because it did so with increasing volume. The previous level at $112 acted as a firm base, and now, with the breakout above $145, the market has shifted from lower lows to higher highs. As long as SOL Solana price holds above this reclaimed level, the structure favors continuation to the upside with $180 potentially back in play.
While price action and institutional interest are heating up for Solana, the on-chain activity is starting to uptick as well. Crypto analyst Jesse Peralta points out, Solana is holding its ground in the staking race with a massive $57.9 billion in staking market cap. That places it right behind Ethereum, but well ahead of most of its competitors. For a network that continues to be in the headlines for both price and progress, this staking strength adds a key layer of confidence for long-term holders.
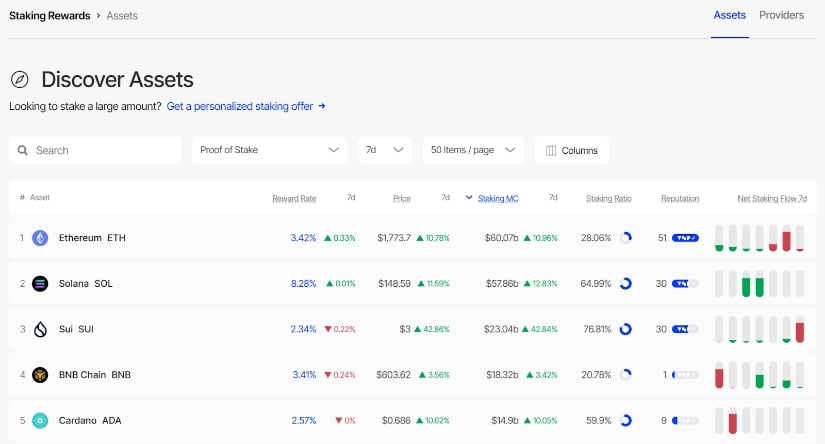
Solana’s $57.9B staking strength boosts long-term outlook. Source: Jesse Peralta via X
Building on the recent breakout confirmed by Scott Melker and the $500M conviction play by Sol Strategies, Solana’s high staking market cap reflects more than just speculation. A large segment moving into token locks is reducing the circulating supply and shows confidence in the network’s future. Solana is heading in the right direction with its long-term plays.
Following a breakout and strong institutional backing, Solana’s technical setup is starting to catch attention. Trader Koala outlines a strong bullish momentum on charts, with $130 and $140 as the first area of interest, with room for more towards $180, and a higher target all the way up at $320. The structure shows higher lows holding firm, and momentum building above key moving averages.
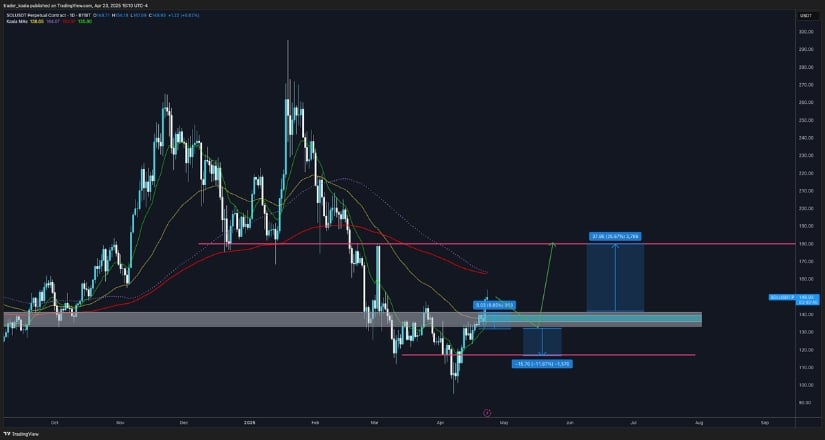
Solana’s bullish breakout shows strong momentum, with a $320 target in sight. Source: Koala via X.
This fits neatly into the broader narrative building around Solana. From Sol Strategies’ $500M investment to the breakout confirmed by Scott Melker, Solana is stacking up signals of strength. The current Solana price prediction reflects that shift in sentiment, with upside targets suggesting a potential move of 30% from recent levels.
While recent sentiment around Solana has been largely bullish, not every analyst is calling for a straight shot upward. Crypto analyst Kevin offers a more cautious view, highlighting the possibility of a short-term market pullback before any major rally unfolds. His chart points to a liquidity zone just below the $130 mark, where the price could briefly dip before regaining strength.
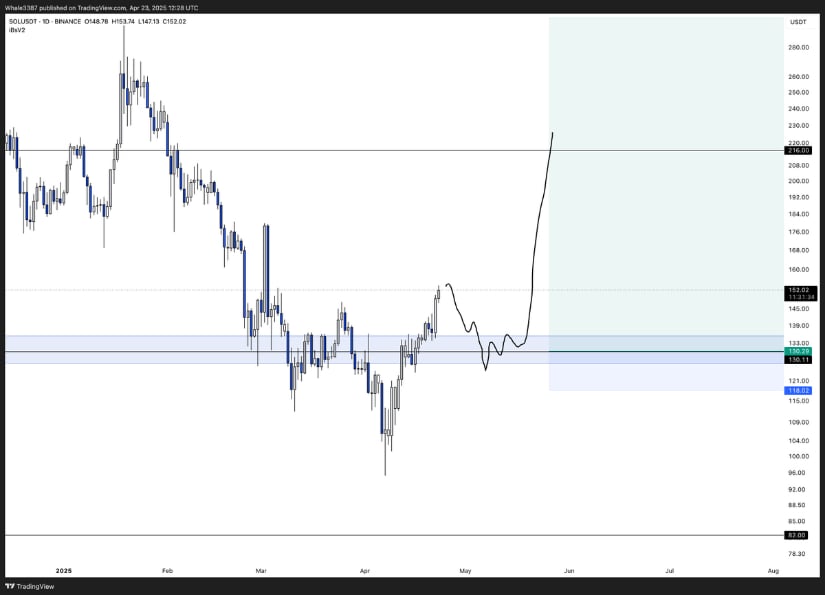
Kevin warns of a short-term pullback for Solana, before a bullish run towards $230 in the longer term. Source: Kevin via X
The longer-term outlook, however, remains constructive. After the potential retracement, Kevin expects Solana to rebuild momentum toward the $200 region, with a possible move as high as $230. This projection aligns with the broader views of analysts like Koala and Scott Melker. Solana’s price prediction might show short-term divergence, but the longer-term uptrend still appears to be intact.
SOL Solana price is starting to find its footing again. This time, not just through price action, but through a broader shift in sentiment. The major bet from Sol Strategies, the break in long-standing downtrend, and the strength in staking are all pointing to growing confidence in Solana’s long-term place in the market.
That said, while analysts like Koala and Scott Melker highlight strong upside potential, others like Kevin have shown the possibility for short-term pullbacks along the way. Solana price now seems to be entering a phase where dips are becoming opportunities rather than warning signs.
A widely followed cryptocurrency trader predicted Thursday that Dogecoin’s DOGE/USD bullish momentum will sustain, forecasting a potential breakout above $0.1850.
What Happened: BitGuru, known for analyzing price patterns of cryptocurrencies, noted that the popular meme coin was stabilizing above a key support level after completing a “classic” cup-shaped recovery.
The cup-shaped recovery is a bullish continuation pattern in which the price recovers gradually after a downtrend, with the trajectory resembling a cup.
“If the price holds this level, we’re likely heading toward a fresh breakout above $0.1850 in the next leg up,” BitGuru said.
The bullish projection was echoed by well-known chartist Trader Tartigrade, who spotted a bull flag, another pattern that signals a continuation of an upward trend.
“The breakout of the flag could send DOGE to $0.22,” Trader Tartigrade stated
On the contrary, the Commodity Channel Index, which measures the difference between the current price and the historical average price, indicated that DOGE was overbought and flashed a “Sell” signal, according to TradingView.
These forecasts coincided with a 17% spike in DOGE’s price over the week, following Bitcoin’s BTC/USD re-entry into the $90,000 region. The world’s largest meme coin was one of the highest mega-cap gainers during this period.
Price Action: At the time of writing, DOGE was exchanging hands at $0.1811, up 5.05% in the last 24 hours, according to data from Benzinga Pro. Year-to-date, the meme coin has plunged 42%.
Photo Courtesy: alfernec on Shutterstock.com
Read Next:
Market News and Data brought to you by Benzinga APIs
© 2025 Benzinga.com. Benzinga does not provide investment advice. All rights reserved.
 and Ripple (XRP) Outperform SOL?")

