The main tag of cryptocurrency price today Articles.
You can use the search box below to find what you need.
[wd_asp id=1]
The main tag of cryptocurrency price today Articles.
You can use the search box below to find what you need.
[wd_asp id=1]
Dogecoin (DOGE) has once again captured the spotlight in the crypto market, rallying 13% over the past 24 hours and climbing above a key resistance at $0.1808.
This latest price surge aligns with broader gains across the meme coin sector and has reignited bullish sentiment surrounding the original meme coin. As DOGE now tests higher resistance levels, analysts are eyeing an ambitious target of $0.27 in the weeks ahead.
Much of Dogecoin’s historical volatility has been tied to Elon Musk, who recently announced a plan to scale back his involvement with the Department of Government Efficiency (DOGE)—a fictional department humorously aligned with the coin’s acronym. Musk cited a need to focus more on Tesla following a significant decline in the company’s profits, stating that his DOGE-related activities will “drop significantly” starting in May.
Dogecoin (DOGE) was trading at around $0.18, up 12.33% in the last 24 hours at press time. Source: Brave New Coin
Despite concerns over Musk’s reduced presence, the Dogecoin network has demonstrated resilience. Market observers noted that the meme coin’s value spiked shortly after the announcement, hinting that DOGE may be growing beyond its Musk dependency.
DOGE’s rapid rally has also triggered a wave of liquidations in the futures market. According to data from Coinglass, over $11.6 million in short positions were wiped out as bullish momentum gained traction. Nearly 85% of these losses came from traders betting against DOGE’s rise.
This flush of short-sellers adds further support to the notion that the downtrend may have reached its exhaustion point. However, technical indicators also show early signs of overheating. The Relative Strength Index (RSI) has climbed above the neutral 50 mark, and the Stochastic Oscillator is currently in overbought territory, suggesting the possibility of a short-term correction before continuation.
From a technical standpoint, Dogecoin’s price action shows clear signs of a bullish reversal. DOGE recently broke above a key descending trendline resistance, as well as the 50-day simple moving average (SMA). These breakouts suggest a strengthening of the upward trend, reinforced by the formation of a falling wedge—commonly regarded as a bullish continuation pattern.
 Price Prediction: DOGE Surges 13% Amid Meme Coin Rally, Eyes alt=")
DOGE is consolidating in a descending triangle with fading volume, needing a breakout above the 200 EMA near $0.1822 to target the $0.20 level. Source: Paper_Trader1775 on TradingView
“Dogecoin is showing textbook breakout behavior,” said one analyst from CryptoQuant. “The breakout above the 50-day SMA is especially encouraging, and if the coin clears the $0.1809 mark decisively, we could see it push toward $0.21 and beyond.”
DOGE’s next key hurdles lie near $0.2106 and the 100-day SMA. Clearing those would further validate bullish DOGE price predictions, potentially unlocking a path toward the ambitious $0.27 level.
Dogecoin’s surge is part of a larger meme coin rally led by assets like Shiba Inu (SHIB), PEPE, and BONK, all of which have posted double-digit gains this week. The broader cryptocurrency market has also shown strength, with Bitcoin climbing to a two-month high of $94,500 and Ethereum reclaiming the $1,700 level.
Analysts say the renewed interest in risk-on assets is being driven by improving macro sentiment, rising investor confidence, and technical breakouts across several top assets.
Veteran crypto analyst “Master Ananda” believes DOGE may be nearing the end of a prolonged corrective phase that began in late 2024. The price structure appears to have completed a complex ABC correction, typically followed by an impulse wave—a strong upward move in Elliott Wave Theory.
DOGE could retest the $0.27 resistance following the current bullish momentum. Source: Sabri2003 on TradingView
“Dogecoin has found strong support near its 2024 consolidation zone,” said Ananda. “With the correction ending on April 7, DOGE is now positioned for a new impulse wave that could carry it to $0.27 and potentially even higher.”
According to the analyst, the next major move could even trigger a 333% rally, bringing Dogecoin value above $0.40 and toward the $0.70 mark seen during the meme coin’s previous all-time highs.
While Dogecoin investors must remain cautious of short-term volatility and potential corrections, the overall trajectory appears bullish. With technical indicators favoring upward momentum and the broader meme coin market gaining strength, DOGE may be poised for a significant breakout.
Still, all eyes remain on critical resistance levels and trading volume. If Dogecoin can overcome the next challenges, it could mark the beginning of a powerful new chapter in the coin’s ever-colorful journey.
Key Takeaways:
XRP has gained 25% since April 7, and its open interest has risen by 32%.
Positive spot market activity contrasts with a neutral futures funding rate, highlighting a tug-of-war between traders.
Analysts still have double-digit price targets for XRP.
XRP’s (XRP) price fell to a year-to-date low of $1.61 on April 7, but has gained 25% over the past two weeks as the broader crypto market recovered and XRP open interest surged.
The altcoin’s open interest surged 32% from $3.14 billion to $4.13 billion between April 21 and 23, signaling the return of derivatives traders. Futures OI increasing alongside the price indicates a bullish sentiment, but data from the Velo painted a different picture.
Based on the negative aggregated premium on open interest, the XRP futures market continued to bid against an XRP price rise. The funding rate remained near 0, implying a neutral stance between the bulls and bears.

The aggregated spot tape cumulative volume delta became positive in April. This indicator measures the net difference between aggressive buy and sell trades across various exchanges. When it turns green and rises above zero, it indicates increasing buying pressure, with market buy trades surpassing sell trades.
Despite rising futures interest, the data suggests XRP’s price remains caught in a tug-of-war between bullish spot market activity and bearish perpetual futures.
Related: Price predictions 4/23: BTC, ETH, XRP, BNB, SOL, DOGE, ADA, LINK, AVAX, SUI
Is XRP destined for double-digits?
Following XRP’s price pump, Sistine Research, a crypto investment community, posted a bold prediction for XRP, forecasting a long-term target between $33 and $50. The prediction is based on a higher time frame (HTF) symmetrical triangle that mirrors 2017’s 2,600% rally. The platform suggested that an optimistic target may drive prices as high as $77-$100.

For context, XRP is currently valued at $2.23 with a market cap of $131 billion. A $33 target increases the market cap to ~$2 trillion (1,400 %+), which is more than Bitcoin’s current market cap.
From a lower-time frame (LTF) perspective, XRP shows an inverse head-and-shoulders pattern, which could potentially test the resistance range between $2.50 and $2.67. The resistance range also coincides with the Fibonacci extension levels drawn from the neckline’s base to the head’s lowest point.
Although the relative strength index (RSI) is nearing overbought territory, suggesting a potential pause in price movement at the current range.

Related: XRP Ledger Foundation spots ‘crypto stealing backdoor’ in code library
This article does not contain investment advice or recommendations. Every investment and trading move involves risk, and readers should conduct their own research when making a decision.
The Solana price is eyeing a breakout above $155, backed by institutional buys, ETF exposure, and leading DEX volumes.
Solana’s been quietly making moves in both the charts and the headlines. From institutional interest to on-chain activity, there’s a clear shift in how it’s being viewed across the market.
Instead of wild price swings or hype-driven rallies, this time it’s the steady buildup that stands out. Big players are buying in, and the technical setup is starting to reflect that.
Big institutions are starting to look beyond Bitcoin and Ethereum. The Solana Post shares that ARK Invest, led by Cathie Wood, just took its first direct step into Solana by adding exposure through the new SOLQ ETF on the Toronto Stock Exchange.
ARK Invest adds Solana exposure through SOLQ ETF, signaling growing institutional confidence. Source: The Solana Post via X.
With both ARKW and ARKF ETFs now holding SOL, this isn’t just a passive move; rather, it’s a clear signal that Solana is being taken seriously by institutions that once stayed away from altcoins. The ETF exposure makes it a financial move from ARK, which will have an impact on the ongoing Solana price pridiction.
Fresh off the heels of ARK Invest’s ETF-backed Solana move, Galaxy Digital is now adding to the bullish prospects. According to Altcoin Daily, Mike Novogratz’s firm has just rotated $106 million out of Ethereum and into Solana. For Solana to be prioritized over ETH at this scale sends a message that some big players see the momentum shifting.

Galaxy Digital rotates $106M from Ethereum into Solana. Source: Altcoin Daily via X.
While Ethereum remains the DeFi leader, the growing list of high-profile Solana supporters is hard to ignore. This move suggests Galaxy believes Solana’s scalability, lower fees, and increasing institutional support are becoming too compelling to pass up.
Right after the $106M move from Galaxy Digital into Solana, Crypto VIP Signal is now spotting something equally noteworthy on the charts. According to the analyst, Solana is forming an inverse head and shoulders pattern on the daily timeframe. The neckline resistance lies just above the $152 to $155 zone, and if the price breaks above this level, SOL Solana price could be entering a fresh bullish phase.
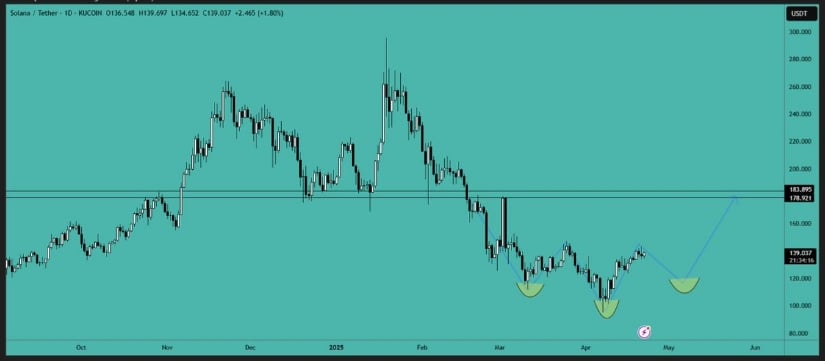
Solana’s inverse head and shoulders pattern points to a $180 target, with $152 resistance in play. Source: Crypto VIP Signal via X.
However, Crypto VIP Signal also notes that a potential retest of the $120 to $125 region looks likely in the short term, possibly acting as a final shakeout before a bigger move toward the $180 to $190 range. This setup comes at a moment when institutional interest is rising, with Galaxy Digital and ARK Invest backing SOL in meaningful ways.
Following the inverse head & shoulders setup we just discussed, this latest chart from VegetaCrypto1 adds further depth to Solana’s technical roadmap. The price is currently hovering just below the key resistance block between $141 and $144. If buyers can reclaim this zone, the next real test lies at the neckline resistance around $152 to $153. A clean break above this level could trigger a 30–35% upside move toward the $180 to $185 region.
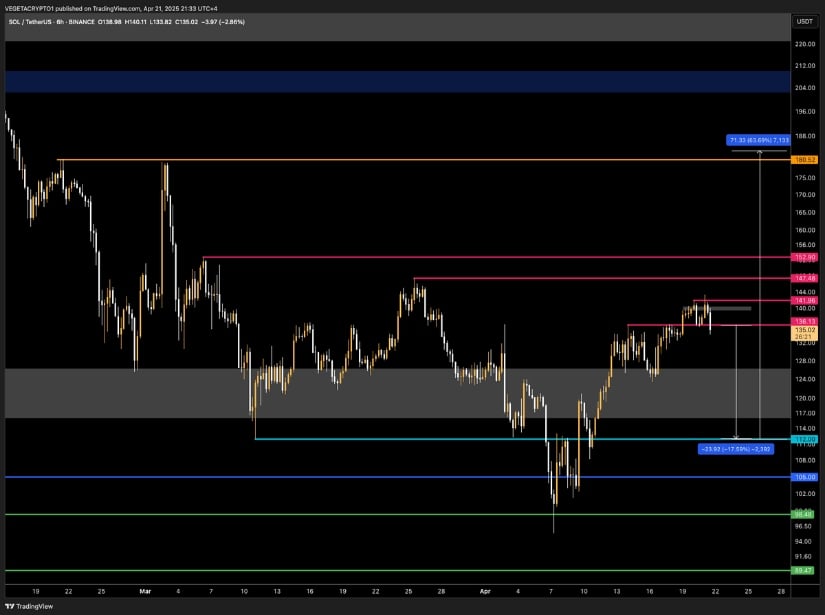
Solana price faces key resistance at $141-$144, with potential for 30-35% upside if $152 breaks. Source: VegetaCrypto1 via X.
The rejection near $144 shows that bulls aren’t in full control just yet. A revisit to the grey demand block around $125 to $128 is on the table if momentum falters here. That wouldn’t necessarily break the bullish structure; instead, it could serve as a healthy retest before another leg higher, believes VegetaCrypto1. With strong confluence across multiple timeframes and growing institutional interest, the technicals suggest SOL Solana price is building a serious case for a sustained breakout.
As institutional eyes continue turning toward Solana, its on-chain performance is giving them good reason. According to The Solana Post, Solana DEX volumes has led all blockchains in the last 24 hours, clocking in over $2.11 billion, beating Ethereum and BSC by a significant margin.
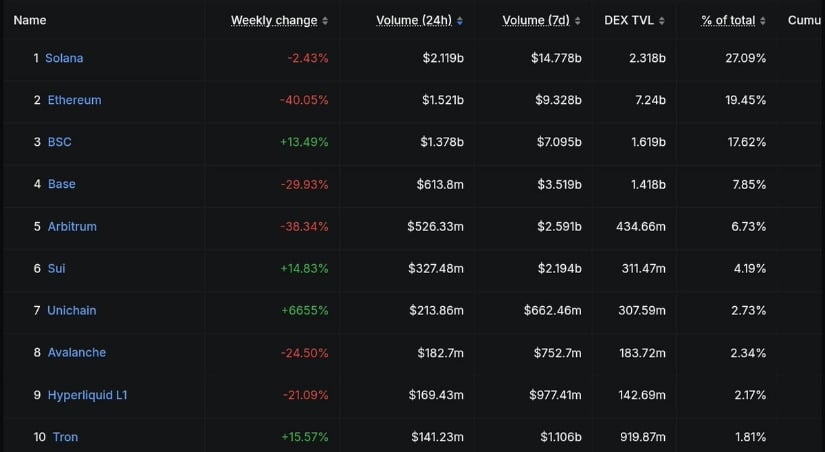
Solana leads DEX volume with over $2.11 billion, outpacing Ethereum and BSC. Source: The Solana Post via X.
The volumes nearly account for 27% of the total DEX volume, showing the strength of Solana’s liquidity and real user activity. DEX volume often acts as a leading indicator for sign of strength. Combined with Solana’s potential breakout patterns and resilience near resistance, this activity surge could act as a catalyst for the next Solana price rally.
Between major ETF exposure from ARK Invest, Galaxy Digital’s $106 million rotation, and leading DEX volumes, Solana is ticking off all the boxes for institutional and on-chain strength. While short-term volatility may still shake things up, the broader trend paints a compelling picture. If technical patterns hold and momentum sustains, the current Solana price prediction scenarios aiming for $180 seem well within reach.
Bitcoin (BTC) price hovers around $92,800 on Wednesday after rallying 9.75% over the past two days. Ethereum (ETH) and Ripple (XRP) followed BTC’s footsteps and continued their recovery rally. The technical outlook suggests an upward trend, targeting $95,000 BTC, $1,900 ETH, and $3 XRP.
Bitcoin price has faced multiple rejections around its 200-day Exponential Moving Average (EMA) at $85,000 since April 13. On Monday, BTC finally broke above this resistance level, rising 9.7% to close above $90,000. At the time of writing on Wednesday, it hovers at around the $92,800 level.
If BTC continues its upward momentum, it could extend the rally to test its March 2 high of $95,000.
The daily chart’s Relative Strength Index (RSI) stands at 65, above its neutral level of 50, indicating bullish momentum.
BTC/USDT daily chart
On the contrary, if BTC declines, it could find support around its key level of $85,000.
Ethereum price rallied 11.19% on Tuesday, breaking above the $1,700 resistance level. At the time of writing on Wednesday, it continues to trade higher at around $1,780.
If ETH continues its upward trend, it could extend the rally to retest its next daily resistance at $1,861.
The RSI on the daily chart stands at 54, above its neutral level of 50, indicating bullish momentum.
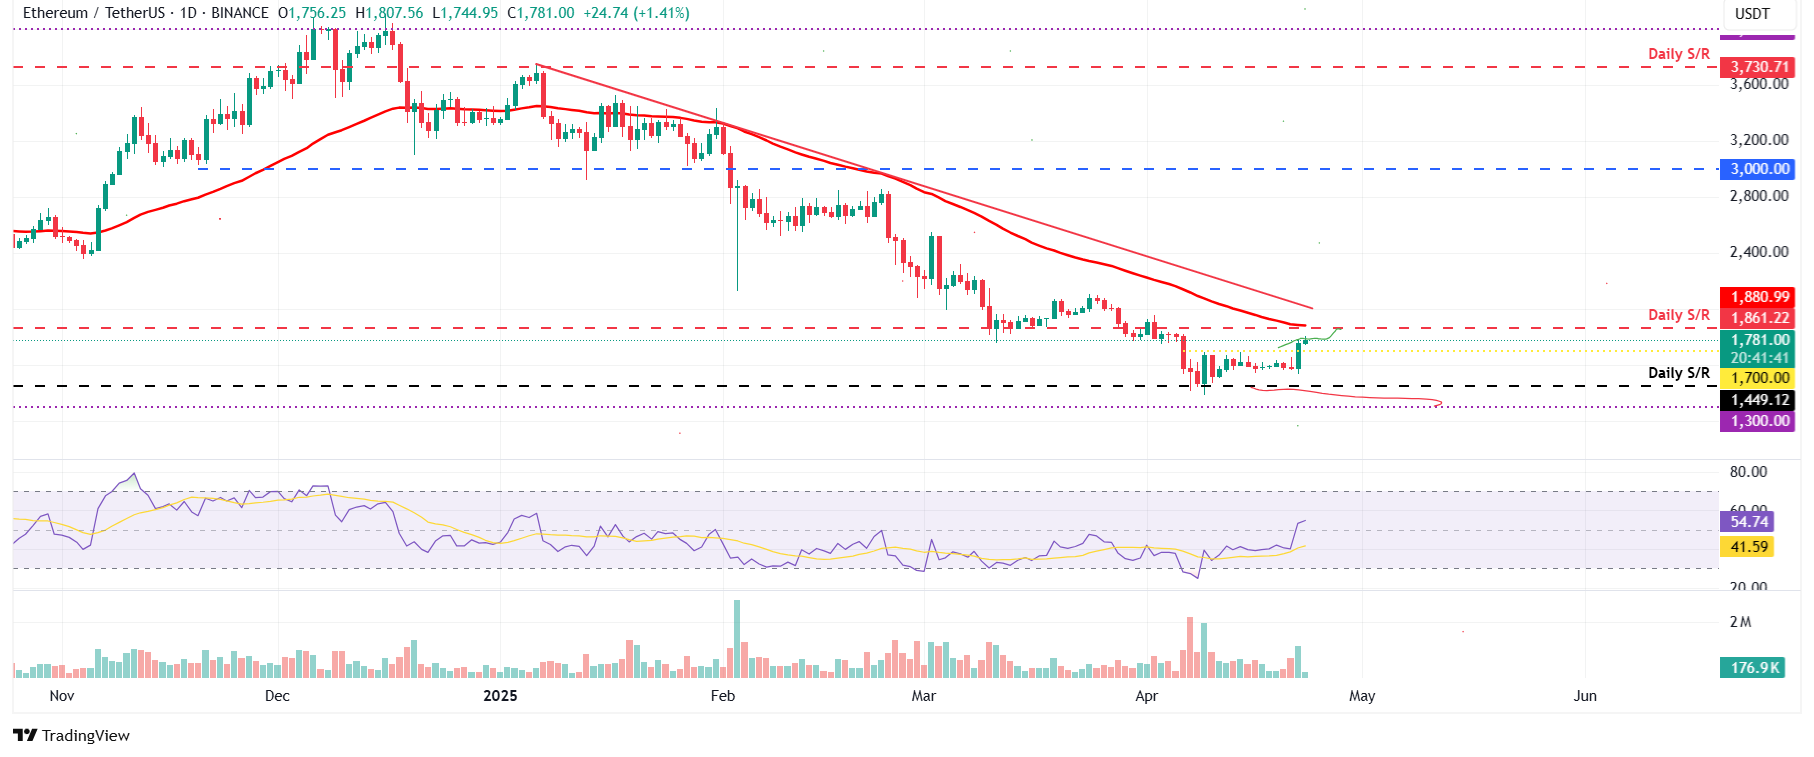
ETH/USDT daily chart
However, if ETH experiences a correction, it could extend its losses and retest its daily support level at $1,449.
XRP price rose 6.53% and closed above its 50-day Exponential Moving Average at $2.19 on Tuesday. At the time of writing on Wednesday, it is approaching its daily resistance level at around $2.23.
If XRP closes above its daily resistance level of $2.23, it will extend the rally to retest its March 24 high of $2.50 before potentially reaching $3.00.
The RSI on the daily chart reads 56, above its neutral level of 50, indicating bullish momentum.

XRP/USDT daily chart
However, if XRP continues its decline and closes below its 200-day EMA, it could extend the decline to retest its next support level at $1.77.
Bitcoin is the largest cryptocurrency by market capitalization, a virtual currency designed to serve as money. This form of payment cannot be controlled by any one person, group, or entity, which eliminates the need for third-party participation during financial transactions.
Altcoins are any cryptocurrency apart from Bitcoin, but some also regard Ethereum as a non-altcoin because it is from these two cryptocurrencies that forking happens. If this is true, then Litecoin is the first altcoin, forked from the Bitcoin protocol and, therefore, an “improved” version of it.
Stablecoins are cryptocurrencies designed to have a stable price, with their value backed by a reserve of the asset it represents. To achieve this, the value of any one stablecoin is pegged to a commodity or financial instrument, such as the US Dollar (USD), with its supply regulated by an algorithm or demand. The main goal of stablecoins is to provide an on/off-ramp for investors willing to trade and invest in cryptocurrencies. Stablecoins also allow investors to store value since cryptocurrencies, in general, are subject to volatility.
Bitcoin dominance is the ratio of Bitcoin’s market capitalization to the total market capitalization of all cryptocurrencies combined. It provides a clear picture of Bitcoin’s interest among investors. A high BTC dominance typically happens before and during a bull run, in which investors resort to investing in relatively stable and high market capitalization cryptocurrency like Bitcoin. A drop in BTC dominance usually means that investors are moving their capital and/or profits to altcoins in a quest for higher returns, which usually triggers an explosion of altcoin rallies.
Polygon (MATIC), a popular layer-2 scaling solution for Ethereum, has gained significant traction within the cryptocurrency space. With the recent migration of its native token from MATIC to POL and the introduction of Polygon 2.0, the network has entered a new phase of evolution. Polygon’s move to a zkEVM system promises to bring greater utility to the blockchain, and investors are now wondering whether the price of MATIC will surge to $1 or even higher in the coming years.
As of now, Polygon’s price hovers around $0.218. However, projections for the next few years suggest that Polygon could see substantial growth. In 2025, analysts predict that the price could reach a maximum of $0.47181, fueled by the large-scale adoption of Polygon 2.0 and its new features. However, there could be some corrections along the way, with a potential low of $0.11795, leading to an average price of $0.29488. Despite these fluctuations, the growth potential is evident, as Polygon continues to expand its use case across the blockchain ecosystem.
Looking ahead to 2026, Polygon’s price is expected to rise further. The projected high for 2026 is $0.75490, while the low could be around $0.18872. This price range reflects the growing interest in Polygon as more developers and decentralized applications (dApps) adopt the network’s solutions. As Polygon’s zkEVM technology gains traction, the demand for the platform is likely to increase, supporting the potential for growth.
By 2027, Polygon’s price could cross the $1 mark for the first time, with a high of $1.20784. This would represent a significant milestone for the project, as it continues to build out its ecosystem and enhance its infrastructure. The projected low for 2027 is $0.30196, and the average price could sit around $0.75490. This upward trend would be fueled by the continued integration of Polygon into the DeFi space, further solidifying its position as a top contender among blockchain platforms.
As the Polygon network matures, 2028 could be another breakthrough year for the project. Analysts predict that the price could rise to as much as $1.93254 by the end of the year, with a low of $0.48313 and an average of $1.20784. This price surge would be driven by Polygon’s expanding role in the blockchain industry and its increasing utility in decentralized finance, non-fungible tokens (NFTs), and other use cases.
The momentum doesn’t stop there, as Polygon is expected to reach even higher price levels in 2029 and 2030. In 2029, the price could potentially hit $3.09207, with a low of $0.77299 and an average of $1.93254. This would mark Polygon’s further adoption and a significant rise in its value as it competes with other blockchain platforms. By 2030, MATIC could reach a high of $4.94731, with an average price of $3.09207. This long-term growth would be fueled by Polygon’s continuous innovation and its ever-expanding ecosystem of decentralized applications, developers, and users.
Several market analysts have also weighed in on Polygon’s price prediction. Some forecasts suggest that MATIC could see prices as high as $0.370506 in 2025, with moderate growth in 2026 and 2030, where prices could potentially reach $0.610569. Although predictions vary, the overall sentiment remains bullish, driven by the ongoing development of Polygon’s network and its increasing adoption across the blockchain space.
In conclusion, Polygon’s outlook for the next several years appears bright. The project’s technological advancements, including the introduction of Polygon 2.0, are expected to significantly contribute to the growth of MATIC’s value. With expanding use cases and increasing interest from developers, the price of Polygon could surge to $0.47 in 2025 and may continue to rise in the following years, potentially reaching as high as $4.95 by 2030. For investors, Polygon offers significant growth potential, making it an attractive option in the long-term cryptocurrency market. However, as always, market conditions should be closely monitored as the crypto space remains volatile.
Post Views: 3
Dogecoin has crossed the $0.18 mark with strong bullish momentum. Analysts are eyeing a target of $0.2, while derivatives data shows growing interest.
With Bitcoin gaining momentum, meme coins are leading the recovery rally. Over the past 24 hours, the meme coin sector has surged by 12%, reaching a total market capitalization of $54.14 billion.
The largest meme coin by market cap, Dogecoin, now holds a valuation of $27.27 billion. Currently, DOGE is trading at $0.1830, having surged nearly 12% in the last 24 hours. Will this sudden recovery push DOGE beyond the psychological $0.20 level?
In the 4-hour price chart, the Dogecoin price action surpasses the short-term resistance trend line as predicted in our previous analysis. The short-term recovery run, creating a streak of bullish candles, is challenging the 78.60% Fibonacci level at $0.1858.

Dogecoin price has surpassed the 200 EMA line. Furthermore, it has influenced a positive crossover in the 50 and 100 EMA lines. This marks a trend reversal in the short term, increasing the upside chances.
Additionally, the daily RSI line has entered the overbought region, signaling strong bullish momentum. However, the short-term struggle to exceed the 78.60% Fibonacci level warns of a minor retest.
The current DOGE price action hints at an evening star pattern to retest the 61.80% Fibonacci level at $0.1727. However, as the broader market recovers, a post-retest turnaround in Dogecoin will likely prolong the uptrend to the $0.20 psychological level.
Crypto analyst Ali Martinez supports the bullish case by highlighting a breakout rally in Dogecoin. According to him, DOGE has broken out of an ascending triangle pattern, with the neckline at $0.1680.
Based on Fibonacci projections, Martinez forecasts an upside potential to $0.1950. However, a minor pullback retesting the breakout zone remains possible.
#Dogecoin $DOGE appears to be breaking out of an ascending triangle, with a potential upside target of $0.195! pic.twitter.com/P7dkmIiQ9B
— Ali (@ali_charts) April 22, 2025
Over the last 24 hours, Dogecoin’s strong recovery has driven increased activity in the derivatives market. According to Coinglass, DOGE’s open interest has jumped nearly 13%, reaching $1.93 billion.

Additionally, the funding rate has climbed to 0.0097%, reflecting heightened bullish sentiment. In the same period, short liquidations totaled $10.64 million, further fueling the rally.
As a result, the derivatives market appears to be anticipating a continued bullish move in Dogecoin prices.
DisClamier: This content is informational and should not be considered financial advice. The views expressed in this article may include the author’s personal opinions and do not reflect The Crypto Basic opinion. Readers are encouraged to do thorough research before making any investment decisions. The Crypto Basic is not responsible for any financial losses.
Cardano (ADA) price is extending its gains, trading at around $0.69 at the time of writing on Wednesday after rallying nearly 9% the previous day. On-chain data supports this rise as Santiment’s Supply Distribution metric indicates that whale wallets are accumulating ADA tokens. Additionally, the technical outlook suggests an upward trend, while ADA’s funding rates are positive and bullish bets are rising.
Santiment’s Supply Distribution data projects a bullish outlook for Cardano as whales bought ADA tokens during the recent price dip.
Santiment’s Supply Distribution metric indicates that the whales holding between 100,000 to 1 million, 1 million to 10 million, and 10 million to 100 million ADA tokens have surged from 5.69 billion to 5.89 billion, 5.65 billion to 5.73 billion, and 12.67 billion to 12.87 billion, respectively, from April 14 to Wednesday.
This development indicates that these whales have seized the opportunity to accumulate Cardano at a discount during the recent price dip, thereby bolstering investors’ confidence in ADA.
Cardano Supply Distribution chart. Source: Santiment
Another bullish sign is Coinglass’s ADA long-to-short ratio, which reads 1.06, the highest level in over a month. This ratio above one reflects bullish sentiment in the markets as more traders are betting on the asset price to rise.
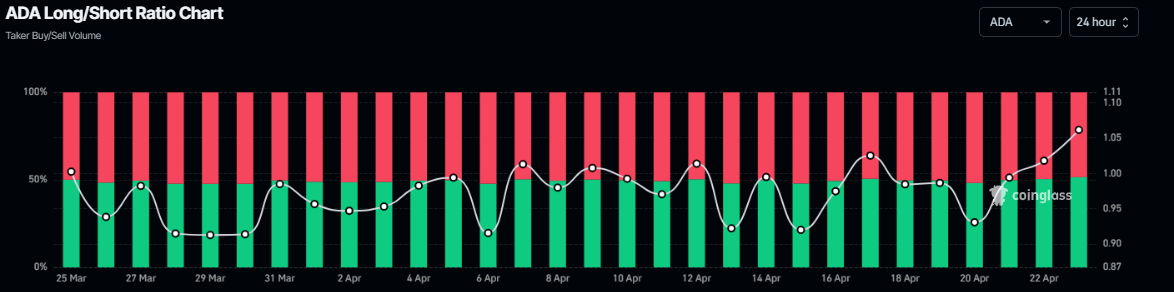
Cardano long-to-short ratio chart. Source: Coinglass
Moreover, examining Coinglass’s OI-Weighted Funding Rate data projects a clearer outlook; the number of traders betting that the price of Cardano will decline further is lower than that anticipating a price increase.
This index is based on the yields of futures contracts, which are weighted by their Open Interest (OI) rates. Generally, a positive rate (longs pay shorts) indicates bullish sentiment, while negative numbers (shorts pay longs) indicate bearishness.
In the case of ADA, this metric flipped a positive rate on Monday and currently stands at 0.0096%, the highest level since February 22, indicating that longs are paying shorts. This scenario generally indicates bullish sentiment in the market, suggesting a potential price recovery for Cardano.
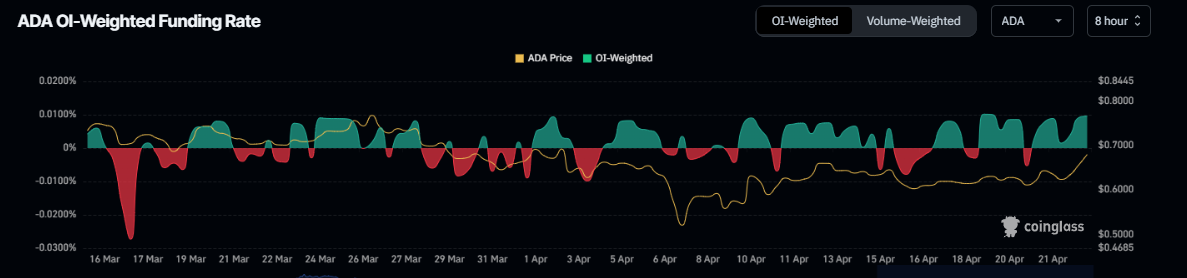
ADA OI-Weighted Funding Rate chart. Source: Coinglass
Cardano price retested and was supported around the 78.60% Fibonacci retracement (drawn from the August 5 low of $0.27 to the December 3 high of $1.32) at $0.50 on April 7. Subsequently, it rallied by 21% over the next two weeks. At the time of writing on Wednesday, it continues to trade higher above the 61.8% Fibonacci retracement level at 0.67.
If ADA continues its upward momentum and breaks above the 200-day Exponential Moving Average (EMA) at $0.71, it could extend the rally to retest the weekly resistance level at $0.74, potentially reaching $0.80, a psychologically significant level.
The Relative Strength Index (RSI) reads 57, pointing upwards above its neutral level of 50, indicating bullish momentum.
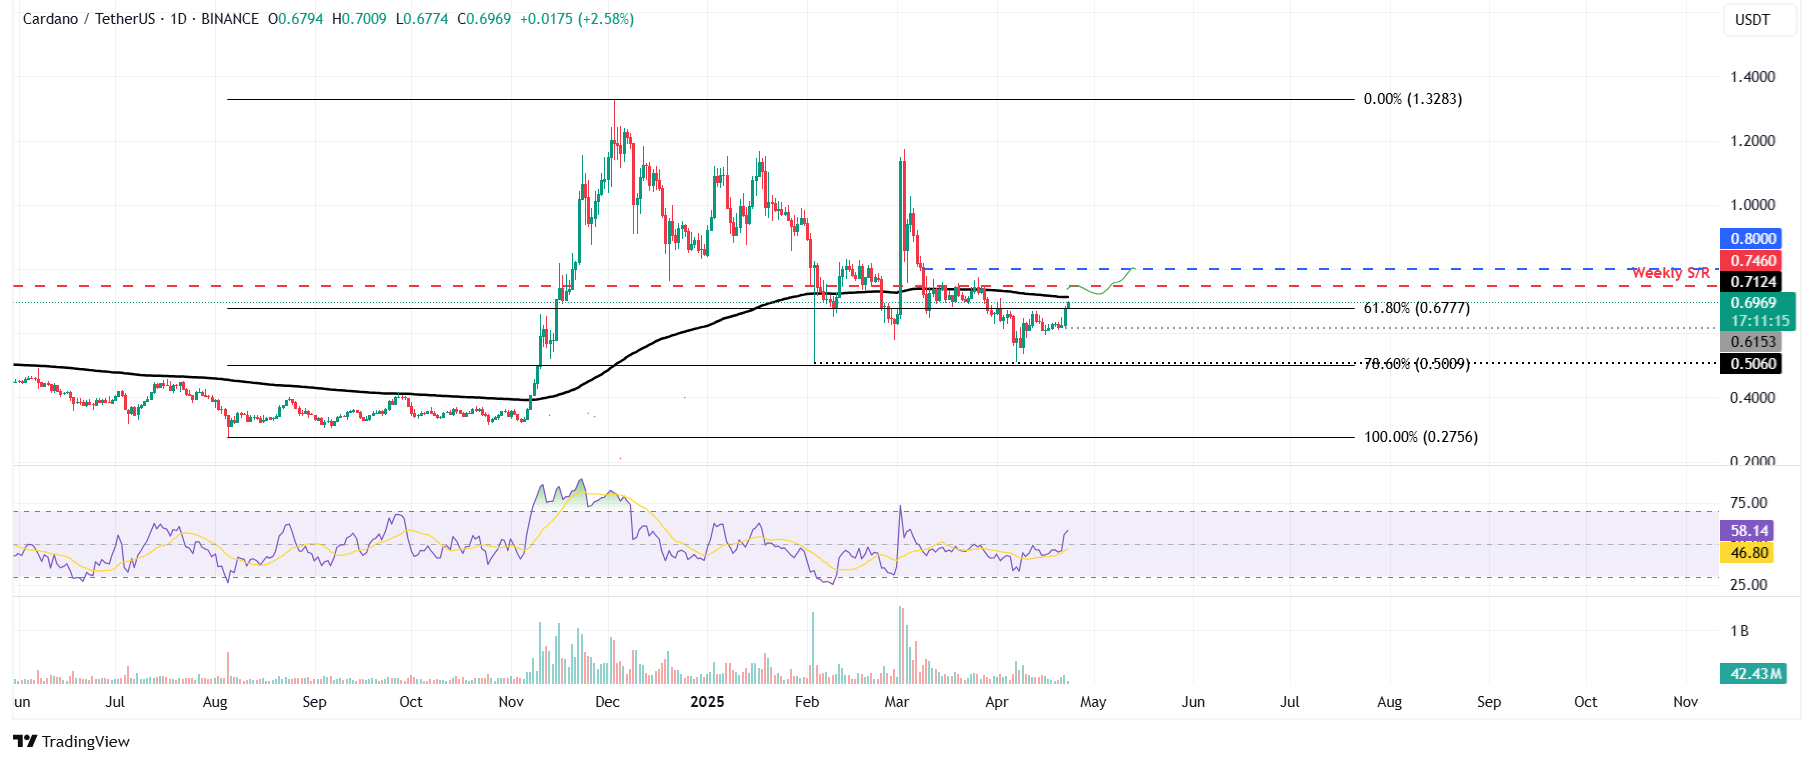
ADA/USDT daily chart
Although on-chain metrics and technical analysis support a bullish outlook, a daily candlestick close below Monday’s low of $0.61 would invalidate the bullish thesis. This development could cause Cardano’s price to decline and retest its next support level at $0.50.
All eyes are on Bitcoin (BTC) nowadays as the leading cryptocurrency once again has risen like a phoenix and, following a 20% surge in recent weeks, gives breath to other digital assets. Gold is renewing an all-time high, Bitcoin is establishing itself as a safe-haven asset, and alternative cryptocurrencies are taking their chunk of this market revival.
This is perhaps the first time since November 2024 when the prices of cryptocurrencies started looking more attractive than ever during these five months of downside and sideways trading. XRP is in the center of attention too, of course.
The end of last year and the beginning of the new one was probably the most fruitful period for the altcoin with it skyrocketing 500% straight to a new all-time high at $3.4. Now, the situation with XRP is starting to look interesting again, according to a recent price outlook by an expert trader known better online as “DonAlt.”
In his latest observation, DonAlt, who was in the XRP boat right before the pump from $0.5 started, declared that the asset is still one of the most interesting altcoin charts out there.
Related
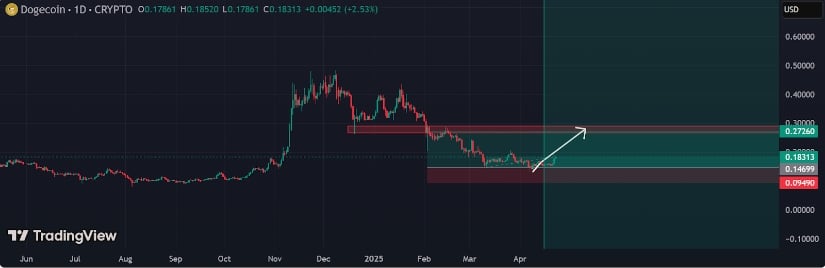
For now, XRP is chilling at a range low after having wiped out the lows before, says the trader. But if this market upswing driven by Bitcoin holds, he expects XRP to be among the best performers. The frame for the third biggest cryptocurrency is clear — support at $2, resistance at $2.7265.
Related
Should bullish bias, which is currently prevailing on the market, hold XRP to break the resistance, the next aim will be a historical peak. A negative scenario is still there, though, and will activate if the price of asset breaks down the support, dipping further below $1.9.
Solana continues to attract attention with its steady climb toward the $200 mark, fueled by strong on-chain metrics and rising institutional support. But while SOL eyes another rally, one altcoin is quietly outpacing expectations.
Remittix, a payments-focused DeFi project, is drawing investor buzz with its real-world utility and explosive presale growth. With analysts forecasting a possible 10x return, some traders now believe Remittix could outperform Solana in 2025. Here’s what makes both tokens worth watching.
Solana is showing signs of resilience, trading around $145 with a 5.5% uptick. Trading volume is also up nearly 24% to $4.32 billion, pointing to increased interest and potential momentum.
Over the past week, SOL has gained close to 12%, reinforcing its steady recovery after recent market pullbacks. Analysts believe Solana could be gearing up for a serious run, with many now eyeing a $200 target if momentum holds.
Crypto analysts have outlined the crucial zones to watch: resistance at $142.07 and a key support level near $113.71. They presented three scenarios for SOL’s path forward: a clean breakout above resistance, a pullback following rejection, or a bounce off support. In all three setups, high trading volume is critical for confirmation.
Beyond technicals, institutional interest is quietly piling in. Ark Invest has made headlines by adding exposure to Solana through the 3iQ SOL Staking ETF (SOLQ), now included in their ARKW and ARKF funds. This ETF doesn’t just hold SOL—it also taps into staking rewards, giving investors a taste of passive income via blockchain. It’s a subtle but powerful signal that institutions may be warming to alternatives beyond Ethereum.
While Solana price predictions vary, Changelly’s April forecast expects SOL to average $145.69 with highs pushing $151.48. Some bullish projections even suggest that a sustained push through current resistance zones could put Solana on track toward $200 sooner than expected.
Still, with all eyes on Solana price prediction, another emerging altcoin is quietly gaining ground—offering not just steady growth, but the potential for explosive 10x returns. As Solana closes in on legacy dominance, some investors are already looking ahead to what could be the next breakout star of 2025.
While Solana continues its steady climb toward the $200 mark, many investors are quietly shifting their attention to a lesser-known altcoin that could deliver far greater returns—Remittix. This payments-focused project isn’t just riding market sentiment; it’s solving a problem worth trillions.
Cross-border transfers remain one of the biggest inefficiencies in finance, especially for the 1.4 billion people who remain unbanked. Remittix offers a way out, with real-time crypto-to-fiat conversions that work across 30+ currencies and 50+ token pairs.
Unlike speculative meme tokens or over promised utility coins, Remittix is already winning over investors with its practical application. The project has sold over 527 million tokens and raised more than $14.5 million during its presale, all while maintaining a price of just $0.0757 per token.
The momentum speaks volumes. Where Western Union charges steep fees and delivers transfers in days, Remittix clears transactions in hours—sometimes minutes—without the need for middlemen.
Its PayFi system links digital wallets to traditional bank accounts, making it easy for freelancers, migrants, and businesses to move money across borders without friction. That simplicity and accessibility could make it one of the most disruptive crypto assets in the payments space. Some analysts are already penciling in a 10x upside if user adoption continues to grow.
Solana may have a clear path to $200, but Remittix is quietly writing its own success story. If mass adoption catches on, RTX might outperform many top-10 coins, turning early believers into the biggest winners of 2025.
Discover the future of PayFi with Remittix by checking out their presale here:
Website: https://remittix.io/
Socials: https://linktr.ee/remittix
Disclaimer: This content is provided by a sponsor. FinanceFeeds does not independently verify the legitimacy, credibility, claims, or financial viability of the information or description of services mentioned. As such, we bear no responsibility for any potential risks, inaccuracies, or misleading representations related to the content. This post does not constitute financial advice or a recommendation and should not be treated as such. We strongly advise seeking independent financial guidance from a qualified and regulated professional before engaging in any investment or financial activities. Please review our full disclaimer for more details.
As the crypto market looks to bounce back in the closing days of April, XRP Price Predictions are riding a high wave of optimism, with its price hitting $2.14 today, fueled by regulatory clarity from Ripple, institutional uptake and Bitcoin’s surge past $90,000.
Meanwhile, Remittix (RTX) wows investors with its presale success that has raised over $14.5 million. With experts eyeing XRP for a potential $5.81 peak this year, the question remains on everyone’s lips: can Ripple soar on the wave of BTC’s momentum and RTX’s PayFi mania?
Let us have a glance at the recent XRP price predictions and Remittix’s promising trajectory.
Ripple Labs and its XRP token are back in the news, aided by shifting political currents and fresh investor optimism. Ripple CEO Brad Garlinghouse indicated in a recent interview with Fox Business that the firm is recovering significant funds already paid out to the SEC—interest and all.
This is because of what he called a more welcoming regulatory climate under the new White House administration. “It’s just proof that the previous [Gary] Gensler SEC was in the wrong,” Garlinghouse stated, pointing out how the new leadership’s change of heart is correcting wrongs.
Ripple’s pro-President Donald Trump policy appears to be yielding dividends. The firm reportedly contributed millions to his campaign and gave $5 million in XRP tokens as inauguration gifts on January 20.

With the regulatory overhang removed, Ripple is expanding rapidly. Its recent acquisition of Hidden Road, a prime brokerage firm, for $1.25 billion is its largest to date. Garlinghouse indicates this visionary move would not have made logical sense a year back due to previous SEC administration.
The price of XRP currently sits at $2.15 and it has shown a 3% elevation in the past 24 hours. XRP price predictions from analysts at Changelly forecast Ripple to reach an average price of $3.34 by June 2026 while reaching a maximum price of $4.58 if market sentiment remains high and institutions continue buying activities.
Remittix is a rising new remittance protocol designed for seamless global money transfers, nearly as simple as sending a letter. As a unique blockchain project Remittix focuses on delivering performance alongside outstanding interoperability and regulation-compliant contracts that provide borderless cost efficiency.
Fintech professionals and investors worldwide are impressed with how Remittix integrates human-centered design with financial-grade infrastructure. The actual-world remittance solution provided by Remittix delivers a revolutionary approach to value transfer that targets the $800 billion industry through its intuitive and scalable framework.
The sales figures during the presale period indicate that Remittix attracts growing market interest. About 527 million Remittix tokens have reached the market for $0.0757 based on latest records which makes it one of the most attractive DeFi investments. The fast sellout of presale tiers caused prices to surge thus offering appreciable return potential to initial buyers.
Remittix achieved a remarkable $14.5 million presale during Q2 2025 which makes it one of the most successful pre-sales in the quarter given market appreciation of its vision and execution. The initiative uses raised funds to create innovative technology while building strategic alliances and international regulatory agreements which positions the company for ongoing achievement.
The time to invest in the future is now as the Defi company is achieving its targets rapidly while the market hype surges. Compared to XRP price predictions that are purely speculative, Remittix value is real and has netted early investors over 400% ROI so far.
Taking part in the Remittix presale positions investors to acquire both financial returns while securing ownership in the disruptive financial payment transformation system. Join in now!
Discover the future of PayFi with Remittix by checking out their presale here:
Website: https://remittix.io/
Socials: https://linktr.ee/remittix
Disclaimer: For information purposes only. Past performance is not indicative of future results.
 Price Prediction 2025-2030: Potential for Significant Growth")

