The main tag of cryptocurrency price today Articles.
You can use the search box below to find what you need.
[wd_asp id=1]
The main tag of cryptocurrency price today Articles.
You can use the search box below to find what you need.
[wd_asp id=1]
Multiple entities, such as Changelly and ChatGPT, are bullish on Dogecoin, predicting potential timelines for DOGE to clinch lofty targets of $1 – $5.
Dogecoin (DOGE) is gradually recovering from the Monday crash that sent its price to $0.1315, representing a drop of 72.8% from its December 8 peak of $0.4835. Other prominent crypto assets, including Bitcoin and Ethereum, also significantly declined yesterday.
Interestingly, DOGE has started recovering from the huge dip, with its price skyrocketing 15.89% from its daily low to $0.15. Despite the surge, DOGE is still down 79.33% from its all-time high (ATH), registered on May 8, 2021.
While DOGE is far below its ATH, investors are still optimistic about a major rally in the future. They believe that DOGE could hit new ATH targets within the $1 to $5 range.
DOGE is trading at $0.1524, with a market cap of $22.67 billion. Its trading volume has spiked 71.25% in the past 24 hours to $3.13 billion.
Hitting the targets of $1, $2, $3, $4, and $5 would demand DOGE to surge 556%, 1,212%, 1,868%, 2,524%, and 3,180%, respectively. At these targets, DOGE’s valuation will range between $148.76 billion and $743.81 billion.
As this optimism gained momentum, The Crypto Basic consulted several sources, including ChatGPT and Changelly experts, to ascertain when DOGE could hit these targets.
Experts at Changelly predict that DOGE will hit the $1 target by April 2030. They suggest that DOGE would reach a maximum target of $1.02 by then, with the minimum price set at $0.867.
However, popular AI chatbot ChatGPT speculates that Dogecoin will clinch the $1 target sooner, setting the estimated timeline around late 2025 to early 2026. ChatGPT assumes that the bull market must have gained traction by then, with strong retail enthusiasm driven by social media buzz.
The chatbot also expects Elon Musk to contribute immensely to DOGE’s growth through social media mentions or business integration.
ChatGPT expects this target to materialize by mid to late 2026, driven by altcoin season, broader meme coin adoption, and several tech giants like X adopting DOGE as a payment method.
However, Changelly believes DOGE will clinch the $2 target by February 2032, seven years from now. The exchange’s analysts expect DOGE to rise to a minimum price of $1.73 and a maximum target of $2.06 by then.
Further, ChatGPT expects the $3 – $4 price target to play out between 2027 and 2028. The chatbot assumes that strong institutional interests alongside real-world utilities will drive Dogecoin’s potential surge to the target.
It also mentions Dogecoin’s exposure to exchange-traded funds (ETFs) as another catalyst that would drive its price to the $3 to $4 mark. It bears mentioning that asset managers like Bitwise and Grayscale have filed to launch a spot DOGE ETF in the U.S.
Meanwhile, Changelly analysts predict that DOGE will clinch the $3 target by February 2033 and $4 by November 2033.
Lastly, ChatGPT predicts that DOGE will clinch the $5 target under an extremely bullish scenario in which the token is recognized as the native currency of the internet.
If this happens, the chatbot expects DOGE to be integrated into top projects, including Starlink and gaming platforms.
Based on these assumptions, ChatGPT predicts that DOGE will clinch the $5 price target between 2028 and 2030. However, Changelly believes it will take much longer before DOGE reaches the milestone, setting a timeline of June 2034, nine years from now.
DisClamier: This content is informational and should not be considered financial advice. The views expressed in this article may include the author’s personal opinions and do not reflect The Crypto Basic opinion. Readers are encouraged to do thorough research before making any investment decisions. The Crypto Basic is not responsible for any financial losses.
Cardano price prediction shows a potential rebound after a 47% YTD drop, with institutional backing and bullish signals suggesting a recovery is on the horizon.
After a rough start to 2025, Cardano is back in focus. The ADA Cardano price has dropped nearly 47% year-to-date, caught in the crossfire of global tariff tensions and a broader market pullback. But now, it’s hovering near a level where buyers have stepped in before, and some early signals suggest they might be circling again.
At the same time, institutional players like Grayscale are doubling down, and key indicators are hinting at a possible reversal. With sentiment still shaky but not broken, ADA could be setting up for a positive move.
A fresh wave of volatility has hit the crypto market, triggered by tariff tensions between global countries. With investors turning risk-averse, top digital assets have faced sharp declines since the start of 2025. In a recent post, CryptoDiffer highlighted how macro pressure continues to weigh heavily on the crypto landscape, with Bitcoin, Ethereum, and even ADA posting deep pullbacks. Geopolitical and economic uncertainty is casting a long shadow over risk assets.
Cardano price down 47% YTD as global macro tensions spark renewed crypto market sell-off. Source: CryptoDiffer via X
As noted, the Cardano price hasn’t escaped the damage, shedding nearly 47% YTD. Bearish momentum still lingers as macro headwinds weigh heavy, but not all is lost. ADA is now hovering near a historically significant zone where reversals have occurred before. With steady network upgrades and a loyal holder base, a bounce is still on the table if sentiment stabilizes. For now, it’s a battle between short-term fear and long-term conviction.
Cardano just scored a quiet win in the institutional space. In its latest rebalancing, Grayscale has increased ADA’s share to 22.91% within its Smart Contract Fund, pushing it up to become the third-largest holding in the basket. This move places Cardano ahead of Avalanche, Polkadot, and Sui combined, signaling continued institutional interest in the protocol’s long-term potential.

Grayscale boosts Cardano to 22.91% of its Smart Contract Fund. Source: Mintern via X
Analyst MinTern notes that while it’s not a flashy pump headline, it does speak volumes about confidence in Cardano’s fundamentals. In a market where investor trust is hard to earn, this reallocation suggests that Grayscale sees real staying power in ADA’s ecosystem.
Despite broader market weakness, Cardano just delivered a glimmer of hope for ADA bulls. According to crypto analyst Ali Martinez, the TD Sequential indicator has flashed a daily buy signal, often seen ahead of short-term trend reversals.
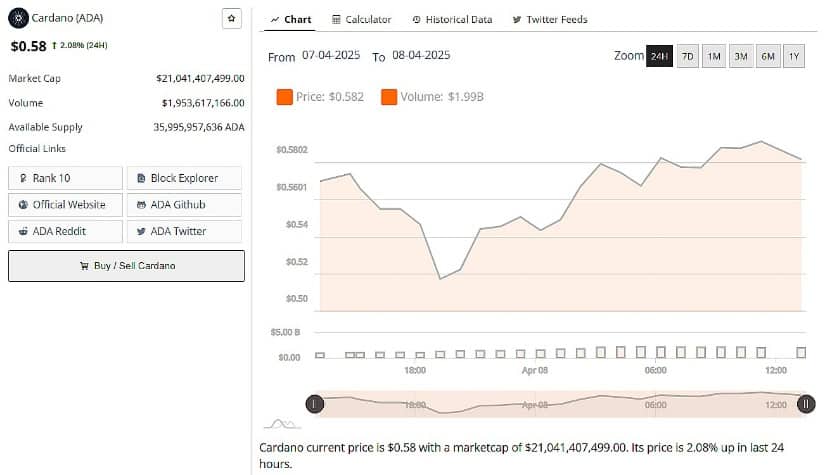
The pattern suggests ADA could be preparing for a rebound after trading in the $0.58–$0.60 zone, where price action has historically found support.
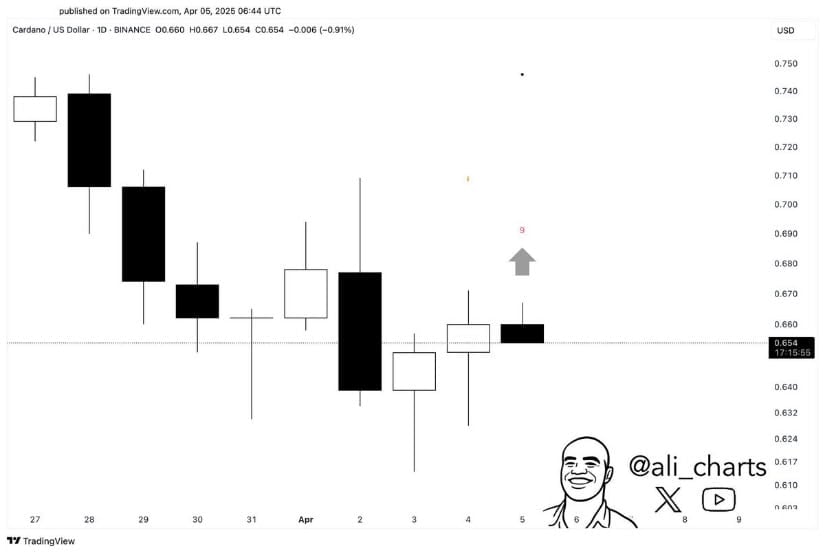
Cardano flashes a TD Sequential buy signal as bulls eye a rebound from key support. Source: Ali Martinez via X
While the macro landscape still leans bearish, Bitcoin has quickly rebounded from its initial tariff induced low of $74,900 and this Cardano technical cue adds weight to a potential relief rally. If momentum holds, ADA could look to reclaim $0.66 and possibly retest $0.70 in the short term. That said, a breakdown below $0.50 would invalidate the setup and expose ADA to further downside. The next few daily closes could be crucial in deciding whether Cardano finds its footing or continues to drift lower.
While Cardano’s price continues to wrestle with macro pressure, trader sentiment is beginning to tilt bullish. According to on-chain analyst Ali Martinez, 67.61% of traders on Binance Futures are currently holding long positions on ADA, with a long/short ratio of 2.09. This suggests that despite short-term uncertainty, a majority of participants are positioning for a potential upside move.
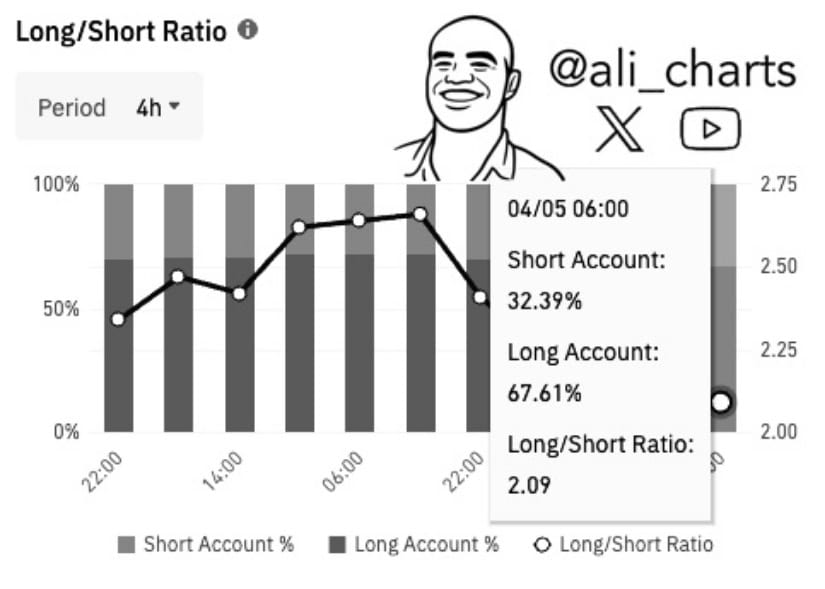
Over 67% of Binance Futures traders are long on ADA. Source: Ali Martinez via X
The data highlights that technical indicators, such as the TD Sequential, are signaling potential reversals. Martinez’s data shows that traders are quietly front-running a bounce, betting that ADA’s historical support zones will hold firm once again.
According to analyst LuckyChartApe, Cardano’s price is currently sitting at a key technical zone between $0.52 and $0.47, an area that aligns with the 61.8% and 65% Fibonacci retracement levels. These levels have historically attracted buying interest, making this a potentially important area to monitor. While ADA has seen a steep decline, this zone could act as a pivot if buyers step in with enough momentum.

Cardano tests key Fibonacci support between $0.52 and $0.47, with upside potential toward $0.90. Source: LuckyChartApe via X
As part of this Cardano price prediction, the analyst notes that if ADA can hold this level and start building a base, a move toward $0.66 might be on the table, and possibly even $0.90 if broader sentiment improves. But if this support breaks down, the drop can take out even the $0.38 level support.
The ADA Cardano price is at important support levels, and how it reacts here could shape its next move. If buyers step in and the price gets back above $0.63, there’s a chance it could slowly work its way back toward $0.66 or even $0.90 if the broader market improves. But if that level breaks, ADA might see a deeper pullback, possibly toward $0.38. For now, it’s a wait-and-see situation as the market looks for direction.
Dogecoin price has been experiencing heavy volatility in recent days. The popular meme cryptocurrency has fallen by 22% from Saturday’s high of $0.171, with analysts now predicting a potential 59% drop. Technical indicators suggest DOGE might be heading toward a major price correction in the coming weeks.
The price decline comes as Dogecoin broke below a long-standing ascending parallel channel that had guided its price action since 2018. This breach marks a notable technical shift in DOGE’s market structure.
According to technical analysts, the loss of this key trendline support suggests growing bearish momentum. The breakdown coincides with rejection at the 0.786 Fibonacci retracement level, located at approximately $0.16395.
Experts note that the next major support level for Dogecoin lies at the 0.618 Fibonacci retracement, which is around $0.06167. This level aligns with previous consolidation zones, making it an important focus point for traders.
Adding to market uncertainty, a whale has transferred 300 million Dogecoin, valued at around $41.7 million, to the Binance exchange. Such large transfers often precede selling pressure or major position adjustments.
Despite the bearish outlook, there are hints of a possible recovery. Crypto trader Trader Tardigrade points out a bullish divergence on Dogecoin’s daily chart.
This pattern emerges when price moves lower while the Relative Strength Index (RSI) bounces and posts higher lows. The divergence suggests selling momentum may be weakening, potentially indicating a price reversal.
Dogecoin is currently testing the $0.135 price level, which has acted as both support and resistance in the past. This level held firm throughout a consolidation phase in early 2023, and the current price action may present a reversal pattern.
Some analysts believe that if Dogecoin can sustain these support levels, there’s a possibility that DOGE price may recover and eventually reach higher targets.
“If the price bounces from this level, we are likely to see the start of a new bull trend,” one analyst commented. However, they cautioned that if support fails, further downside movement could test $0.12 or even $0.10.
On-chain metrics paint a concerning picture for Dogecoin’s short-term prospects. Daily active addresses have fallen toward levels maintained since January, after seeing a major uptick in November.
Social media engagement around DOGE has also been declining. The social dominance trend has been falling, with April setting new lows in social volume. This suggests that unless the price trend changes direction, attention and capital flows will continue to leave the market.
The funding rate has moved into negative figures after a week of efforts from bulls. This highlights favorable conditions for sellers in the derivatives market.
On the technical side, the one-day Dogecoin chart shows steady selling pressure since December, with the On-Balance Volume indicator slowly but steadily falling. The RSI has remained below the neutral 50 level since mid-January, indicating an ongoing bearish trend.
The $0.131 and $0.102 support levels from October 2024 are now the next price targets. The former has been tested in recent hours and could yield a bounce to the $0.154-$0.164 range.
Despite the potential for a 15% short-term bounce, the overall trend remains firmly bearish in the near term, according to market analysts.
Some market participants suggest watching for a reclaiming of the $0.18 level as a sign of a possible fakeout or short-term recovery. If Dogecoin can flip this level and close above it, further resistance levels would be set at $0.25 and $0.30.
However, if the price fails to break through the key levels at $0.18 and $0.20, the memecoin may experience a continued slowdown in its recovery attempts.
The most recent liquidation data shows $37.15 million worth of DOGE positions were liquidated across all exchanges, with $31.87 million (85.78%) being long positions.
Dogecoin’s price slide of 22.6% in 24 hours came as Bitcoin shed 10.68% of its value after panic spread across global markets due to trade war developments.
Ripple (XRP) seeks stability in a volatile crypto landscape influenced by macroeconomic factors, including reciprocal tariffs. The international money transfer token hit a low of $1.64 on Monday after opening the week at $1.92, representing a 14.5% daily drop. At the time of writing on Tuesday, during the late Asian session, XRP had recovered Monday losses, exchanging hands at $1.92, as global markets continue to adjust and digest United States (US) President Donald Trump’s ever-changing tariff policy.
After a gruesome sell-off on Monday, major assets like Bitcoin (BTC), Ethereum (ETH), and Solana (SOL) are bouncing back. Trump’s blanket 10% reciprocal tariffs announced on April 2 will be effective on Wednesday.
Despite the bleeding in global markets, including US stocks, Trump insisted during a press conference with Israeli Prime Minister Benjamin Netanyahu on Monday that tariffs would continue as planned. The president seemed to add fuel to the fire, threatening an additional 50% tariff on China.
It is not immediately clear whether the recovery in XRP price to $1.92 is sustainable, especially with tariffs taking effect in just a day. Meanwhile, some on-chain fundamentals support the beginning of a larger rebound, calling on investors to consider buying XRP at current levels.
Santiment’s Market Value Realized Value (MVRV) metric holds 9.47% below the mean at 1 in the chart, suggesting that XRP is heavily undervalued. Traders holding the XRP token are unlikely to sell at the current price as they would realize substantial losses. This situation could translate to reduced selling pressure, hinting at a potential rebound amid growing seller exhaustion. A negative MVRV ratio has historically been viewed as a buy signal.
XRP MVRV | Source: Santiment
XRP could rejuvenate its bullish structure if support at $2 is reclaimed. However, bulls must first navigate a volatile landscape to keep the price higher, including a daily close above the 200-day Exponential Moving Average (EMA). Moreover, the Relative Strength Index (RSI) continues to slide toward the oversold region, which may encourage sellers to stay put. At the same time, the Moving Average Convergence Divergence (MACD) indicator sustained a sell signal on March 28, suggesting a deeper downtrend is in play.
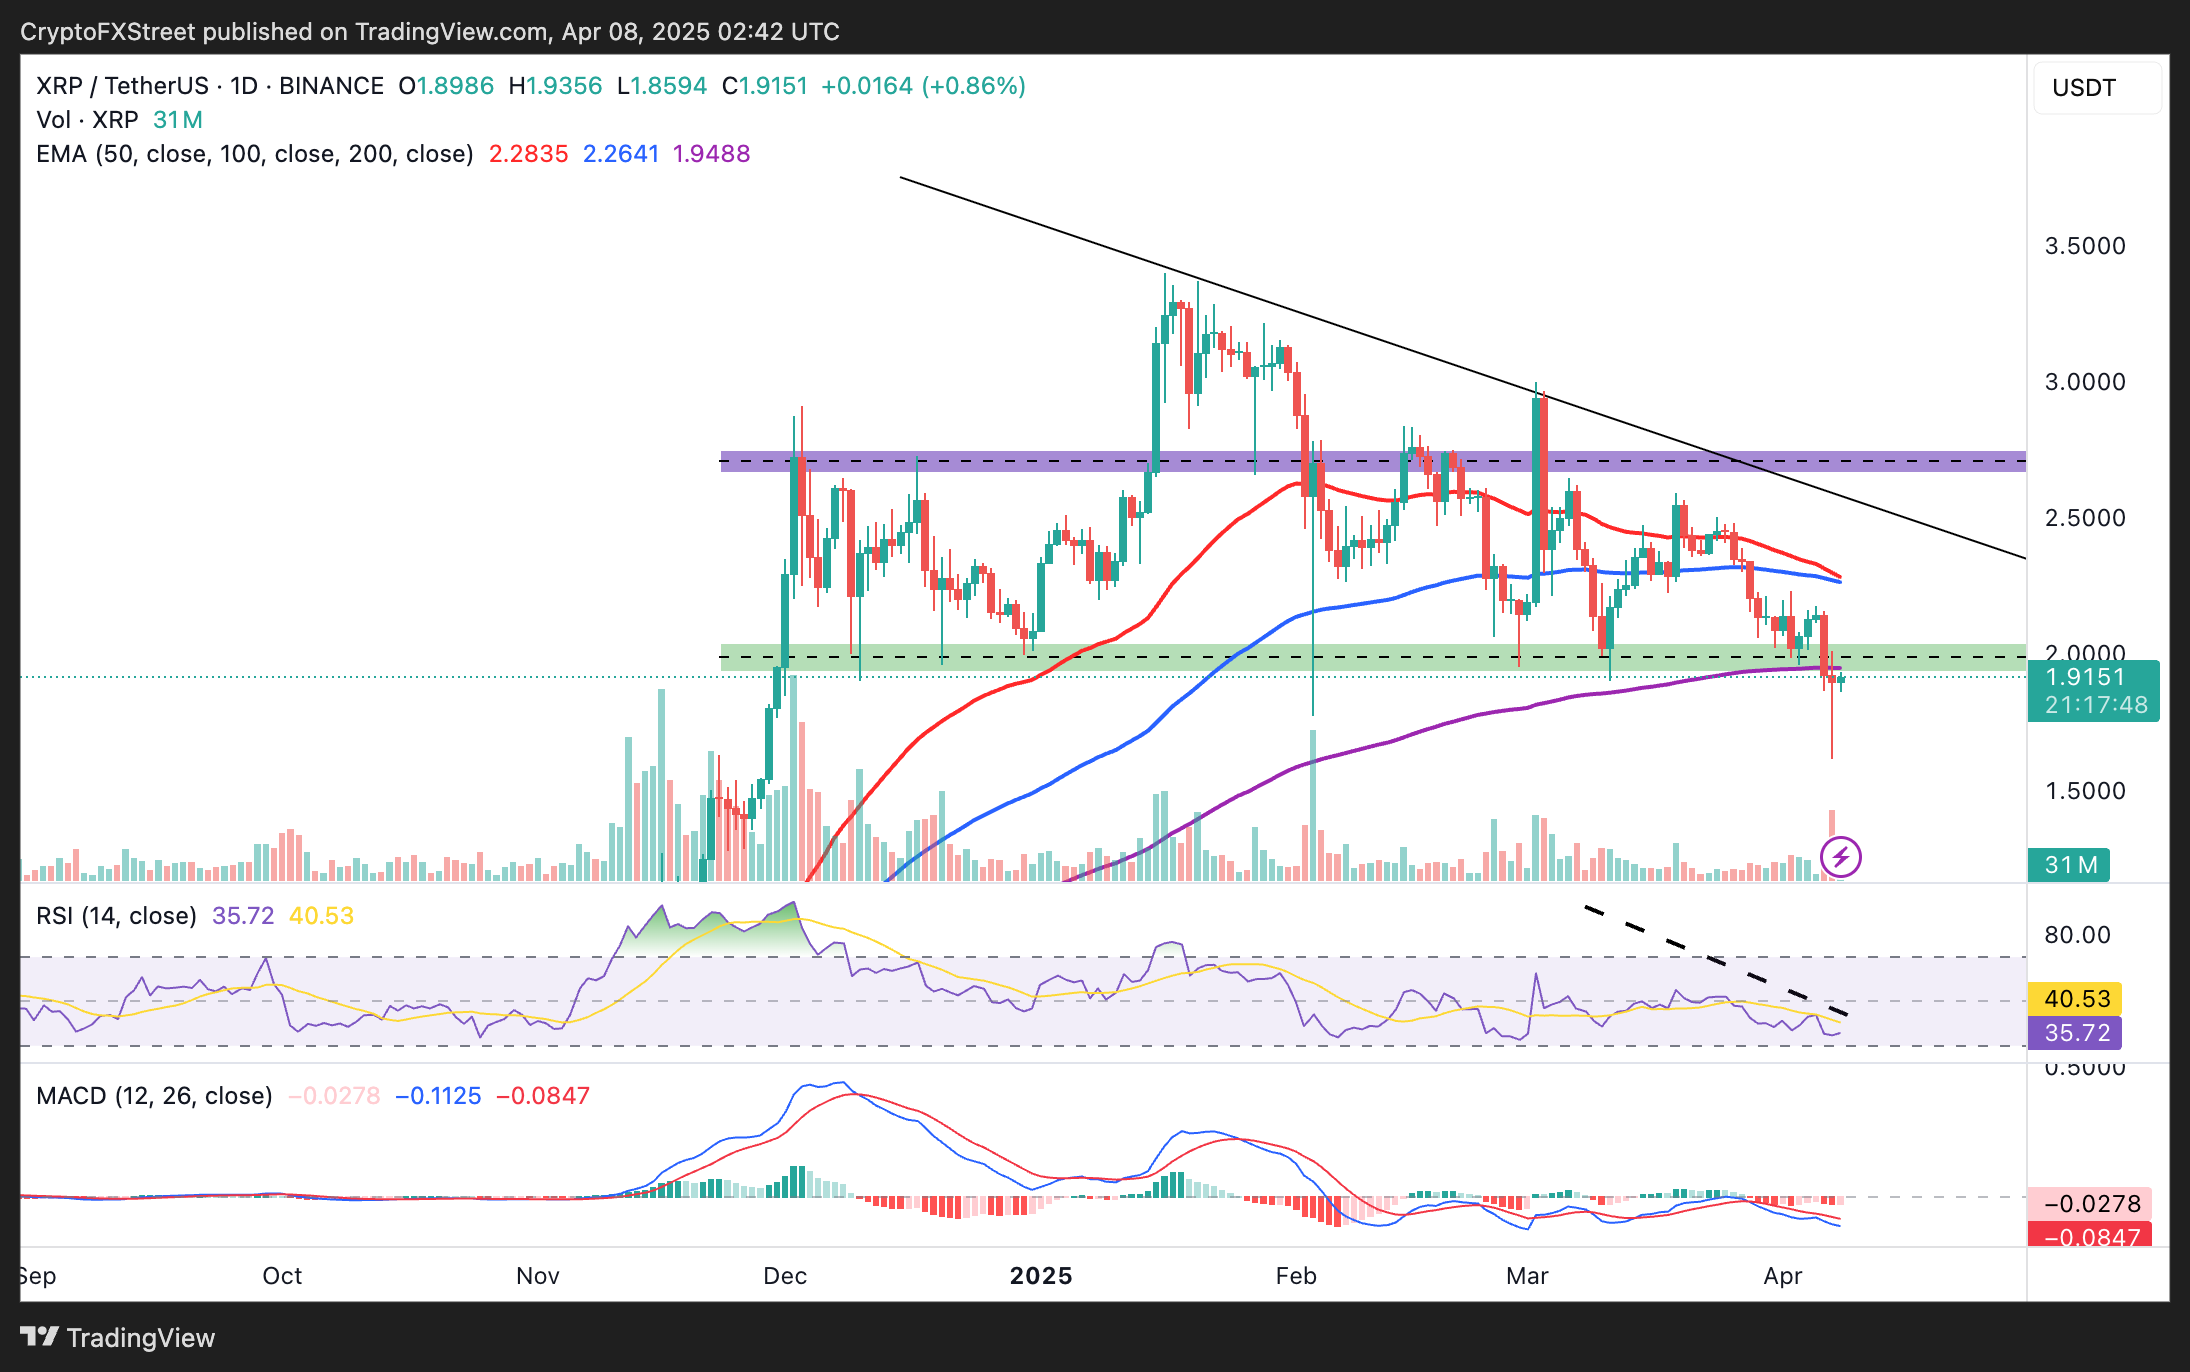
XRP/USDT daily chart
All eyes are set on the bull’s ability to reclaim the $2.00 level as support — a move that could reinforce XRP’s bullish structure and pave the way for recovery to $3.00.
However, the declining network activity observed with Santiment’s Daily Active addresses metric could slow recovery. As per the chart, only 10,100 addresses were active on the network on Monday compared to 581,000 addresses on March 19.
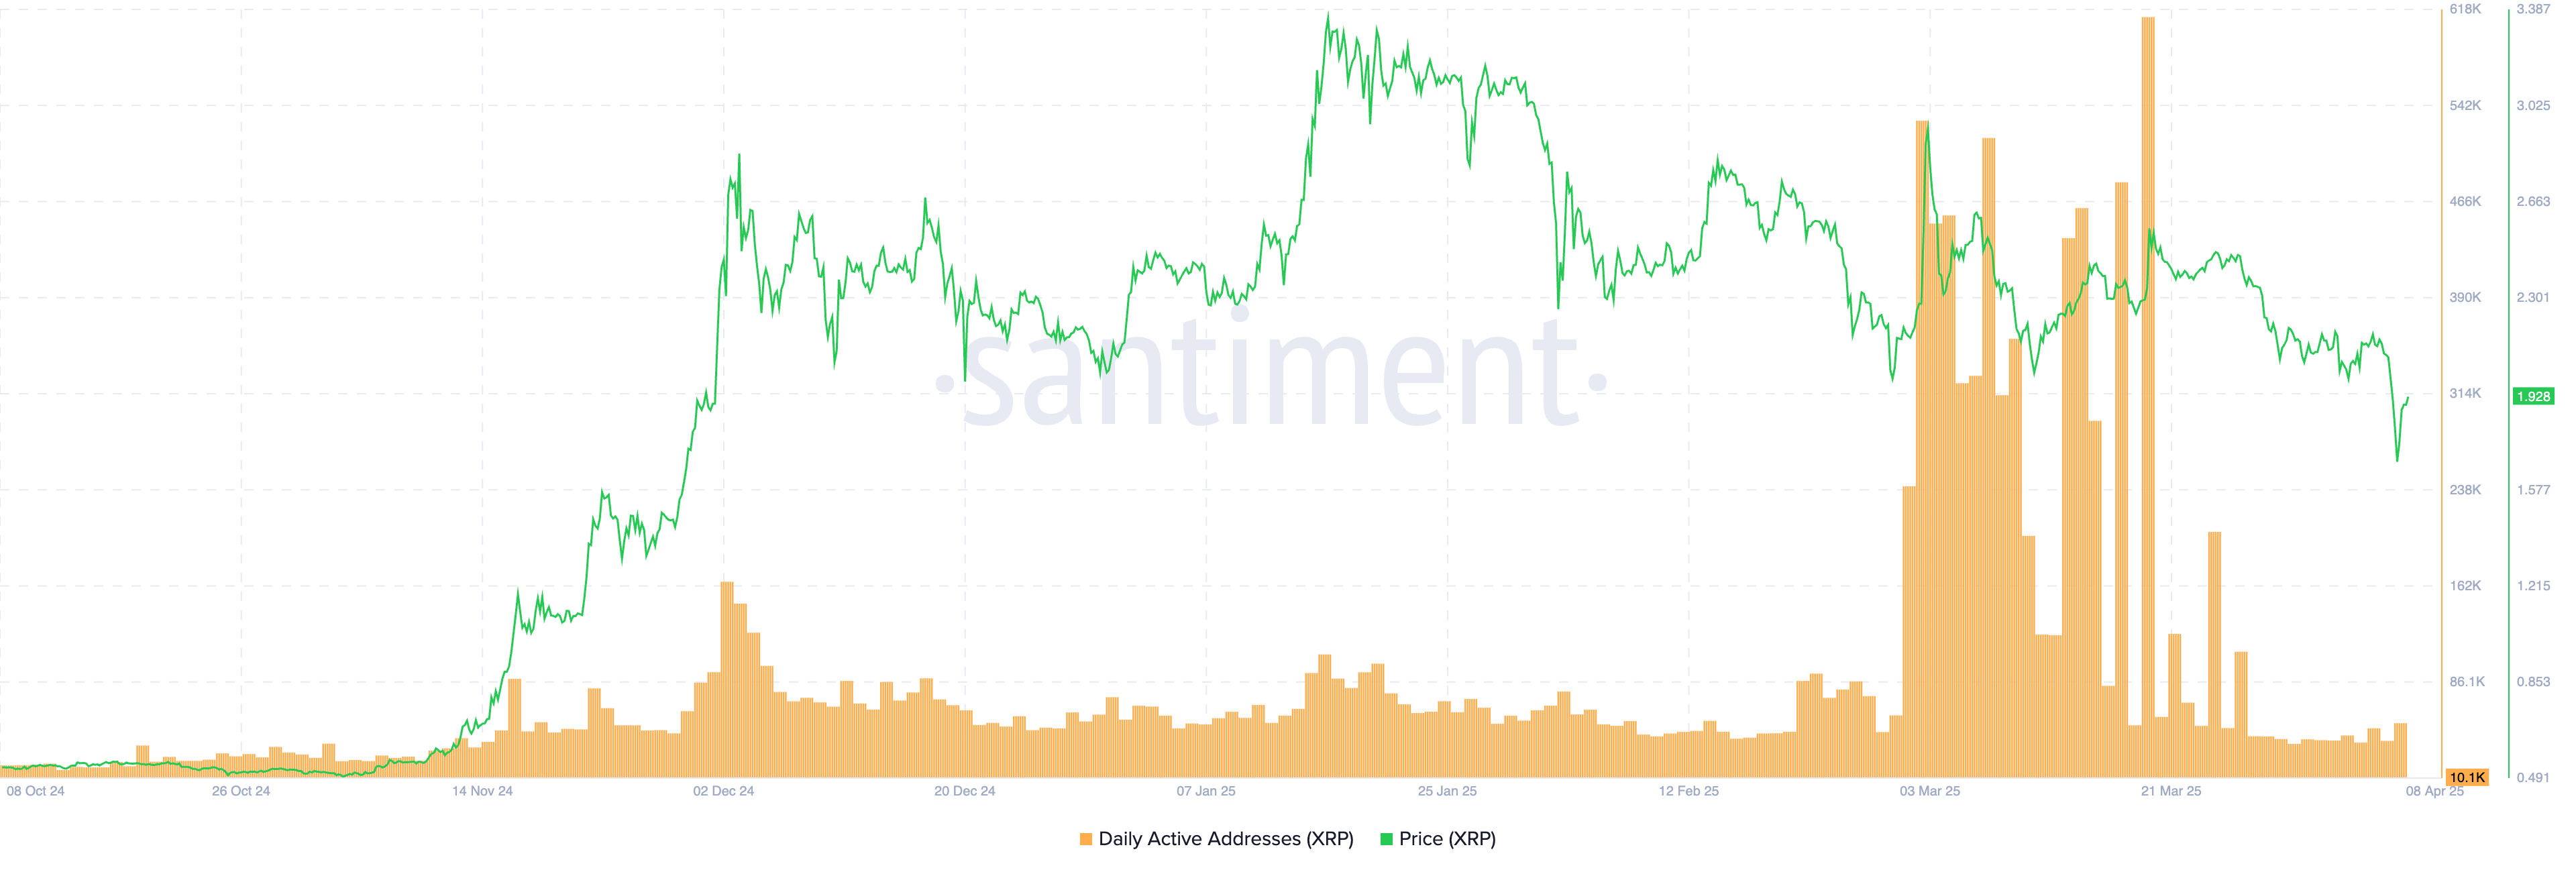
XRP Daily Active Addresses | Source: Santiment
A consistent drop in network activity impacts the underlying asset’s performance, depriving it of momentum to sustain recovery due to low demand. Hence, waiting for a trend confirmation before going all in and buying the dip would be prudent.
It depends on the transaction, according to a court ruling released on July 14, 2023:
For institutional investors or over-the-counter sales, XRP is a security.
For retail investors who bought the token via programmatic sales on exchanges, on-demand liquidity services and other platforms, XRP is not a security.
The United States Securities & Exchange Commission (SEC) accused Ripple and its executives of raising more than $1.3 billion through an unregistered asset offering of the XRP token.
While the judge ruled that programmatic sales aren’t considered securities, sales of XRP tokens to institutional investors are indeed investment contracts. In this last case, Ripple did breach the US securities law and had to pay a $125 million civil fine.
The ruling offers a partial win for both Ripple and the SEC, depending on what one looks at.
Ripple gets a big win over the fact that programmatic sales aren’t considered securities, and this could bode well for the broader crypto sector as most of the assets eyed by the SEC’s crackdown are handled by decentralized entities that sold their tokens mostly to retail investors via exchange platforms, experts say.
Still, the ruling doesn’t help much to answer the key question of what makes a digital asset a security, so it isn’t clear yet if this lawsuit will set precedent for other open cases that affect dozens of digital assets. Topics such as which is the right degree of decentralization to avoid the “security” label or where to draw the line between institutional and programmatic sales persist.
The SEC has stepped up its enforcement actions toward the blockchain and digital assets industry, filing charges against platforms such as Coinbase or Binance for allegedly violating the US Securities law. The SEC claims that the majority of crypto assets are securities and thus subject to strict regulation.
While defendants can use parts of Ripple’s ruling in their favor, the SEC can also find reasons in it to keep its current strategy of regulation by enforcement.
Let’s be real. Things are looking red out there, and Solana hasn’t been spared.
But wait—before you join the panic party, let’s zoom out, breathe, and really look at what might be going on here.
I’ve seen this story before.
Right now, the market is going through what looks like a textbook emotional cycle. Panic, fear, disbelief—you name it. And yes, Solana has dropped sharply in the last few hours. But why exactly?
Let’s break it down with some solid Solana analysis.
On the daily chart, a clean trendline had formed—touched three, four times.
And what usually happens after that fourth touch? Exactly. A break. Not because price “wanted” to. But because liquidity.
Institutional traders love trendlines because retail traders rely on them emotionally. So they hunt the liquidity sitting just below. And that seems to be exactly what happened here.
Right after sweeping that trendline, price reacted to a key daily demand zone. Interesting, right?
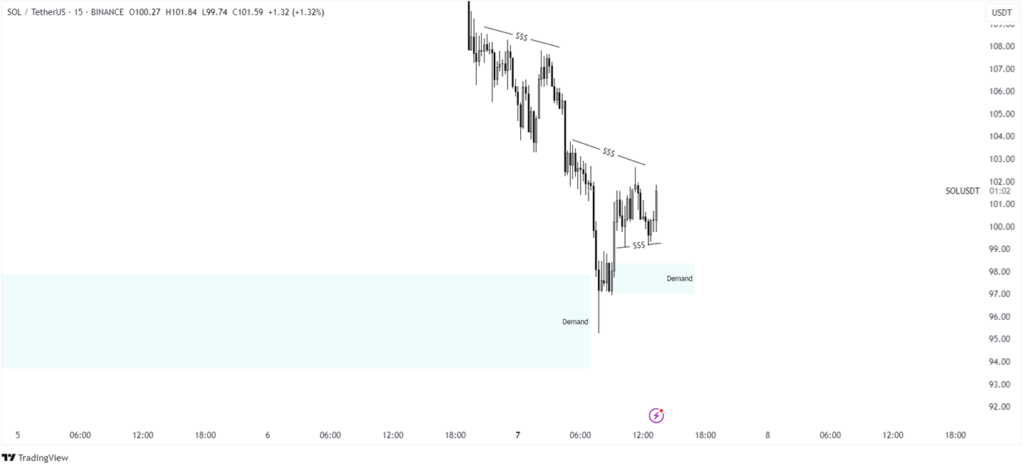
Now switching gears to the 15-minute chart, things get spicy.
We’ve got:

Sounds like a decent recipe for a bounce, if we get some confluence.
But—and this is key—after a first reaction, that demand could still get broken. So be ready to move to break even quickly, especially if you’re in for a short-term long.
Okay, zooming way out… if this liquidity sweep and reaction hold, we might be setting up for a more sustained move back to the upside.
Of course, long-term predictions are always rough, but Solana’s fundamentals and network activity remain strong, even through this chaos.
So, is this dip just a setup for a stronger recovery? That’s what we’re watching for. Not every dip is the end—sometimes it’s just a better entry.
Ready to trade with lower fees and tighter spreads? Try Weex today and level up your entries.
I’ll say it again: nothing is guaranteed. Markets don’t care about our analysis. They don’t owe us a clean reaction. But these setups give us structure. A framework to manage risk, stay sane, and avoid chasing candles with emotion.
I’ve fallen into that trap before—getting hyped on green candles or crushed by red ones. What keeps me grounded is the plan. And right now, the plan is clear:
Watch M15. Look for character change. React, don’t predict.
Solana just gave us a big move down. But the market doesn’t move randomly—it moves with intention.
If we play our cards right and don’t get too emotional, we might just catch the next leg… up.
The week has begun with an ongoing market correction, according to CoinMarketCap. CoinMarketCap”>
The rate of Binance Coin (BNB) has fallen by 4.27% over the last day.TradingView”>
On the hourly chart, the price of BNB has made a false breakout of the local resistance of $565.75. As most of the daily ATR has been passed, there are low chances of seeing sharp moves by tomorrow.TradingView”>
On the longer time frame, the rate of the native exchange coin is far from key levels. If the candle closes around the current prices, ongoing sideways trading in the range of $540-$580 is the most likely scenario.TradingView”>
From the midterm point of view, the picture is similar. The volume remains low, which means neither buyers nor sellers are ready to seize the initiative.
In this regard, traders are unlikely to witness sharp ups or downs shortly.
BNB is trading at $551.22 at press time.
The last day of the week is bearish for most of the coins, according to CoinStats.CoinStats”>
The rate of Ethereum ![]() ETHUSD has declined by almost 1% since yesterday.TradingView”>
ETHUSD has declined by almost 1% since yesterday.TradingView”>
On the hourly chart, the price of the main altcoin is about to break the local support of $1,796. If it happens and the daily bar closes below it, the decline is likely to continue to the $1,780 mark soon.TradingView”>
On the bigger time frame, the rate of ETH is looking bearish as the growth did not last long after a false breakout of the support of $1,754.
If bulls cannot seize the initiative shortly, traders may expect a test of the aforementioned mark soon.TradingView”>
From the midterm point of view, sellers are also more powerful than buyers. If a breakout of the $1,754 level happens, there might be a more profound drop to $1,600.
Ethereum is trading at $1,794 at press time.
Bulls are weaker than bears on the first day of the week, according to CoinStats.
DOGE is one of the biggest losers today, falling by 8.18%.

On the hourly chart, the rate of DOGE has made a false breakout of the local resistance of $0.1515. If the daily bar closes far from it, the drop is likely to continue to the $0.13-$0.14 area tomorrow.

On the bigger time frame, the price of DOGE has bounced off the formed support of $0.1428. However, if the candle closes near it or below, there is a chance to witness a level breakout, followed by a dump to the $0.12-$0.13 zone.

From the midterm point of view, the picture is similar. Traders should pay attention to the weekly bar’s closure in terms of the $0.1411 level.
Related
As the volume remains low, none of the sides has accumulated enough energy for a sharp move. In this case, consolidation in the range of $0.14-$0.16 is the most likely scenario.
DOGE is trading at $0.1469 at press time.
Cardano is struggling to maintain the $0.50 mark as bearish pressure mounts, with the potential for a drop to $0.32.
As Bitcoin momentarily dips below the $75,000 mark, Cardano reaches a 24-hour low of $0.51. The ADA token is currently trading at $0.5482, recording an intraday pullback of 4.38% at press time.
The bearish trend in Cardano is testing a long-standing support trendline, raising concerns of a potential breakdown. Will this lead to a nosedive to the $0.32 mark?
Cardano’s price trend on the daily chart reveals a breakdown from a consolidation range. The falling prices are approaching the long-established support trendline.
Following a 12.41% decline on Sunday, Cardano’s bearish trend persists. The ADA price momentarily dipped below the 23.60% Fibonacci level at $0.5346.

Cardano Price ChartDespite the recent surge in selling pressure, Cardano is holding above the $0.50 psychological level as buyers maintain support at this key Fibonacci level. As Cardano witnesses lower price action near the support trendline, price action analysis suggests the possibility of a bullish reversal.
This is based on previous bullish turnarounds in Cardano’s price trend since late 2024. However, due to the ongoing downtrend, the 50-day and 200-day exponential moving averages are on the verge of triggering a death cross event, which would mark a sell signal for price action traders.
Additionally, the True Strength Index (TSI) is at -0.91, indicating a strong bearish trend. This increases the likelihood of a breakdown below the 23.60% Fibonacci level or a minor consolidation around the crucial $0.50 support.
Based on the Fibonacci levels, a quick turnaround with a long-tailed candle from the 23.60% level suggests the possibility of a bullish recovery in Cardano. This short-term recovery could lead to a retest of the 38.20% level at $0.6673, representing an upside potential of nearly 20%.
On the other hand, a daily close below the 23.60% level at $0.5346 would increase the risk of a breakdown below the support trendline. This could expose Cardano to a downside risk of up to 40%, with the $0.32 support level becoming a likely target.
DisClamier: This content is informational and should not be considered financial advice. The views expressed in this article may include the author’s personal opinions and do not reflect The Crypto Basic opinion. Readers are encouraged to do thorough research before making any investment decisions. The Crypto Basic is not responsible for any financial losses.
XRP is currently experiencing a steep selloff, part of a broader downturn affecting the entire cryptocurrency market.
With the total crypto market capitalization shedding hundreds of billions of dollars and major assets like Bitcoin and Ethereum also plummeting, XRP has not been spared—dropping around 8% within 24 hours and touching a low of $1.64.
This decline is not isolated to XRP’s fundamentals but is largely driven by wider macroeconomic and geopolitical tensions. The overall financial market is rattled by a continuation of last week’s bearish momentum, intensified by the fallout from the ongoing tariff disputes and uncertainty surrounding Federal Reserve policy.
Dow and Nasdaq futures are deeply in the red, while headlines warn of recession risks and monetary policy standoffs. Despite the negative sentiment, this downturn is being interpreted by some long-term holders as an opportunity.
With the belief that the crypto market will recover and expand in the coming years, some investors are choosing to double down—buying more $XRP at lower prices to reduce their average cost per unit through dollar-cost averaging (DCA).
The current fear-driven selloff, though unsettling, is not being attributed to any fundamental flaw in XRP itself but to the broader stress seen across all markets.
Source – Austin Hilton on YouTube
At the time of writing, $XRP is valued at $1.87, with a market cap of $109 billion and a 24-hour trading volume of $15.7 billion. Currently, XRP has managed to reclaim the critical $1.75 support level, which is considered crucial for any potential upward movement.
If this level holds, XRP could likely test the $2 mark in the near future. However, if it fails to maintain this support, a drop back to the weekly low at $1.66 is expected, with a further decline being a possibility.
There’s speculation that $XRP could potentially fall below the $1 mark, a move that would undoubtedly stir emotions in the XRP community. Yet for committed investors, such a drop is seen as a buying opportunity rather than a cause for panic.
$XRP’s short-term outlook is closely linked to Bitcoin’s performance, with price swings likely in either direction. Still, accumulating during bearish phases could lead to strong gains once the market recovers.
Although the timing of a market reversal remains uncertain—no one can say for sure when the turbulence will ease—historical market cycles suggest that the crypto sector has consistently recovered from downturns in the past.
While short-term traders may follow sell signals and technical indicators to protect capital, long-term holders maintain a different strategy, focusing on the bigger picture.
The recent price action, though alarming, is part of a much larger narrative of market rebalancing, geopolitical posturing, and global economic realignment. In the end, conviction and patience are what separate speculators from strategic investors.

 Price Prediction & Analysis: Is a 50% Crash Coming?")
