The main tag of cryptocurrency price today Articles.
You can use the search box below to find what you need.
[wd_asp id=1]
The main tag of cryptocurrency price today Articles.
You can use the search box below to find what you need.
[wd_asp id=1]
A notable market watcher has shared what he believes is evidence that XRP might have already reached its bottom.
The analysis comes on the back of the ongoing XRP price decline that has persisted since February 2025. This downturn has been as a result of a broader market crash on the back of macroeconomic uncertainties and a bloodbath in the U.S. stock market.
Now, amid the pullback, analyst Steph (@Steph_iscrypto) has identified what he believes is evidence that XRP might not see lower prices again.
Particularly, the analyst called attention to a bullish divergence on the daily XRP chart, which occurred between Feb. 28 and March 11.
For the uninitiated, a bullish divergence occurs when an asset sees lower lows while a momentum indicator, like the RSI, observes higher lows. This phenomenon suggests that the selling pressure is now weakening and a reversal could pop up soon.
Data from Steph’s chart confirms that XRP dropped to a low of $1.94 on Feb. 28. The asset recovered days later on the back of President Donald Trump’s strategic reserve announcement but corrected again to form a lower low of $1.89 on March 11.

Interestingly, during this period, the Relative Strength Index (RSI) saw a diverging performance. For context, when XRP dropped to $1.94 on Feb. 28, the RSI slumped to 32.72. However, during the collapse to $1.89 on March 11, the indicator saw a higher low of 43.34.
According to Steph, the bullish divergence could indicate that XRP has already bottomed in the ongoing correction. Notably, while this might not translate to an imminent explosive run in the short-term, it could confirm that the asset may not go lower than the $1.89 floor from March 11.
Steph highlighted XRP’s historical performance as a guide. He pointed out that during the 2022 bear market, XRP observed a similar pattern. Notably, market data confirms that XRP saw a similar bullish divergence in June 2022, hitting a lower low of $0.28, while the RSI saw higher lows.
While it took XRP months before it witnessed an explosive surge due to the bear market at the time, its price never went lower than the $0.28 bottom during the market rout. Steph predicts a similar trend for the $1.89 low in the ongoing correction.
Meanwhile, leveraging a separate chart, Steph also noted that XRP could actually be on track to reach a lofty $30 price. He identified a double bottom formation on the monthly chart, which indicates the likelihood of an imminent XRP upward push.
For context, the first bottom formed when XRP dropped to a low of $0.1140 in March 2020, while the second bottom formed at $0.2870 in June 2022. Meanwhile, the neckline of the structure rests at the April 2021 high of $1.96 (around $2).

XRP broke above the neckline in December 2024 and maintained the breakthrough in January 2025. However, the ongoing correction has triggered a retest of the breakout. The asset needs to hold above the neckline at $2 to sustain the breakout. If it maintains this, Steph insists the $30 target could come into play.
DisClamier: This content is informational and should not be considered financial advice. The views expressed in this article may include the author’s personal opinions and do not reflect The Crypto Basic opinion. Readers are encouraged to do thorough research before making any investment decisions. The Crypto Basic is not responsible for any financial losses.
Proportional growth analysis has hinted at Dogecoin price in the scenario where Bitcoin attains a $10 trillion market cap.
Bitcoin, Dogecoin, and the broader crypto market are recovering after several episodes of a market downturn this week. Bitcoin is up 2.55% at press time, trading at $84,100. At the same time, Dogecoin has gained 2.68%, trading at $0.1726.
Dogecoin continues to mirror Bitcoin’s price movements during both bullish runs and bearish downturns. Data from the market intelligence platform IntoTheBlock shows that Dogecoin has a 96% correlation with Bitcoin.
This close correlation suggests that the meme coin has a good chance of following Bitcoin’s path to higher levels. Analysts have high projections for Bitcoin, with industry pundits like Michael Saylor arguing for a multi-trillion-dollar market cap for Bitcoin in the near future.
In light of this, The Crypto Basic explores the potential price of Dogecoin in a scenario where Bitcoin’s market cap reaches $10 trillion.
At press time, Bitcoin’s market cap stands at $1.66 trillion. For Bitcoin to attain a $10 trillion cap, its current valuation must increase by 5X, or 503%. For context, a $10 trillion market cap would imply a unit price of $504,286 for Bitcoin.
Numerous industry commentators have suggested that Bitcoin could eventually reach a $500K valuation. Among them is financial author Robert Kiyosaki, who often bases his bold predictions on economic and political factors.
Likewise, Bitwise CIO Matt Hougan has expressed a similar sentiment. According to him, until Bitcoin hits $500K, it’s not too late to get involved.
With this promising outlook, the global crypto market could exceed a $20 trillion valuation as Bitcoin typically comprises more than half of that market. Notably, the current global crypto market cap is $2.74 trillion.
So, what could the valuation of Dogecoin in a $10 trillion altcoin market be?
Estimating Dogecoin’s price when Bitcoin reaches $10 trillion is challenging. However, given their close correlation, one can rely on proportional growth analysis to estimate DOGE’s price.
In other words, since Bitcoin would need a 503% surge to reach a $10 trillion market cap, assuming Dogecoin grows at a similar rate, a 5X growth from its current level of $0.176 would send DOGE to $1.06. This would imply a market cap of $157 billion for Dogecoin, compared to its current market cap of $25 billion.
Meanwhile, popular projections within the crypto industry suggest that Dogecoin could reach $1 this year. On the other hand, industry experts expect Bitcoin to take a few more years to approach the $500K mark.
This suggests that many expect Dogecoin to reach $1 much sooner than Bitcoin reaching $500K. Essentially, Dogecoin’s price could exceed $1 when Bitcoin hits $500K with a $10 trillion market cap.
Historically, Dogecoin tends to outperform Bitcoin during bull runs. Given that Dogecoin’s market cap is in the billions, it has more room for faster growth than Bitcoin, which is already in the trillion-dollar threshold.
Telegraph analysts expect Bitcoin to reach $500K by 2029. During this same period, they predict DOGE will be priced at $13.
DisClamier: This content is informational and should not be considered financial advice. The views expressed in this article may include the author’s personal opinions and do not reflect The Crypto Basic opinion. Readers are encouraged to do thorough research before making any investment decisions. The Crypto Basic is not responsible for any financial losses.
XRP price rebounded above $2.42 on Friday, marking a 28% recovery from the weekly timeframe low of $1.90. The rally was fueled by the U.S. Securities and Exchange Commission’s (SEC) kicking off settlement talks with Ripple, and speculations the Blackrock could launch altcoin derivatives products.
How high can XRP price reach if altcoin exchange-traded fund (ETF) are approved this year?
XRP rebounded 5% to reclaim the $2.30 support level amid reports that the SEC may classify it as a commodity in ongoing settlement discussions with Ripple Labs. This potential regulatory milestone could eliminate legal uncertainties and encourage broader institutional participation.
Receent market reports show that SEC officials are evaluating whether XRP should be treated similarly to Bitcoin and Ethereum, both of which fall under commodity regulations. If XRP secures this classification, it could significantly enhance the chances of an XRP ETF approval.
Ripple (XRP) Price Action, March 14
Market analysts suggest that an official SEC statement confirming XRP’s commodity status could serve as a catalyst for a price rally. In the past, similar speculation drove XRP from $0.90 to $3.10 in under two months. This suggests XRP could potentially attempt another retest of the $3 level if the altcoin ETFs are approved.
Beyond the ongoing speculations surrounding ETF approvals, fresh discussions have emerged suggesting that BlackRock may launch ETFs for XRP and Solana. Nate Geraci, Co-Founder of The ETF Institute, has fueled this speculation with his bold prediction:
“I’m ready to log formal prediction… BlackRock will file for both Solana & XRP ETFs. Solana could be any day.
Think XRP once SEC lawsuit. BlackRock is currently the leader by assets in both Bitcoin & Ether ETFs… I simply don’t see them allowing competitors to come in & launch ETFs on 2 of the top 5 non-stablecoin crypto assets without any sort of fight. I also believe BlackRock will file for crypto index ETFs btw.”
– Nate Geraci, March 15, 2025
At press time, BlackRock currently holds over 567,000 Bitcoin valued at over $47.8 billion—outpacing MicroStrategy’s 499,096 BTC holdings, within 15 months of inception.
This speculation that BlackRock could launch altcoin ETFs further enhances XRP’s appeal to strategic investors looking to buy in early, ahead of potential institutional inflows.
The timeline for an XRP ETF approval depends on ongoing regulatory developments. The SEC is currently reviewing multiple crypto ETF applications, including those for Ethereum and XRP, as institutional demand for diversified digital asset exposure grows.
Industry experts anticipate that an XRP ETF could gain approval in late Q3 or early Q4 of 2025, contingent on the resolution of Ripple’s legal battle.
If Ripple successfully negotiates a settlement and XRP attains commodity status, the path to ETF approval would become significantly clearer.
The approval of spot Bitcoin ETFs in January 2024 triggered significant institutional inflows, driving BTC to new all-time highs.
A similar scenario could play out for XRP, with analysts forecasting that an XRP ETF could attract over $5 billion in inflows within its initial months.
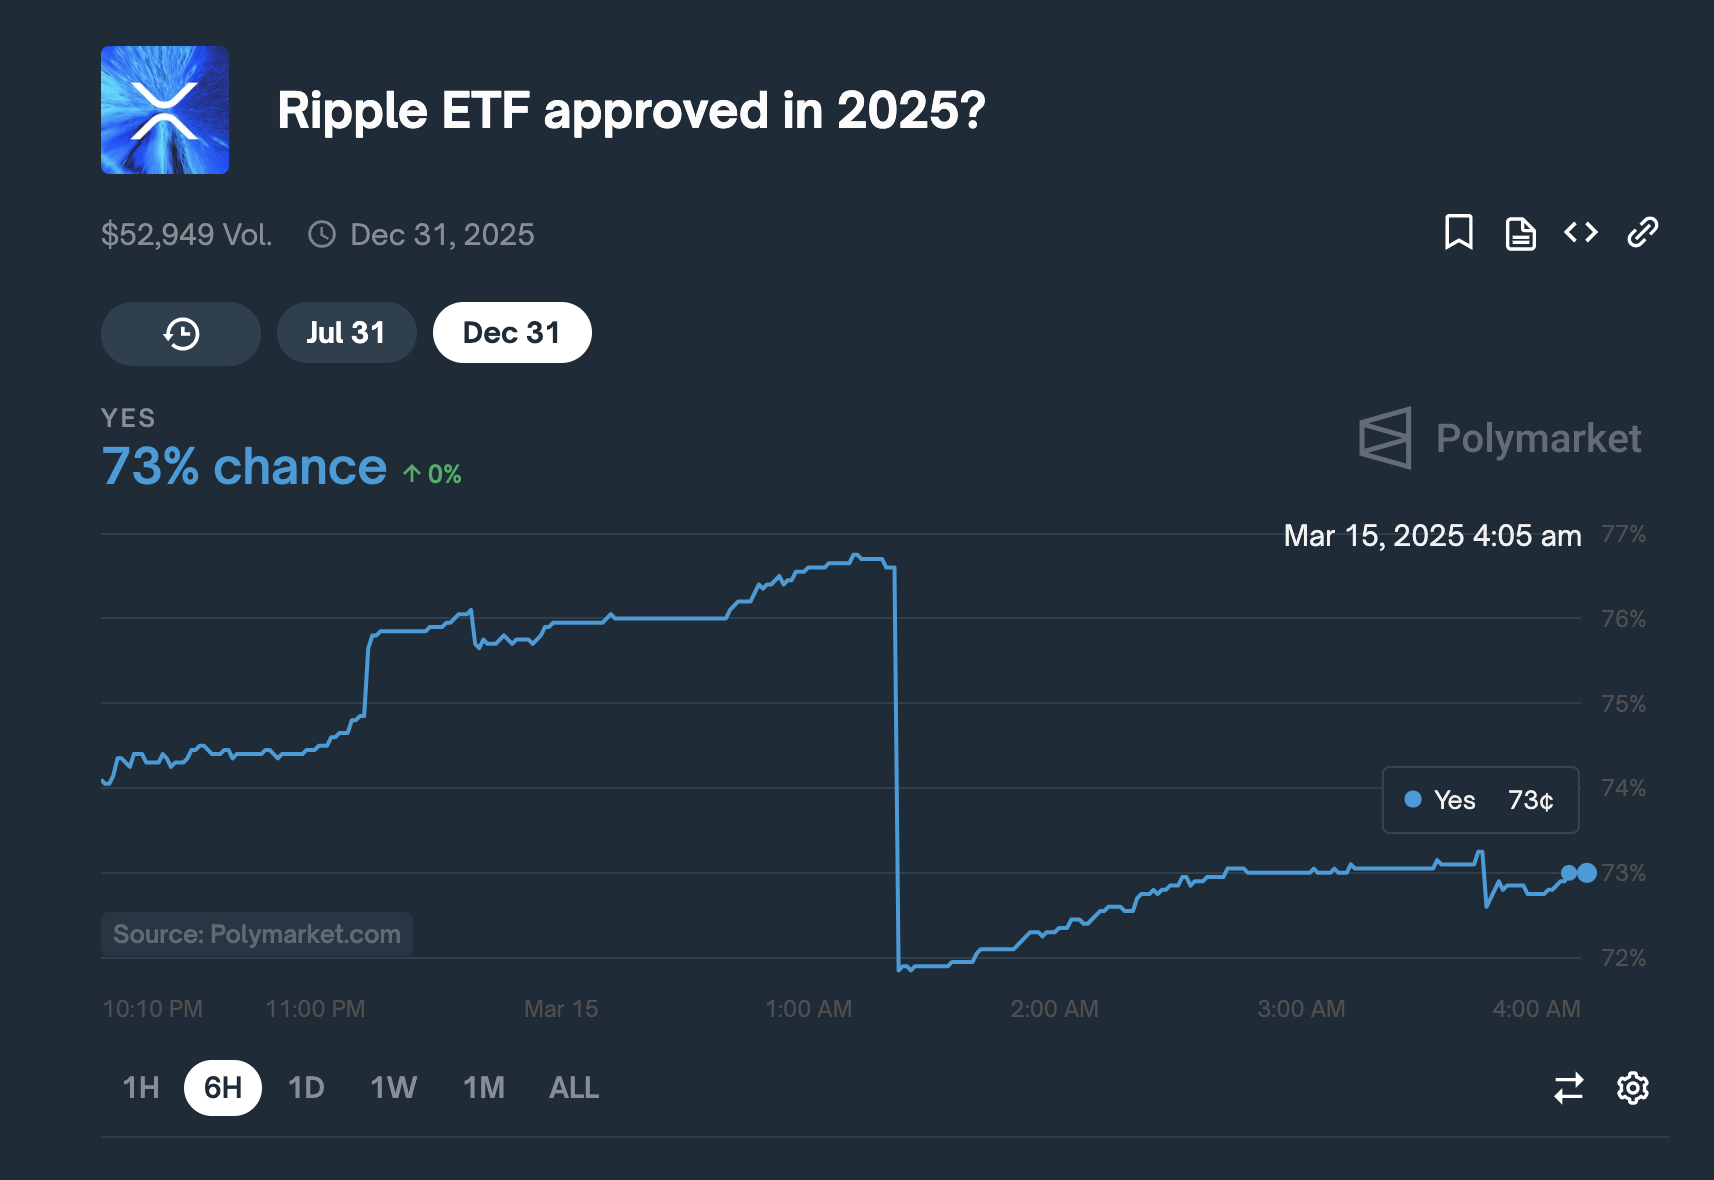 XRP ETF approval odds, March 15 2025 | Source: Polymarket
As institutional interest and regulatory momentum build, XRP remains a leading contender for ETF approval. Key upcoming catalysts include further court rulings in the Ripple vs. SEC case and statements from SEC officials as well as references to Ethereum and Bitcoin’s regulatory status.
More so, the Gary Gensler’s recent depature, and other key crypto-friendly cabinet appointments have resulted in the rollback of several several sanctions in recent weeks.
Notably the likes of Coinbase, Robinhood, Ripple (XRP), and Uniswap have all had notable charges filed by the previous SEC administration.
All of these factors, combined with reports that SEC is leaning towards decaling XRP a commodity, have triggered a increase in the probability of multiple altcoin ETF approvals this year.
According to Polymarket data, traders currently assign a 73% probability to XRP ETF approval before December 31, 2025. Similar probabilities apply to other altcoins with pending ETF applications.
At press time, XRP is consolidating above $2.40 with a market capitalization of $140 billion, down from its recent high of $3.10.
For Ripple to reach a $200 billion valuation, XRP would need to surpass $3.40—a level that may be attainable if ETF approvals materialize and institutional demand matches up to levels seen when Bitcoin derivatives were approved in early 2024.
XRP price is rebounding from recent lows, currently trading around $2.42, as bullish momentum gains traction.
After booking nearly 28% gains over the past four days, insights from technical indicators suggest more upside ahead.
The Donchian Channel (DC) upper band at $2.99 remains the primary resistance level, while the mid-band at $2.44 is acting as a short-term pivot point.
A decisive break above this level could trigger further upside toward the $2.60-$2.80 range.
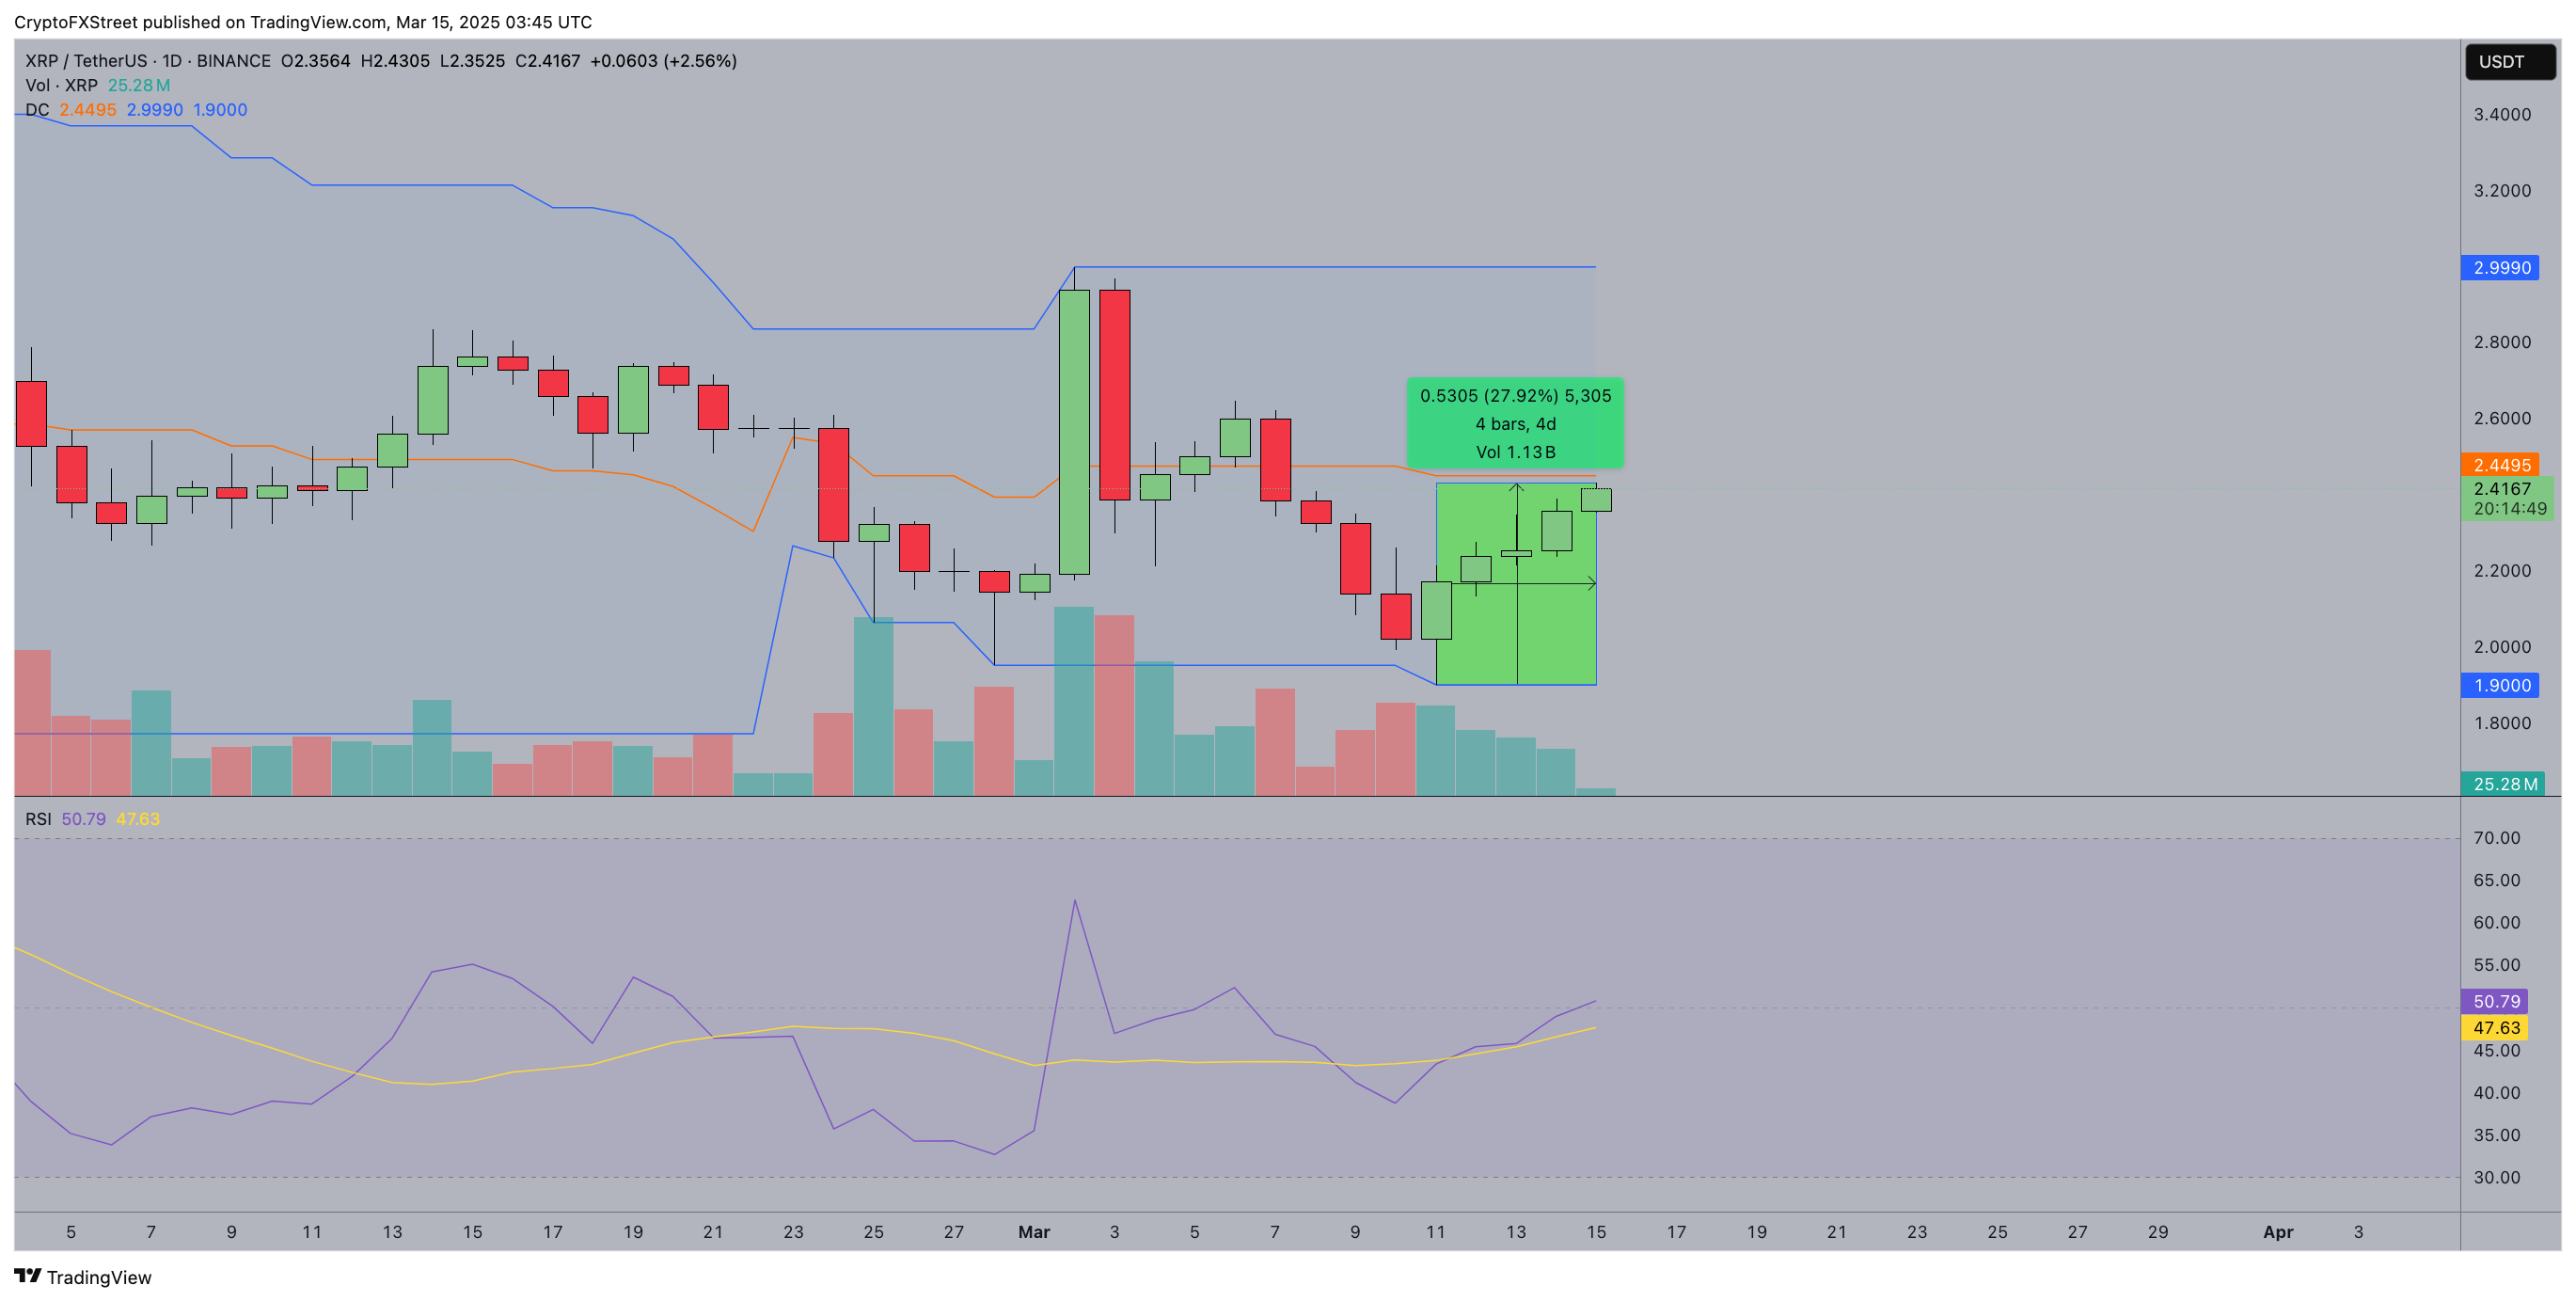
XRP Price Forecast | XRPUSD
The Relative Strength Index (RSI) has climbed to 50.89, crossing above the signal line at 47.64, suggesting strengthening bullish momentum.
This shift in RSI structure aligns with the increase in trading volume, which has exceeded 1.13 billion, reflecting growing investor interest.
If RSI continues to rise toward the 55-60 zone, it could confirm sustained buying pressure, pushing XRP towards the $2.99 resistance.
On the bearish side, failure to hold the $2.30 support could invalidate the current recovery, exposing XRP to a potential pullback toward $1.90.
However, with volume increasing and RSI reclaiming neutral territory, the bias leans bullish.
If price action sustains above $2.44, XRP could extend its rally toward $2.80, with a breakout above $2.99 opening the door for a retest of $3.40, which could effectively catapult Ripple’s valuation above the $200 billion milestone
Legendary trader John Bollinger has suggested that the Ripple-linked XRP cryptocurrency could become a new market leader in his recent social media post.
Using a vivid metaphor sourced from Green mythology, Bollinger has noted that the major altcoin has “resisted the recent signing of the Siren’s best song.”
This is the first time that Bollinger has weighed in on XRP’s price action in years. Back in 2018, he said that he did not know enough about the token to have an opinion about its future.
Last month, the prominent chartist, who is primarily known for inventing the widely used Bollinger Bands indicator, also rejected the idea that Bitcoin (BTC) was in a bear market.
XRP has managed to show much more resilience during the recent cryptocurrency market downturn. On Thursday, it added 0.58% while Bitcoin, the bellwether cryptocurrency, plunged by more than 4%.
The Ripple-affiliated token is now up by more than 16% over the past four days.
The recent surge has been driven by the buzz surrounding Franklin Templeton’s XRP ETF filing. The $1.5 trillion investment titan has joined the likes of Bitwise, 21Shares, and WisdomTree in the race to launch such a product in the U.S.
It has also been reported that the legal battle between Ripple and the SEC is wrapping up. The company is apparently attempting to negotiate more favorable terms after being fined $125 million last year. Meanwhile, the SEC is trying to determine the legal status of the XRP token.
Despite ongoing sellers’ pressure, some coins are in the green zone, according to CoinStats.CoinStats”>
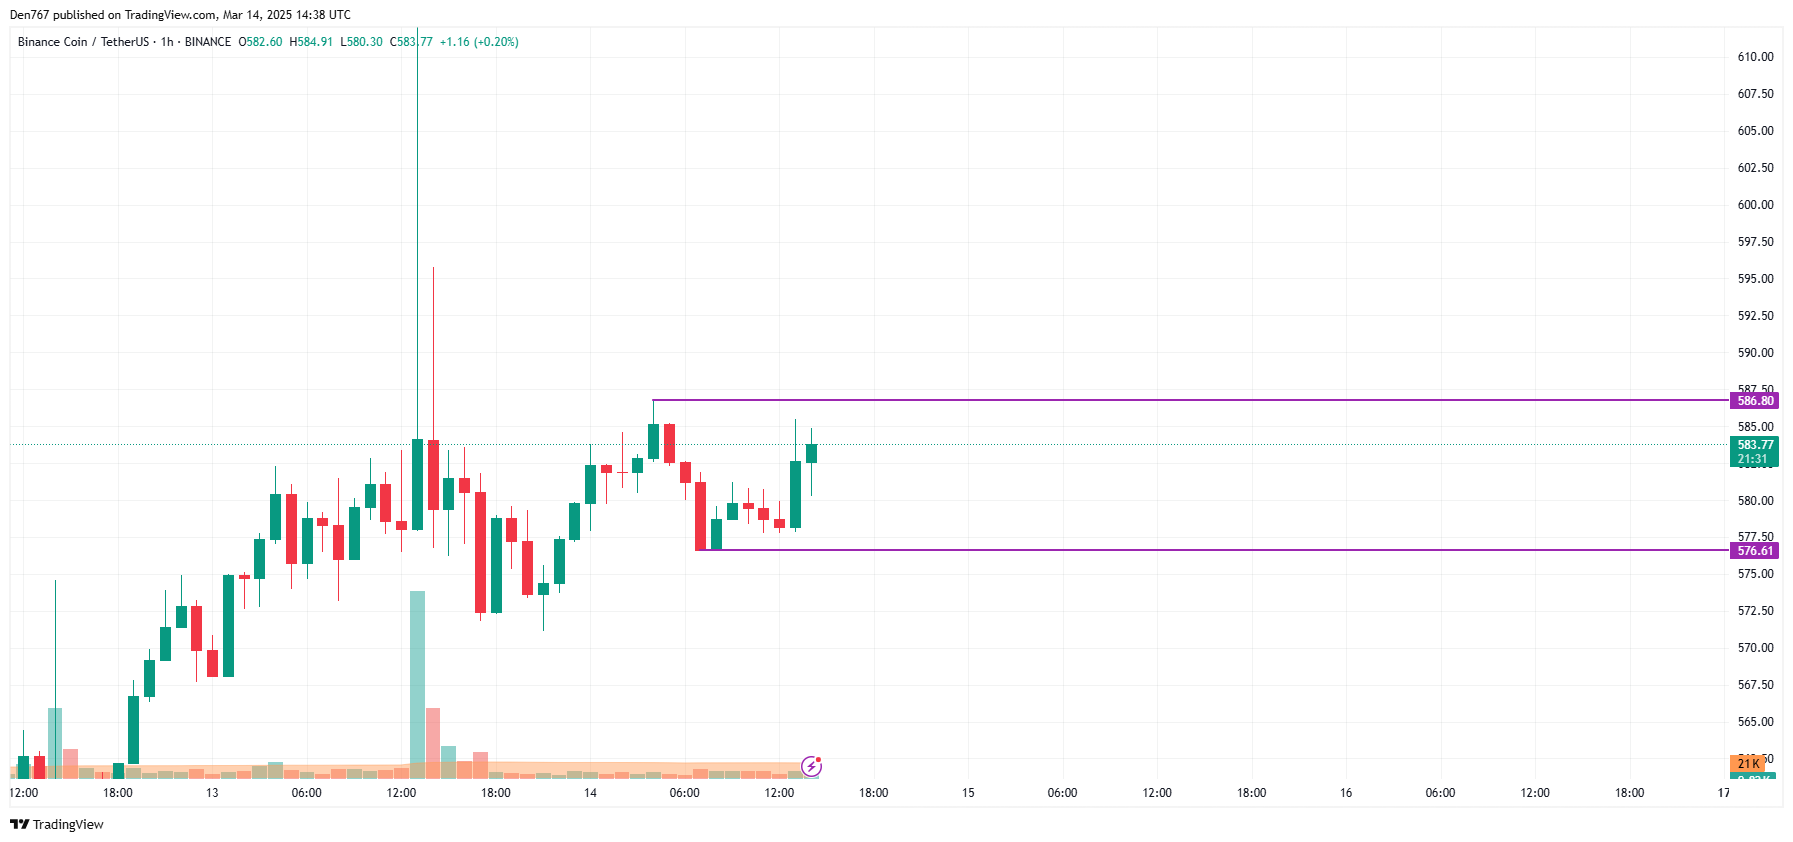
The price of Binance Coin (BNB) has dropped by 0.26% since yesterday.TradingView”>
On the hourly chart, the rate of BNB is trading within a narrow range, between the support of $576.61 and the resistance of $586.80.
If the daily bar closes near the upper level, the accumulated energy might be enough for a test of the $600 area.TradingView”>
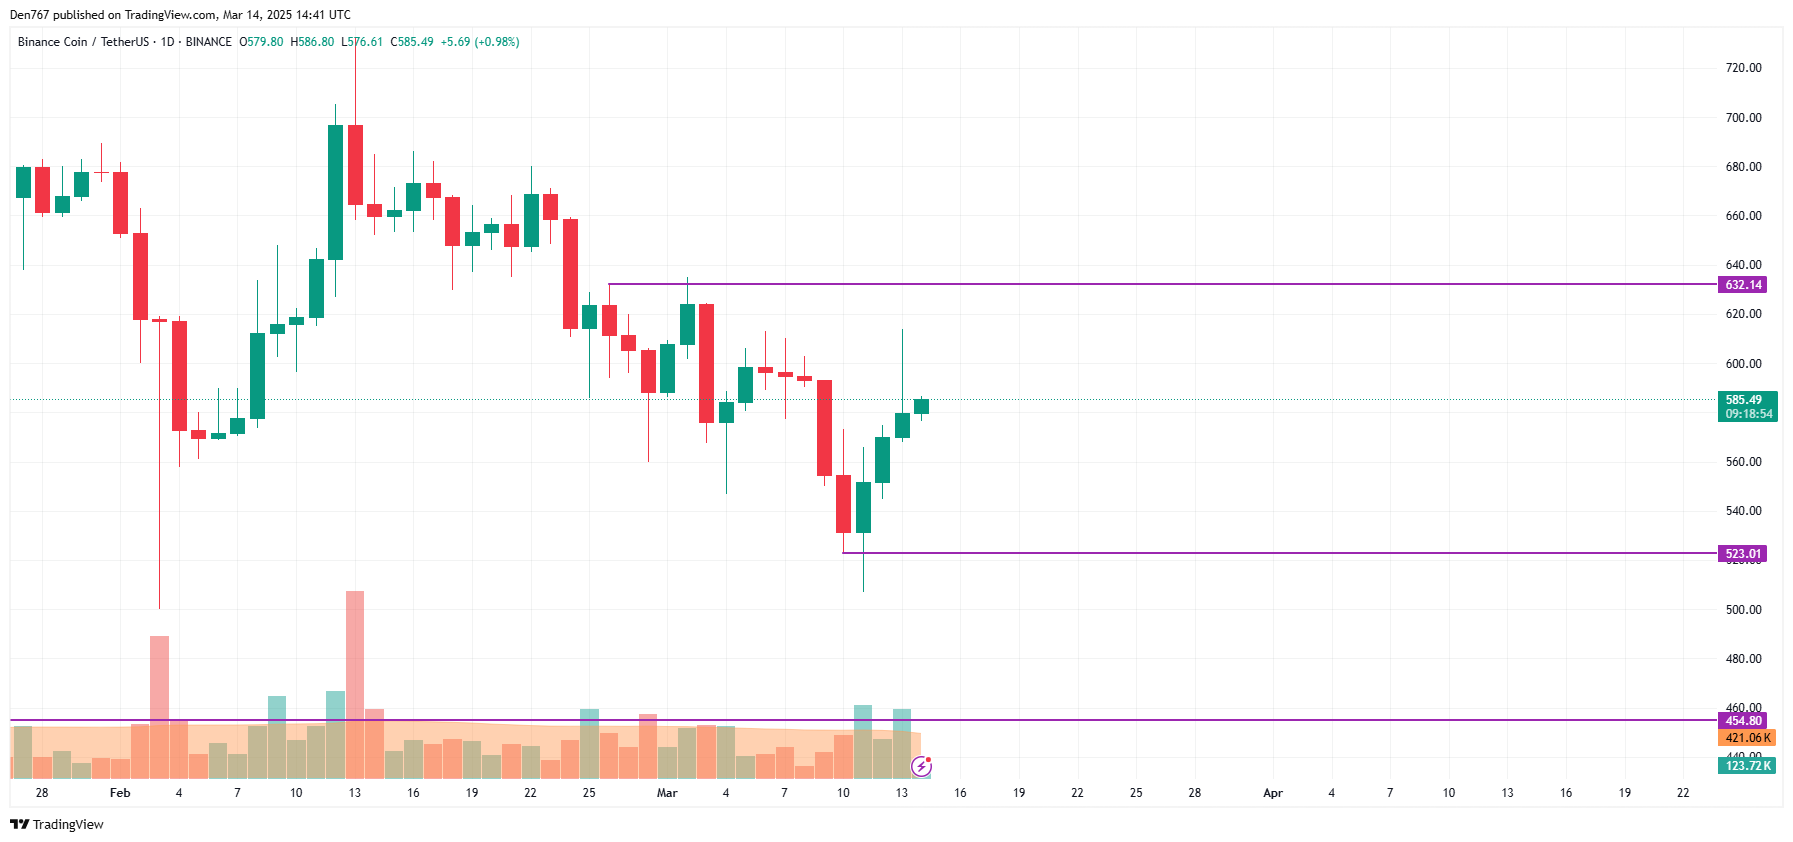
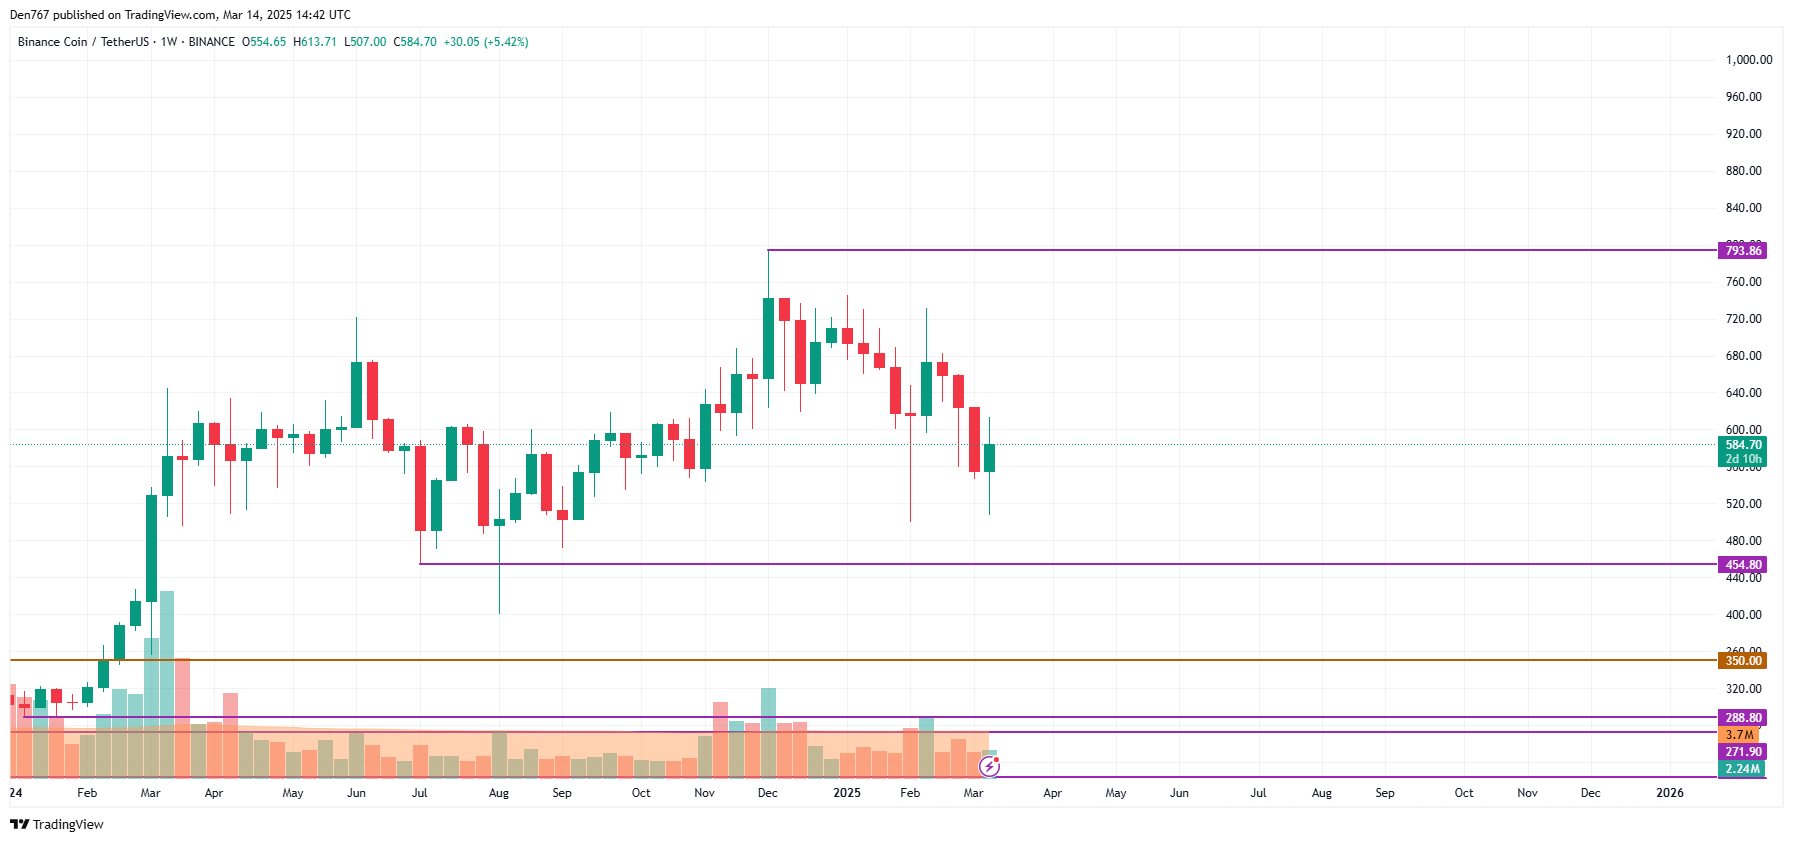
On the bigger time frame, the price of the native exchange coin is far from key levels. As none of the sides is dominating, ongoing sideways trading in the zone of $570-$600 is the most likely scenario.TradingView”>
From the midterm point of view, the picture is similar. If the weekly candle closes around current prices, traders are unlikely to witness sharp moves by the end of this month.
BNB is trading at $583.41 at press time.
Bears continue their pressure after a slight bounce back, according to CoinMarketCap. CoinMarketCap”>
The rate of Cardano ![]() ADAUSD has declined by almost 1% over the last day.TradingView”>
ADAUSD has declined by almost 1% over the last day.TradingView”>
On the hourly chart, the price of ADA might have set a local resistance of $0.7299. If the daily bar closes around that mark or above it, growth is likely to continue to the $0.74 range.TradingView”>
On the bigger time frame, the rate of ADA is within yesterday’s daily bar, which means none of the sides has seized the initiative yet.
Thus, the volume keeps falling, which means sideways trading in the range of $0.70-$0.75 is the more likely scenario.TradingView”>
From the midterm point of view, the situation is neutral. The rate is far from main levels, confirming the absence of buyers’ and sellers’ energy. All in all, consolidation around the current prices is the most likely scenario.
ADA is trading at $0.7210 at press time.
The XRP market has been buzzing with new price predictions as analysts forecast a significant price surge in the coming months.
While XRP has struggled to break free from its bearish trend, experts are increasingly optimistic about its performance, pointing to an impending “cycle top” as a potential catalyst for a major rally in XRP price.
As XRP holds steady above the $2 mark, investors and analysts are closely monitoring key resistance levels, particularly around $2.20. This level is seen as a critical threshold to determine whether XRP can escape its current stagnation.
XRP price is holding above the $2.25 support following a fresh bullish momentum. Source: JolieJan on TradingView
On March 11, XRP briefly dipped to $1.89 before reclaiming the $2 threshold. However, investor sentiment remains cautious, as broader market conditions continue to weigh heavily on cryptocurrency prices.
Despite these fluctuations, many still believe that XRP has the potential for significant growth in the near future, especially as some analysts predict that the token could surge beyond its current price levels. As the XRP price moves in tandem with overall market trends, its future performance remains closely tied to ongoing developments in both the crypto space and the ongoing XRP lawsuit with the SEC.
Renowned cryptocurrency analyst EGRAG Crypto has been one of the most prominent voices in XRP’s price prediction. EGRAG recently updated his long-term price model, which now follows a historical pattern known as “Cycle A,” which dates back to the 2014-2018 period. This adjustment suggests that XRP’s price could continue to rise into late 2025, with the cycle potentially peaking in September 2025.

Analyst expects a major price peak for XRP by May 2025, shifting from the previous prediction based on Cycle ‘B’ to Cycle ‘A’ for a new forecast. Source: EGRAG Crypto via X
EGRAG previously speculated that XRP could reach up to $27 at the peak of the cycle. His revised projection sees the token possibly reaching its all-time high (ATH) later than expected, offering an extended period for potential gains. “If Cycle A plays out, we could see the peak in September 2025,” EGRAG stated. His outlook aligns with the broader view that XRP news will continue to drive price momentum as the market evolves.
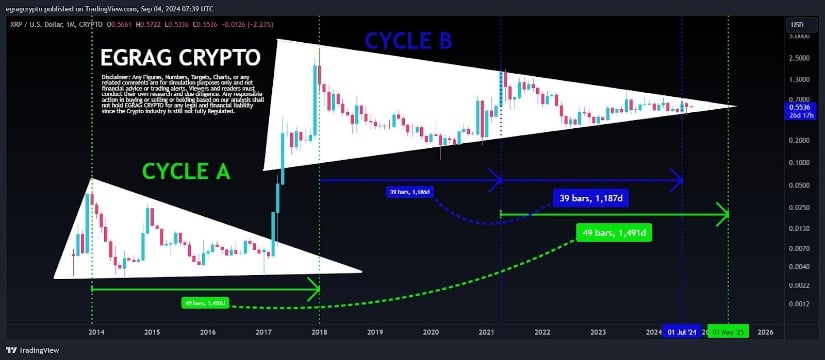
Analysts now predict XRP’s price surge could peak in May 2025, following the historical pattern of Cycle ‘A,’ replacing the previously anticipated Cycle ‘B. Source: EGRAG Crypto via X
Despite the optimistic long-term outlook, XRP has short-term challenges. Dom, a well-known crypto analyst, has indicated that unless XRP remains supported above $2.20, it could drop back to lower levels, as low as $1.60. The token’s price has been weighed down by XRP SEC updates and overall market uncertainty, and most investors are holding in the uncertainty.
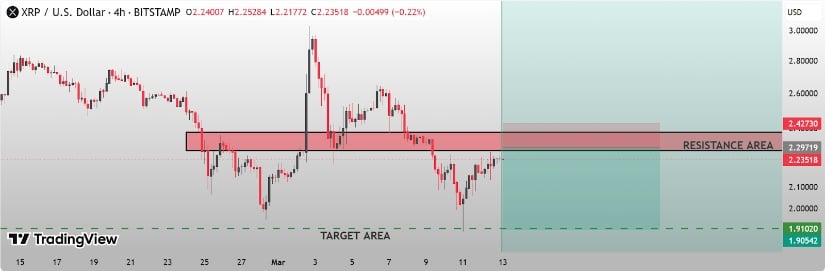
XRP price must break through the immediate resistance around $2.29 to continue its upward rally. Source: Soam_Pro_Trader on TradingView
Technical analysis also shows the potential for further declines. MMBTrader, a TradingView analyst, accurately predicted XRP’s decline to below $2 and now is forecasting a potential crash to $1.50. The reason behind this prediction is the formation of a “Head and Shoulders” pattern on the daily chart, a common indication of a bearish reversal. Still, MMBTrader also offers a counter-argument that if XRP can find support close to $2, a powerful rally could propel the cryptocurrency toward $4 or even $5.
Even amid such turbulent market patterns, whales have been increasingly engaged in the XRP market, buying enormous volumes of XRP tokens. As recently as this week, one whale acquired 167 million XRP tokens at a cost of approximately $368 million when the market fell. Such huge trades signal a ballooning optimism regarding the long-term prospects of XRP, especially with Ripple crypto continuing to attract institutional investors’ interest.
Besides, across the short-term volatility, market forces are supporting future price development. With increasing institutions like Ripple Bank of America still strengthening cooperation, Ripple is certainly going towards a dominant position in worldwide payments.
Looking forward, XRP is at a crossroads. While the road ahead is fraught with volatility, both short-term risks and long-term opportunities are shaping its future. With exchange volume increasing and key developments in the ongoing Ripple lawsuit, the digital asset remains one to watch. Analysts are keenly observing support and resistance levels as indicators of whether XRP will break out or face another downturn.
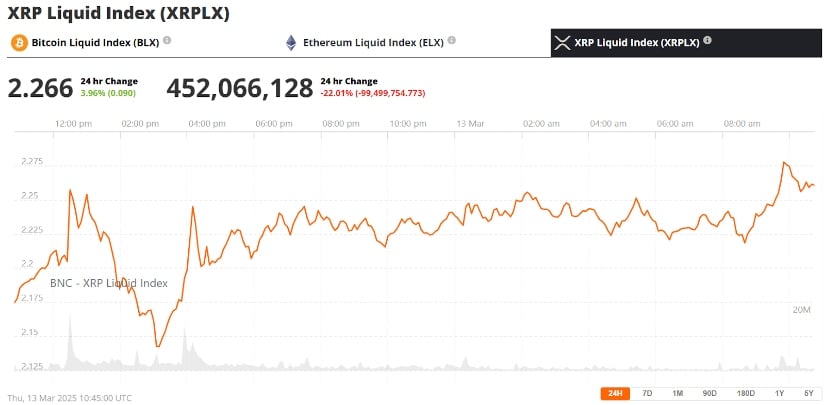
XRP was trading at around $2.26, up 3.96% in the last 24 hours at press time. Source: XRP Liquid Index (XRPLX) via Brave New Coin
EGRAG Crypto’s long-term outlook remains positive, particularly as Ripple price USD could see a significant upside. “It’s a choice to be in the next 1%, or end up like the top 1% who got wrecked. My choice is simple – I’m sticking with this generational trade,” EGRAG noted.
As the XRP price prediction plays out, the coming months will be pivotal. Whether XRP USD can achieve the expected surge, or whether broader market conditions and ongoing litigation hinder progress, remains uncertain. Nonetheless, XRP is positioned to play a crucial role in the future of the cryptocurrency market.
Most of the coins are trying to come back to the green zone, according to CoinStats.
Solana (SOL) is one of the biggest gainers today, rocketing by 4.46%.
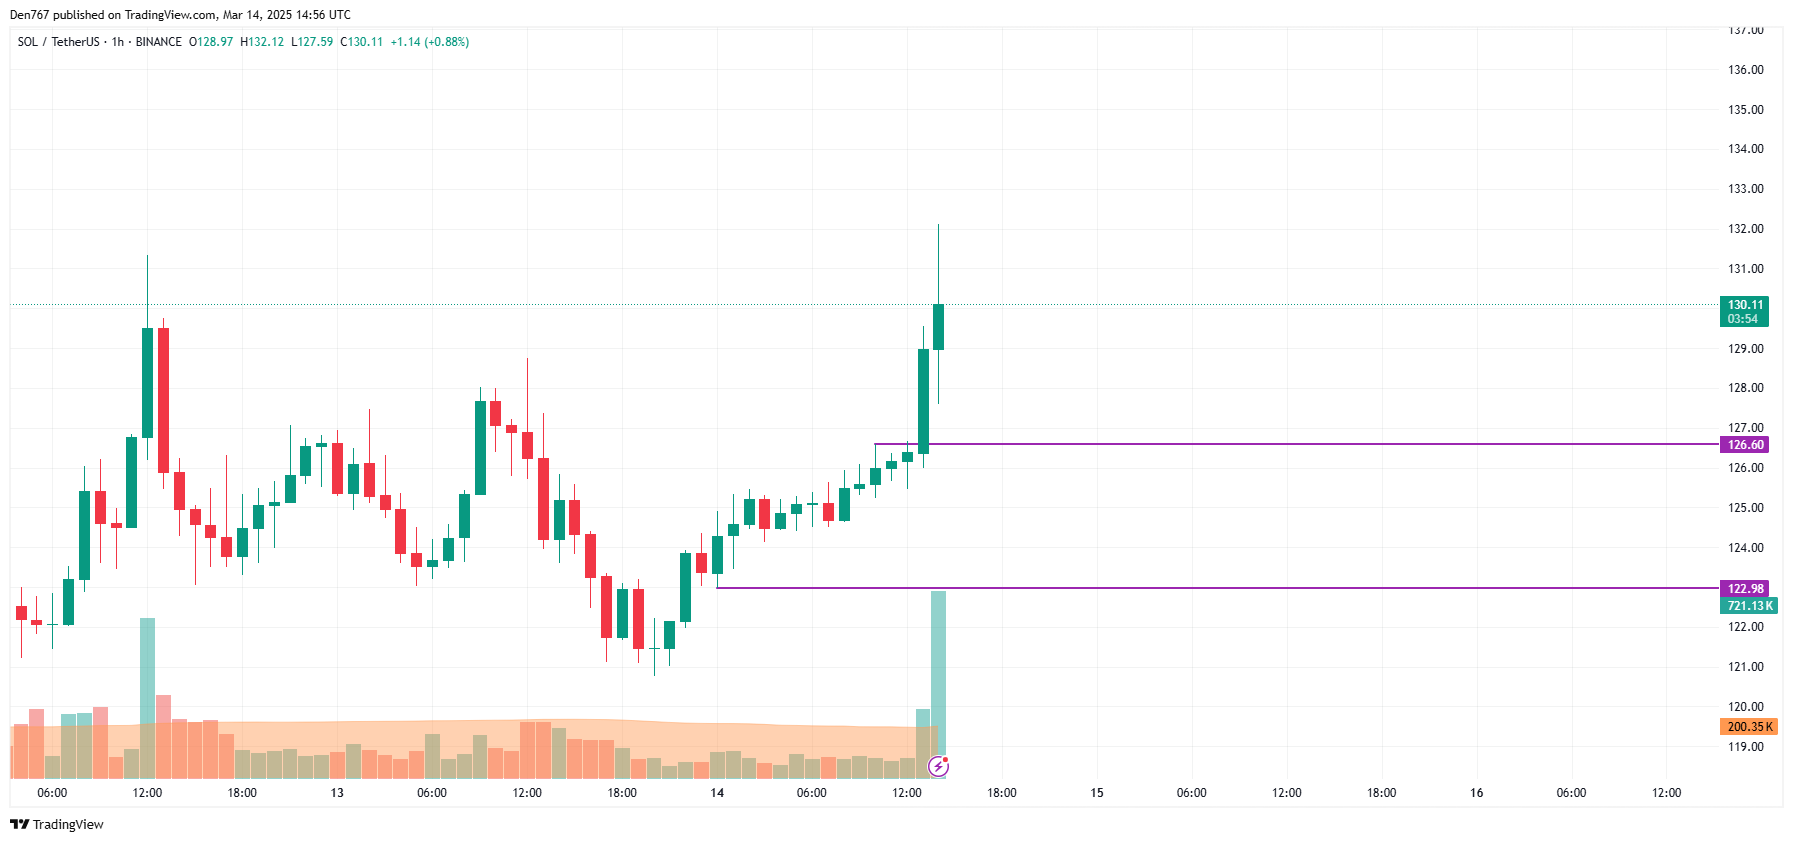
On the hourly chart, the rate of SOL is rising after a breakout of the local resistance of $126.60. If bulls can hold the gained initiative, the upward move is likely to continue to the $135 area.
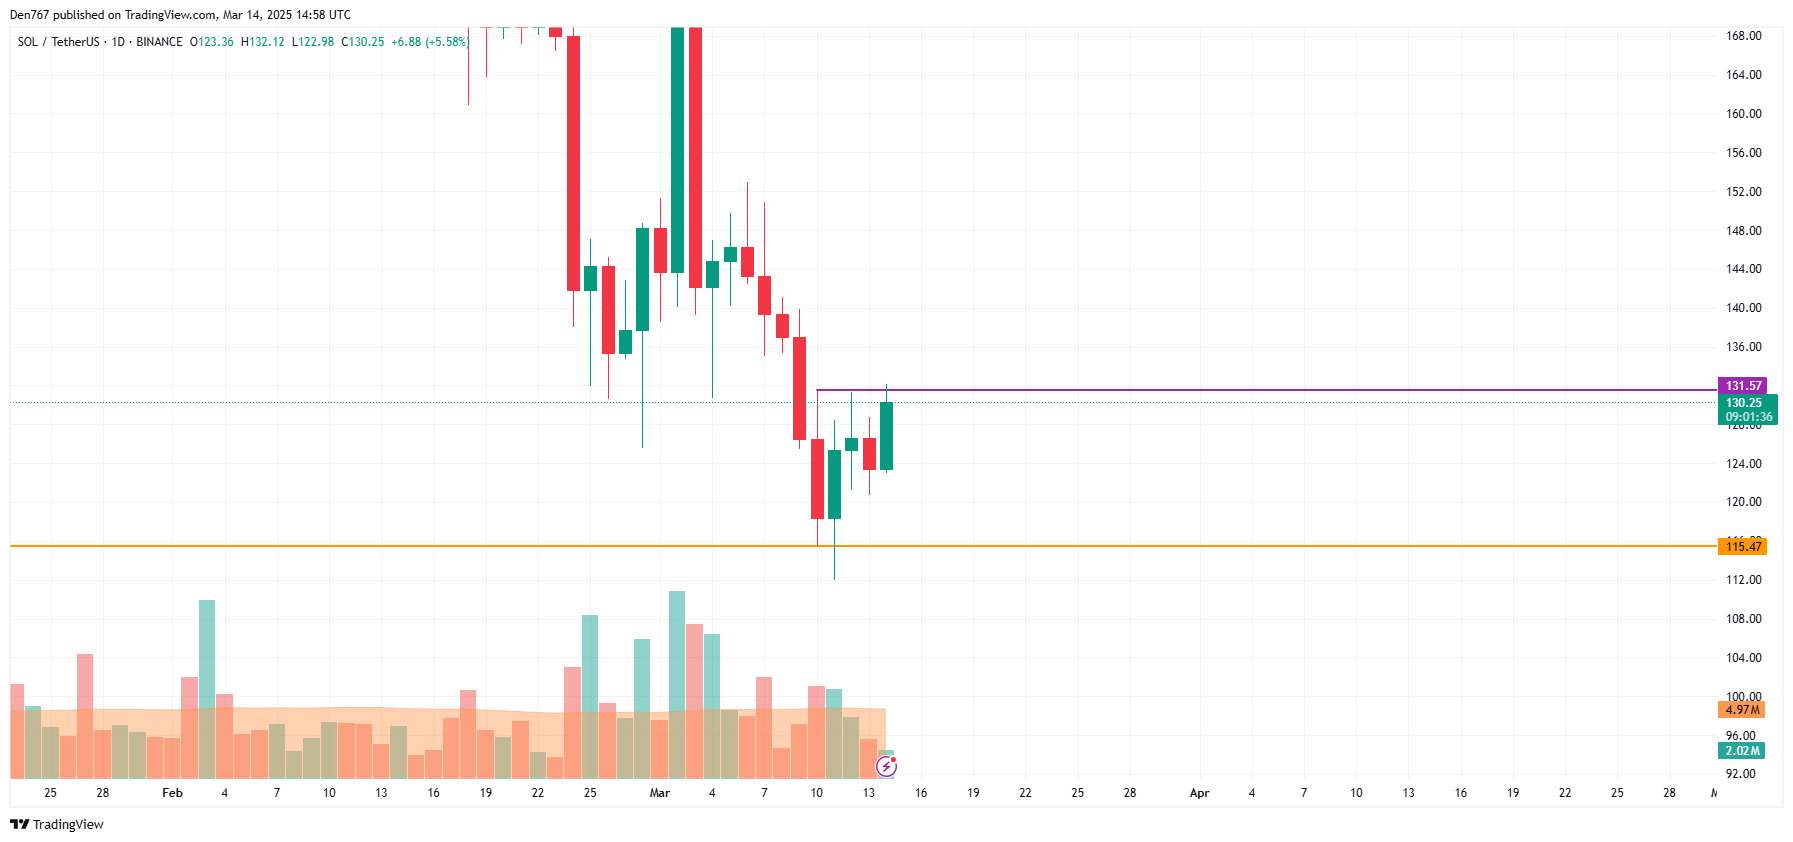
On the bigger time frame, one should focus on the candle’s closure in terms of the $131.57 level. If it happens around it and with no long wick, the accumulated energy might be enough for a move to the $140 range.
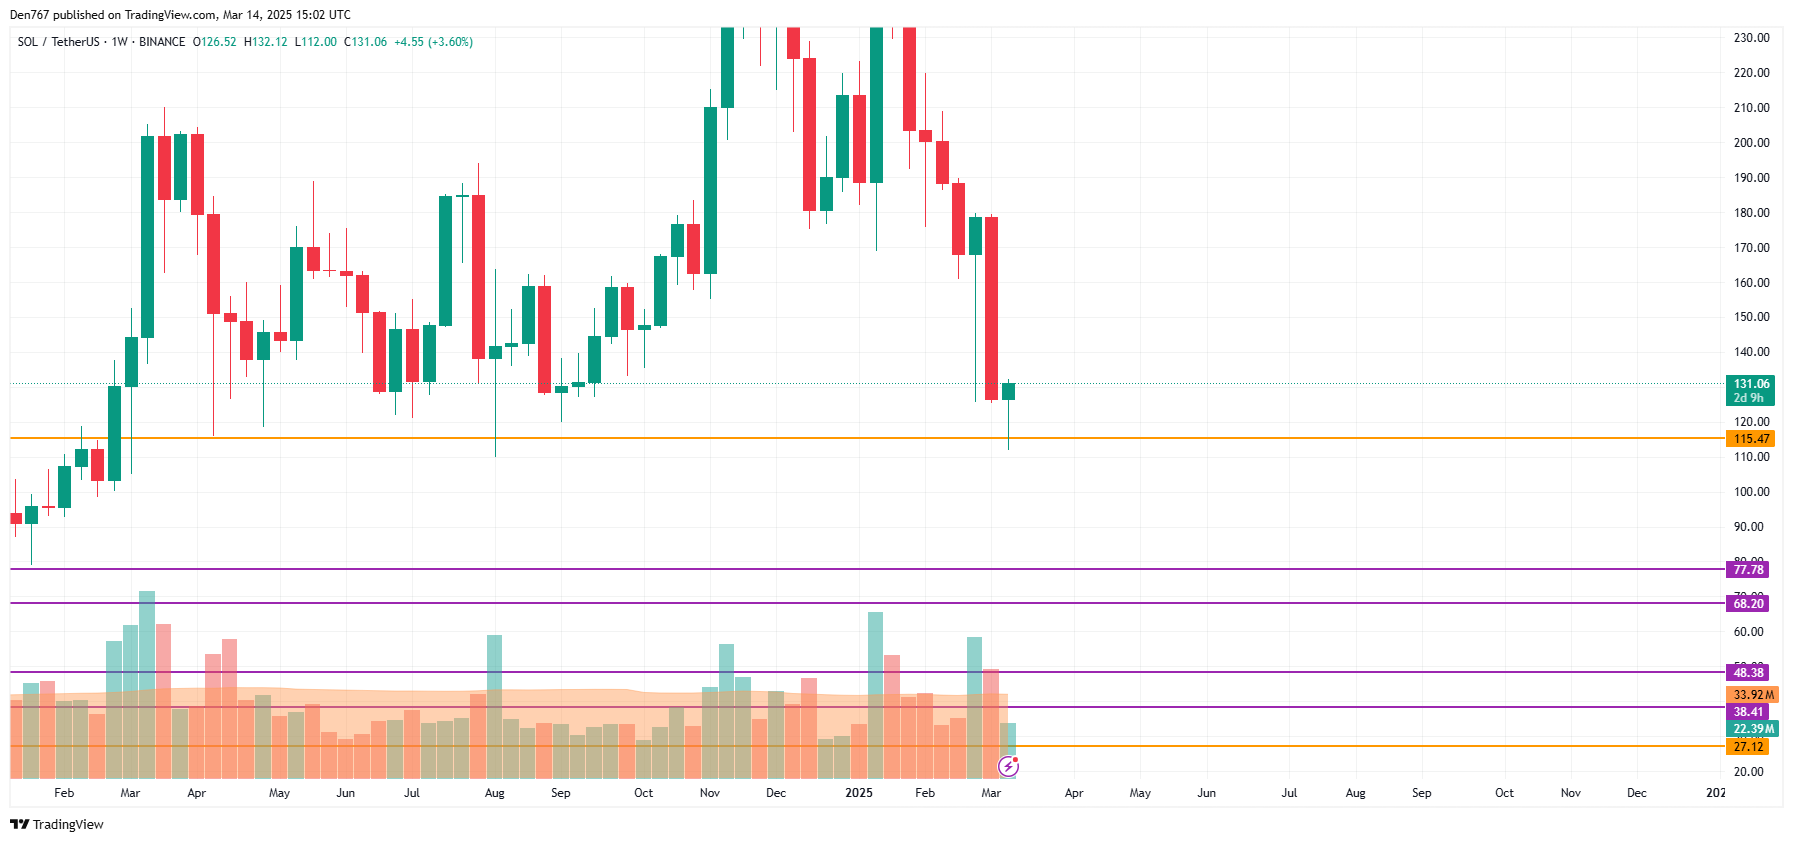
From the midterm point of view, the price of SOL has once again bounced back from the support level of $115.47.
Related

If the bar closes far from that mark, buyers may seize the initiative, which may lead to a move to the $140-$150 zone.
SOL is trading at $132.30 at press time.
Despite ongoing sellers’ pressure, some coins are in the green zone, according to CoinStats.
The price of Binance Coin (BNB) has dropped by 0.26% since yesterday.
On the hourly chart, the rate of BNB is trading within a narrow range, between the support of $576.61 and the resistance of $586.80.
Related
If the daily bar closes near the upper level, the accumulated energy might be enough for a test of the $600 area.
On the bigger time frame, the price of the native exchange coin is far from key levels. As none of the sides is dominating, ongoing sideways trading in the zone of $570-$600 is the most likely scenario.
From the midterm point of view, the picture is similar. If the weekly candle closes around current prices, traders are unlikely to witness sharp moves by the end of this month.
BNB is trading at $583.41 at press time.
Dogecoin could be set to break from the current bearish trend as multiple analyses point to an imminent resistance breakout.
Dogecoin has continued to trend above a crucial support line at $0.16, which analysis described as a defining level for its bull cycle trend. Despite correcting slightly yesterday, the meme coin remains well within the multi-year ascending triangle.
Meanwhile, multiple indicators have flashed bullish sentiments on the Dogecoin chart. Notably, analysts have identified an imminent structural breakout backed by a possible bullish Stochastic RSI crossover.
Particularly, analyst Trader Tardigrade has identified a possible trend reversal on the Dogecoin 4-hour price chart. In a commentary today, he highlighted that the doggy-themed meme coin could reverse recent bearish momentum with a break above the resistance trendline currently impeding the asset’s push to higher prices.
The supply trendline emanated from DOGE’s surge to $0.2427 on March 3 and has resisted several attempts to break out. The analyst inferred that it must break the resistance at $0.17 to target higher prices. Notably, Dogecoin trades very close to the area, signaling an imminent trend reversal.

Moreover, analysis from another market watcher David supports Tardigrade’s perceived bullish momentum. The analyst noted in a recent post that DOGE looks set to break from a falling wedge price pattern forming on the 1D timeframe.
The bullish pattern has been developing since mid-January, getting tighter with the meme coin’s recent price action. Now, David predicts that Dogecoin would soon defy the structure’s upper resistance and break to higher prices.
Meanwhile, a historically bullish indicator for Dogecoin is nearing a crossover, signaling a significant trend shift for the digital asset. Prominent market watcher Ali Martinez uncovered this trend, suggesting an impending haul to bullish momentum for DOGE prices.
He shared that the stochastic relative strength index (RSI) eyes a bullish crossover on the weekly timeframe, a historical precedent for a massive price rally for DOGE. The Crypto Basic reported that the last three times the indicator flipped bullish, the meme coin rallied 88%, 187%, and a staggering 444%.

Additionally, renewed bullish traction on the Dogecoin ecosystem further boosts this sentiment. Data shows that the number of new addresses on the network surged over 100% in the past month, signaling a recovery in on-chain activity on the blockchain.
In the meantime, DOGE trades at $0.1698, up 3% in the past 24 hours.
DisClamier: This content is informational and should not be considered financial advice. The views expressed in this article may include the author’s personal opinions and do not reflect The Crypto Basic opinion. Readers are encouraged to do thorough research before making any investment decisions. The Crypto Basic is not responsible for any financial losses.

