The main tag of cryptocurrency price today Articles.
You can use the search box below to find what you need.
[wd_asp id=1]
The main tag of cryptocurrency price today Articles.
You can use the search box below to find what you need.
[wd_asp id=1]
XRP’s price remains above the recent swing lows, but the recent rally appears to have ended in a corrective pattern. Despite some positive price action, the market has not yet confirmed a breakout. Historically, breakouts from triangle patterns tend to show strong upward movement. However, the rally observed earlier this week did not maintain this momentum. XRP briefly rose from around $2.20 to $2.60, but the necessary breakout has not materialized.
A key support level at $2.39 was identified as critical for maintaining the uptrend. Although the price briefly dipped below this level, it remains relevant. There is a possibility that the price will revisit this support zone, especially if the market moves upward in a corrective structure before retesting it.
The current price action suggests that the triangle pattern (A-B-C-D-E) is still intact. While the price broke above the D-wave high for a short period, it did not hold. For confirmation of the pattern’s completion, a break above $2.72 is required. If the price does not break above this level, the pattern may extend or evolve into a more complex structure.
The broader cryptocurrency market is under downward pressure, largely due to Bitcoin’s recent price movement. XRP has been impacted, but the effect has been mostly on a micro level. No significant support levels have been breached, and the overall market structure remains intact. The key invalidation point for the current triangle pattern is at $1.96—if this level is broken, a major shift in market structure is likely.
While the triangle pattern suggests a potential upward breakout, a more complex structure like a WXY correction could also unfold. In this case, the price may move downward before resuming upward momentum. The failure to form a confirmed low suggests that a reversal has not yet occurred.
Considering the volatility of the market as a whole, Dogecoin’s price performance is still comparatively stable despite a recent 12% decline to trade at about $0.34. DOGE has returned to its 50 EMA, a crucial support level, as a result of the sell-off.
Even though the drop suggests that momentum is waning, the bigger picture suggests that DOGE may still have room to recover. Experts wonder if Elon Musk’s Tesla could save DOGE. DTX Exchange, on the other hand, steals the show with its rapid ascent in the market!
There are conflicting signals in on-chain data. Indicating a decrease in speculative activity, open interest in DOGE futures has fallen by 15.35% to $3.58 billion. But over the past day, the volume of derivatives has increased by 108.98% to $12.07 billion.
As traders respond to Dogecoin price changes, this implies increased market activity. Interestingly, long positions dominated liquidations; in a single day, over $26.98 million was liquidated, indicating traders’ overly optimistic outlook.
On a technical level, Dogecoin’s price is getting close to a turning point. The 100 EMA supports the $0.29 level, which acts as a crucial backup area. Dogecoin price might test $0.23, the 200 EMA, and a long-term support level if it breaks below this. On the upside, a technical and psychological barrier at $0.40 represents resistance.
The next target is close to $0.45, and a breakout above this level might rekindle bullish momentum. Despite recent volatility, DOGE’s community and distinct market position offer hope for a rebound. Historically, the asset’s capacity to draw in retail investors during downturns has served as a hedge against prolonged drops.
The Dogecoin started the day at $0.3863 and continued to slump as the day progressed. Currently, the DOGE token is down by a massive 11% with a bleeding daily chart. The constant dominance of a huge red candle shows that the bears are in charge of the Dogecoin price in this session.
DTX Exchange (DTX) project is planning to transform the trillion-dollar trading industry through a hybrid model and sophisticated blockchain technology. Leveraging Ethereum’s smart contracts, DTX Exchange combines traditional and digital finance under one roof.
DTX allows users to access numerous assets, including stocks, cryptocurrencies, forex, commodities, bonds, and more. With this hybrid trading model, users can easily access a diverse range of assets and, ideally, diversify their portfolios.
Another highlight of the platform is its high-leverage facility, which increases traders’ exposure for potentially increased gains. This tool is a dream come true for traders in the bull market because they can create a significantly large position with little capital.
With a non-custodial wallet, DTX ensures the safety of the users. This wallet provides full ownership to the users, and they can access their funds anytime they want. Additionally, DTX Exchange has been KYC verified by one of the best audit firms, increasing the transparency and credibility of the project.
DTX’s presale success amplifies its appeal among large players and retail investors. Under its presale stages, it has raised a significant amount and is currently priced in its seventh presale stage.
The platform’s transformative approach in the trading sector makes it stand out and positions the token as a strong contender for major gains in 2025. The platform is designed to build a sustainable ecosystem with a total supply of tokens that actively encourages community participation and development.
With a recent 11% drop, to trade at roughly $0.34, Dogecoin’s price performance falls victim to market volatility. The sell-off has caused DOGE to return to its 50 EMA, a critical support level. Experts question whether Tesla, owned by Elon Musk, could save DOGE. On the other side, DTX Exchange’s quick rise in the market steals the show! The hybrid trading platform raises a huge $11.4 million in presale.
Learn more:
Cardano’s price fell as low as $0.91 on Monday, entering an 8% correction after emerging as the best performer last week. Market data shows that ADA bull traders remain reluctant to exit despite volatile price movements. Will ADA stage a rapid rebound from $0.90?
Cardano (ADA) was among the hardest-hit cryptocurrencies on Monday as the global crypto market faced another downturn.
The sell-off was largely driven by mounting concerns over inflation after stronger-than-expected United States (US) jobs data was released last week.
Investors are now bracing for an uptick in inflation, which could reduce the likelihood of further Federal Reserve (Fed) rate cuts in Q1 2025.
With the Consumer Price Index (CPI) report due on Wednesday, cryptocurrencies experienced heightened volatility as US markets reopened, prompting traders to recalibrate their positions ahead of the key data.
Notably, Cardano, which ranked as one of the best-performing assets last week, saw its bullish momentum reverse sharply on Monday.
Cardano (ADA) Price vs. TOTAL Crypto Market Capitalization
Cardano’s price plunged 10% on Monday, declining from its $0.99 opening price to $0.91 at press time.
By contrast, the TOTALCap chart indicates that the overall crypto market fell by just 5% during the same period.
This highlights that ADA is declining nearly twice as fast as the broader market average.
This suggests that traders who benefited from ADA’s chart-topping 17.8% gains last week are now locking in profits, driving the intensified sell pressure.
The broader macroeconomic uncertainty, coupled with expectations of a rate pause and geopolitical developments like new US tariffs, have placed downward pressure on Cardano price and the wider crypto market on Monday.
However, derivatives market trends indicate that many investors remain focused on potential upside scenarios tied to upcoming events, particularly Donald Trump’s January 20 inauguration.
The Trump administration’s transition committee has proposed a crypto tax reform that could eliminate capital gains taxes for US-based cryptocurrency projects, including Cardano.
According to trends observed on Coinglass’ ADA Open Interest chart, Trump’s policy speculation currently appears to be influencing traders’ positions.
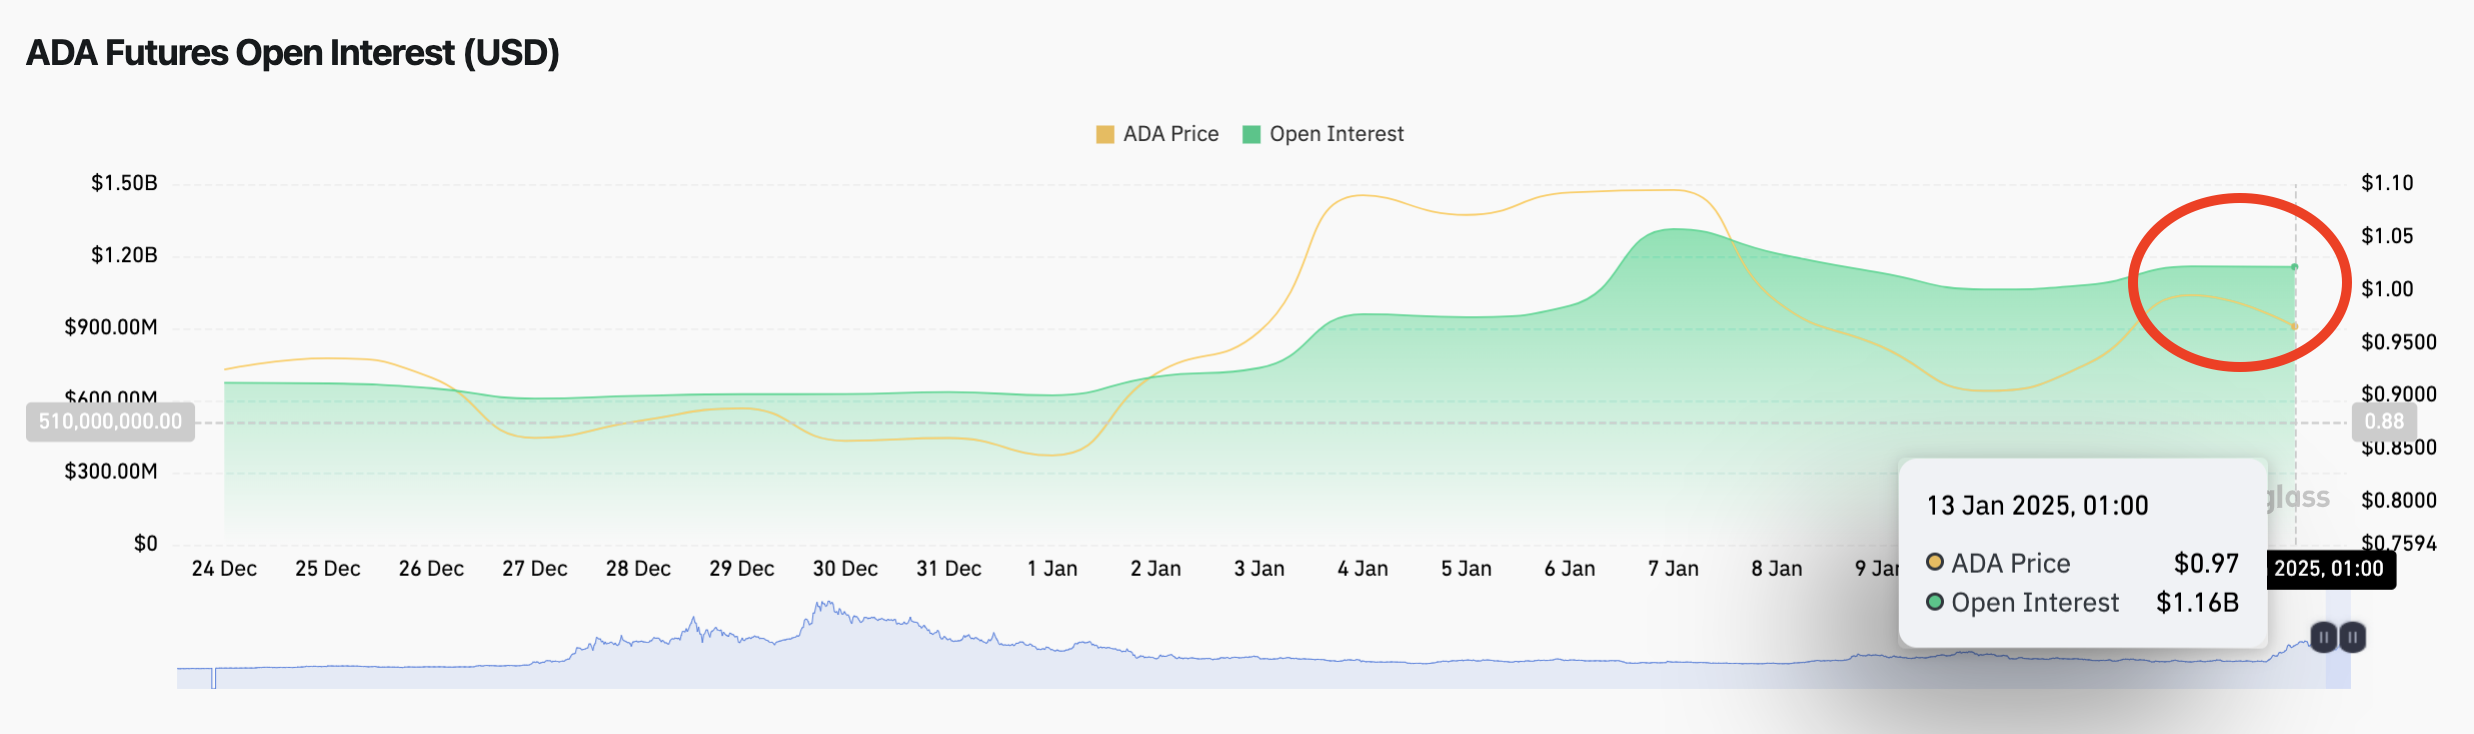 Cardano Open Interest vs. ADA Price | Source: Coinglass
Despite ADA’s 10% price decline over the past two days, the asset’s open interest remains steady at $1.16 billion. This signals that the ADA market continues to attract new speculative positions even as some traders exit amid the recent dip.
The steady $1.16 billion open interest in ADA derivatives illustrates that traders are adopting a defensive yet optimistic approach. With Trump’s inauguration now just days away, many appear to be anticipating a potential market rebound, particularly if the proposed crypto-friendly policy amendments materialize.
Cardano (ADA) shows signs of recovery, with its price rebounding from the critical $0.90 support level after a steep 10% daily timeframe decline.
However, historical indicators reveal frequent high-volume accumulation near $0.90, suggesting it serves as a pivotal buy wall.
In affirmation of this stance, technical indicators on the 12-hour chart show ADA price has moved above the Volume-Weighted Average Price (VWAP) at $0.92 indicating strong buying support.
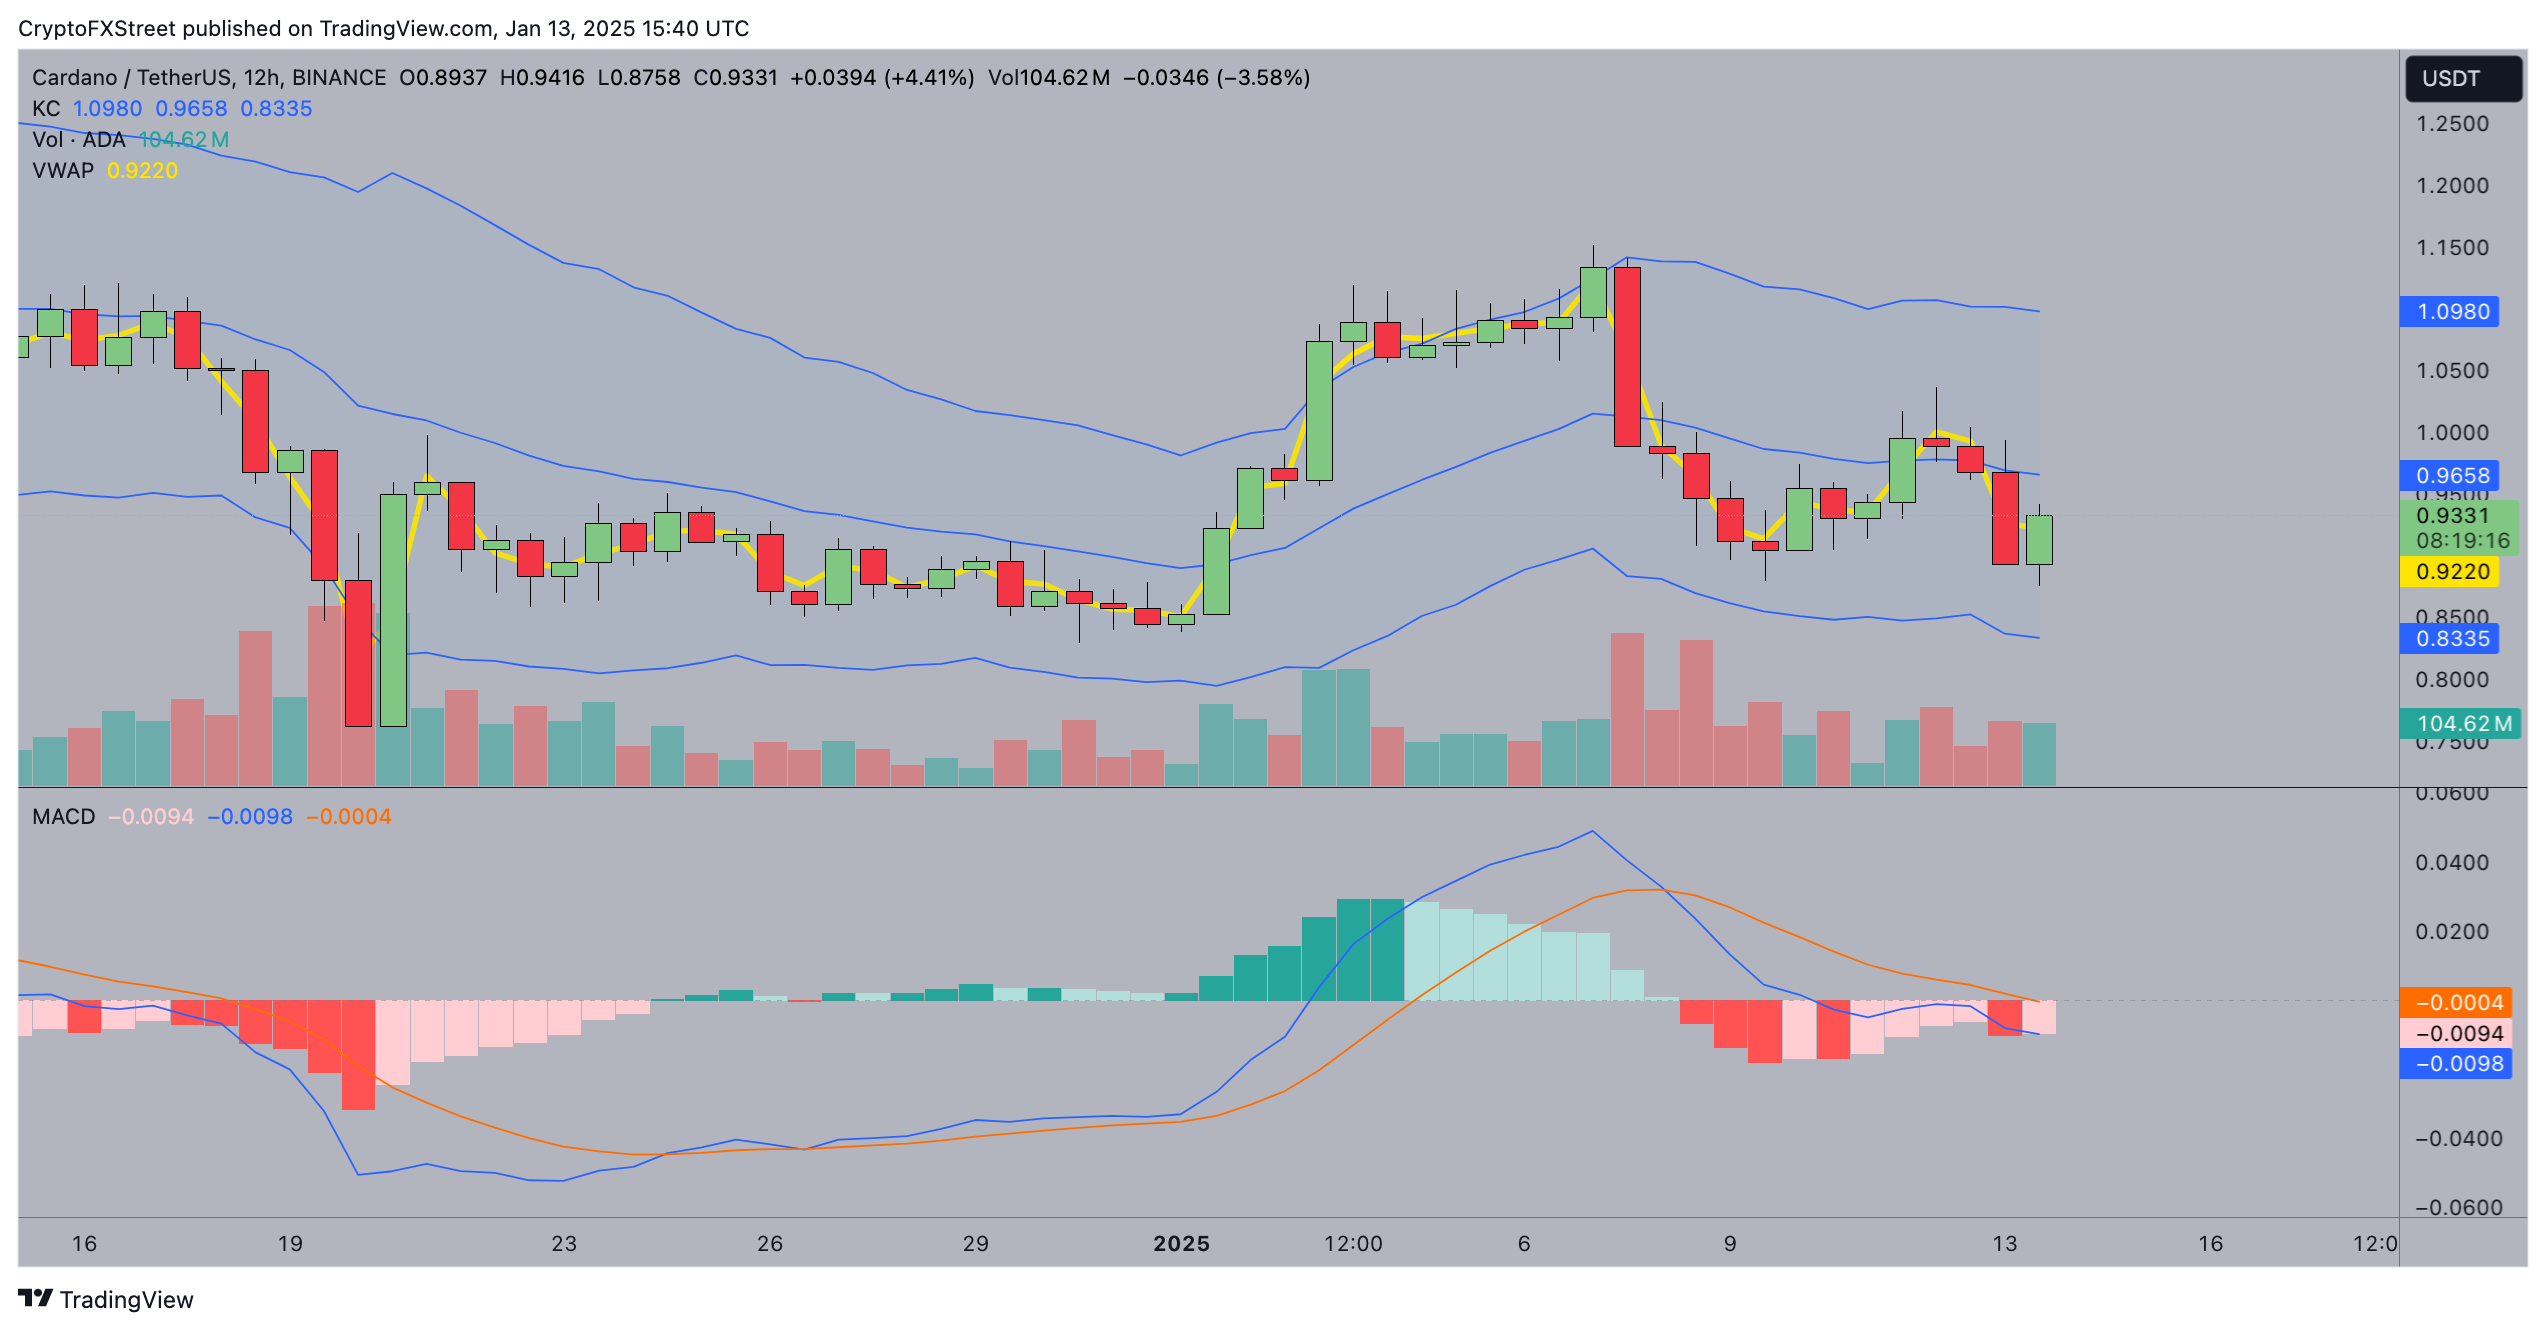 Cardano Price Forecast | ADAUSDT
Adding to this bullish case, the Moving Average Convergence Divergence (MACD) in the same time frame reflects a narrowing gap between the signal and MACD lines, nearing a bullish crossover zone.
Should the price stabilize above $0.91, a rally toward the upper Keltner Channel boundary at $0.96 could materialize, with $0.99 acting as a subsequent resistance target.
Conversely, failure to hold $0.90 could lead to renewed selling pressure, dragging ADA toward $0.83.
The MACD’s marginally negative readings signal vulnerability if buyers fail to sustain momentum.
Veteran market analyst Tony “The Bull” Severino has made a bold prediction regarding the future price of XRP, forecasting a potential rally that could see the asset surge to $13.4 if a developing bull flag pattern plays out as expected. Severino, a Chartered Market Technician with over 15 years of trading experience, suggests that XRP could experience one of its most impressive rallies in recent years.
XRP’s Bull Flag Formation
Severino’s prediction is based on a potential bull flag pattern forming on XRP’s daily price chart. For context, XRP experienced a significant surge in the wake of Donald Trump’s victory in November 2024. The coin, which traded at $0.4956 on November 4, skyrocketed to a seven-year peak of $2.9 by December 3, marking an astonishing 485% rise in just one month. This surge created a flagpole on the chart.
However, after reaching its peak at $2.9, XRP underwent a pullback, dropping back to the lower $2 range, where it has since consolidated. Severino believes that this consolidation could be the formation of the bull flag, a pattern typically indicating the possibility of a continued uptrend. The pattern forms when an asset experiences an initial rally, followed by a period of consolidation, and then a breakout to the upside.
The Bullish Prediction
While Severino cautions that the pattern could also signal a descending channel rather than a bull flag, he remains optimistic that the breakout, if the bull flag holds, could lead to an explosive surge in XRP’s price. Bull flags typically signal a resumption of the previous uptrend, with the breakout often mirroring the magnitude of the initial rally.
In this case, with XRP having surged 485% from November to December 2024, Severino’s chart suggests that the breakout could lead to another 485% increase from the current price. This would push XRP’s price up to a target of $13.4.
Potential Market Impact
A rise to $13.4 would not only represent a dramatic increase in XRP’s value but also push its market capitalization to over $769 billion, which would place it ahead of Ethereum in market value. This ambitious price target has caught the attention of many traders and investors, especially given XRP’s recent recovery and bullish indicators.
One of the key signals supporting Severino’s bullish outlook is XRP’s quarterly Relative Strength Index (RSI), which has surpassed the 70 mark. The last time this occurred was in January 2018, just before XRP reached its all-time high of $3.31. Additionally, XRP recently closed its first-ever yearly candle above $2, further fueling optimism for the digital asset.
XRP’s Current Position
At the time of writing, XRP is trading at $2.52, maintaining a strong position in the market while Bitcoin struggles to stay above $95K. Despite the ambitious nature of Severino’s target, the pattern and indicators suggest that XRP could be poised for a major breakout, making it an asset to watch in the coming weeks.
As the cryptocurrency market continues to evolve, XRP’s performance could signal a new phase of growth, and the potential for a rally to $13.4 may not be as far-fetched as it initially seems. Investors and traders alike will be keeping a close eye on how this bull flag develops, with the possibility of significant gains on the horizon if the pattern plays out.
Post Views: 1
Solana price plunged 5% on Monday, trading below the $170 mark for the first time since November 2024. On-chain data shows that SOL’s latest dip coincided with a negative swing in market sentiment. Is SOL price hinting at further downside risks?
Solana (SOL) nosedived to a two-month low on Monday, mirroring the broader cryptocurrency market’s turbulent start to the week.
The plunge comes as traders brace for crucial inflation data and navigate hawkish monetary policy signals, while geopolitical risks like renewed trade tensions weigh on sentiment.
Bitcoin dropped to $90,600 and Ethereum retraced to $3,100, reflecting bearish momentum across key assets.
Solana Price Action (SOL/USDT)
At press time, Solana is trading at $176.93, a steep 6.14% decline over the last 24 hours.
The token briefly hit $168 earlier in the session, marking its lowest level since November 6, 2024.
This 68-day low highlights ongoing selling pressure, particularly as trading volumes remain elevated, surpassing 4.59 million.
The extended downward shadow of Monday’s candlestick suggests weakening support levels, posing risks for further declines if bearish sentiment persists.
Solana’s underwhelming price performance on Monday mirrors the broader market sentiment.
However, the on-chain data trend shows SOL’s latest downtrend coincided with a dramatic spike in market supply, a move that could trigger further downside or impede early breakout attempts.
In affirmation of this narrative, the Santiment chart below compares Solana’s daily Trading Volume against Weighted Sentiment —the balance between negative and positive comments surrounding a cryptocurrency project.
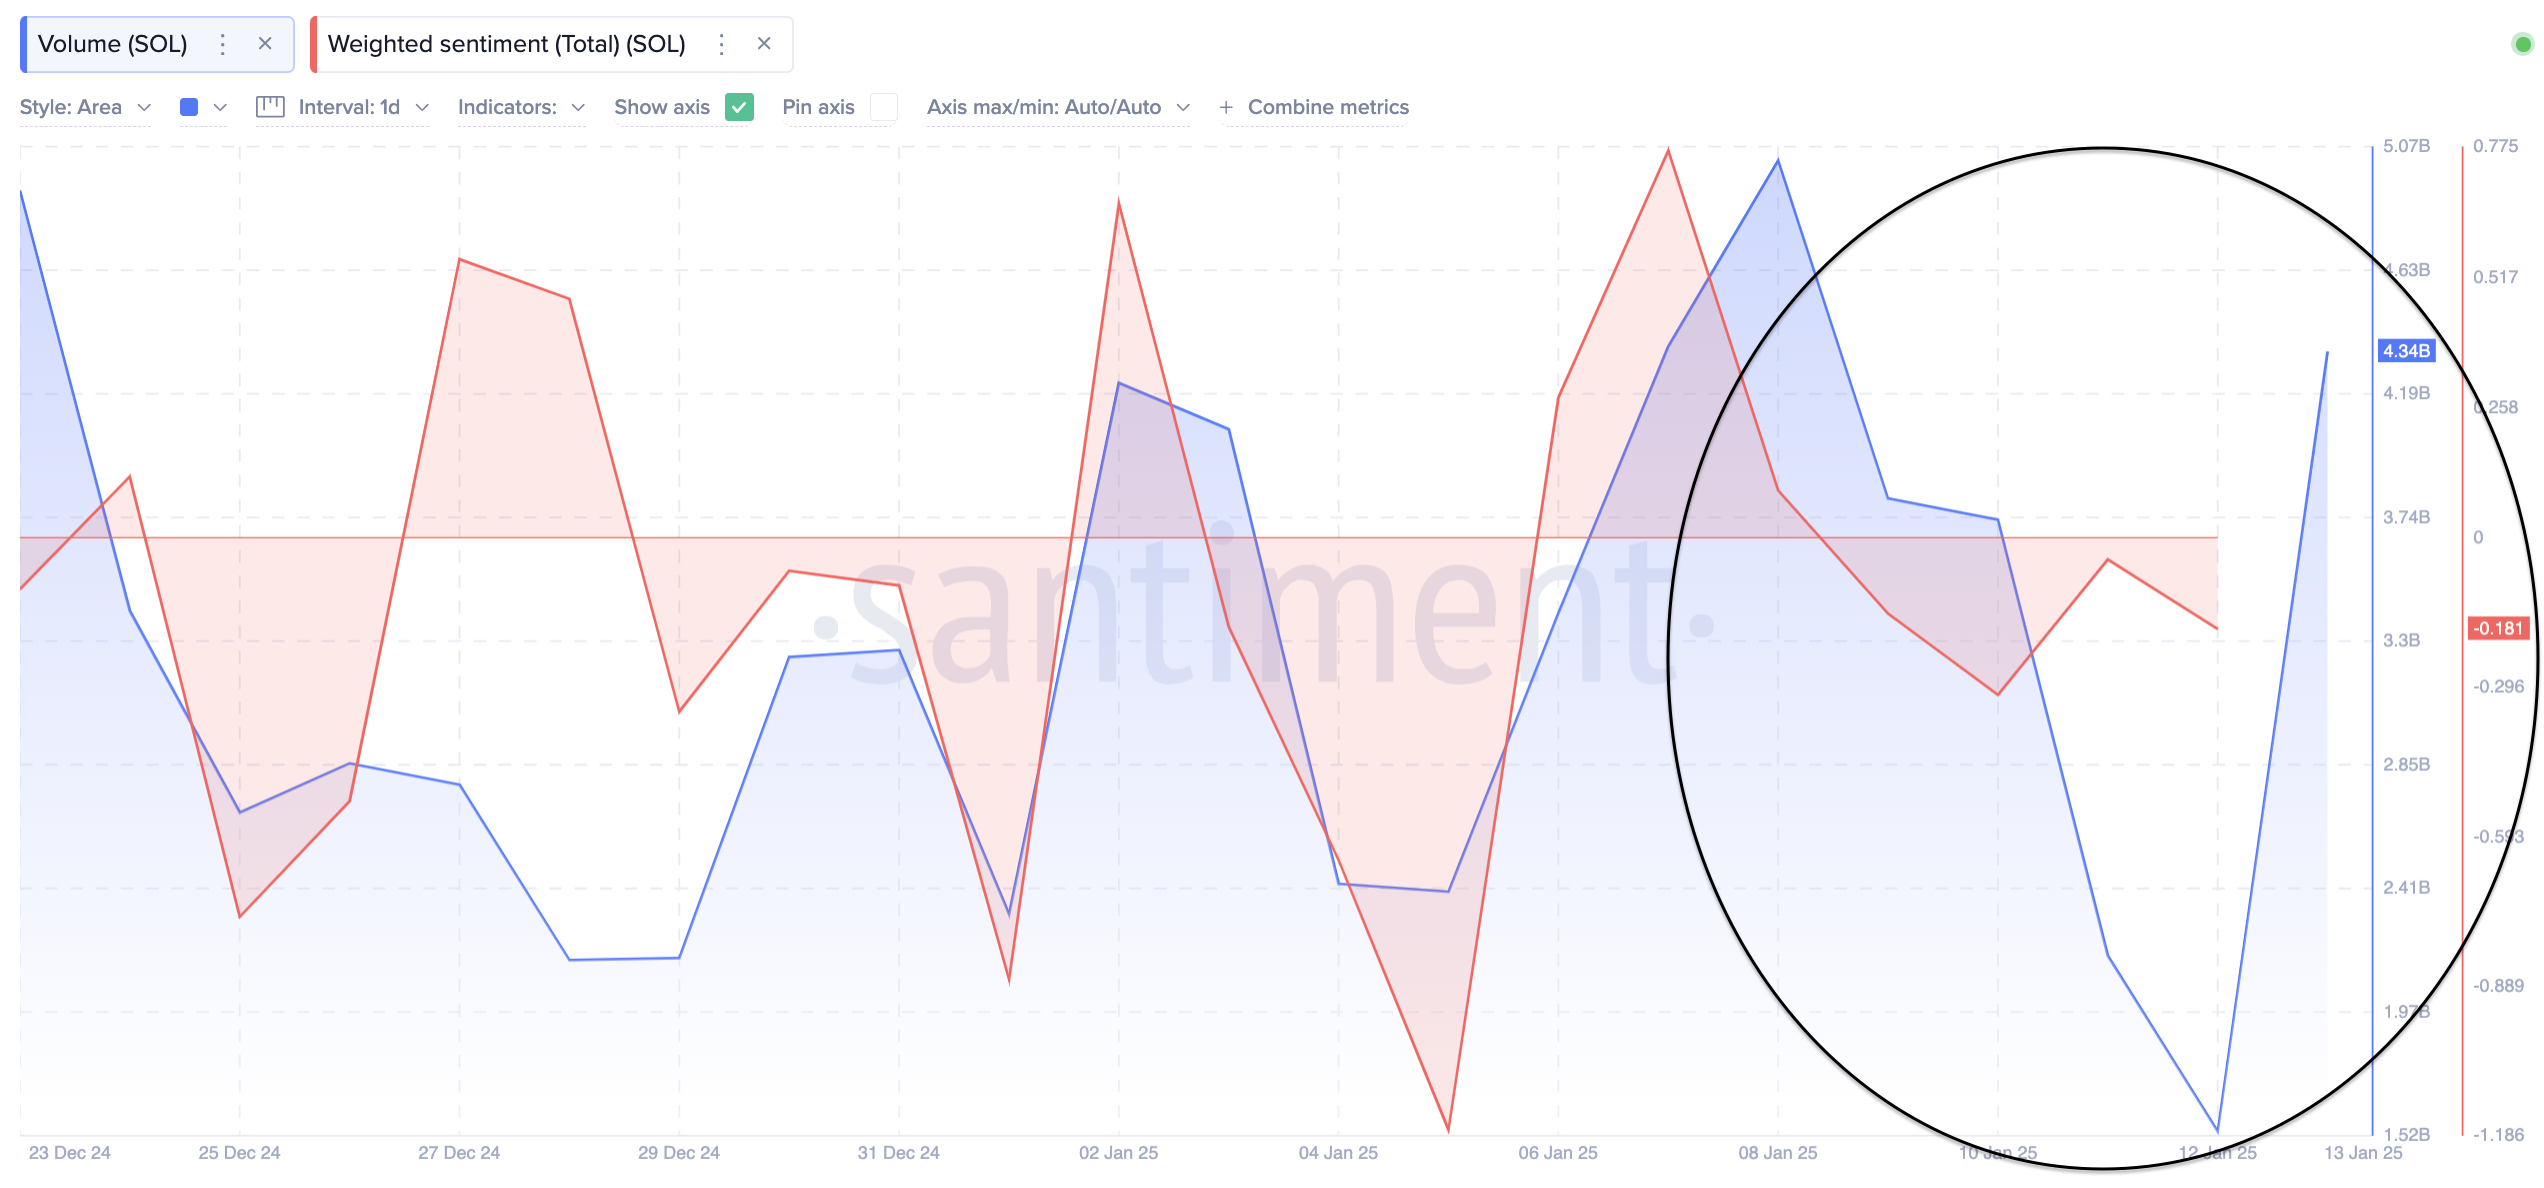 Solana Weighted Sentiment vs. SOL Trading Volume | Source: Santiment
The blue line depicts how Solana’s trading volume surged by 2.8 billion in the last 24 hours, rising from 1.54 Billion SOL on Sunday to 4.35 billion SOL on Monday.
More so, this 90% spike in market supply has coincided with SOL Weighted Sentiment plunging further to negative values of -0.18 at press time on Monday.
When market volumes surge during a spike in negative comments as observed in the SOL on-chain trends, it signals that market participants are backing up their bearish concerns with active sell-side pressure.
While Solana currently trades at $176, having briefly tested the $168 level during the day, bears could anticipate weakened support levels below and pile on additional short positions in the days ahead.
Solana (SOL) plunged 6.19% to $176.85, marking a substantial bearish continuation after a rejection near $196.54 (upper Bollinger Band).
The current price is below the 20-day moving average, which indicates weakened bullish momentum. With a daily trading volume of 4.68 million, the rising activity signals aggressive selling pressure.
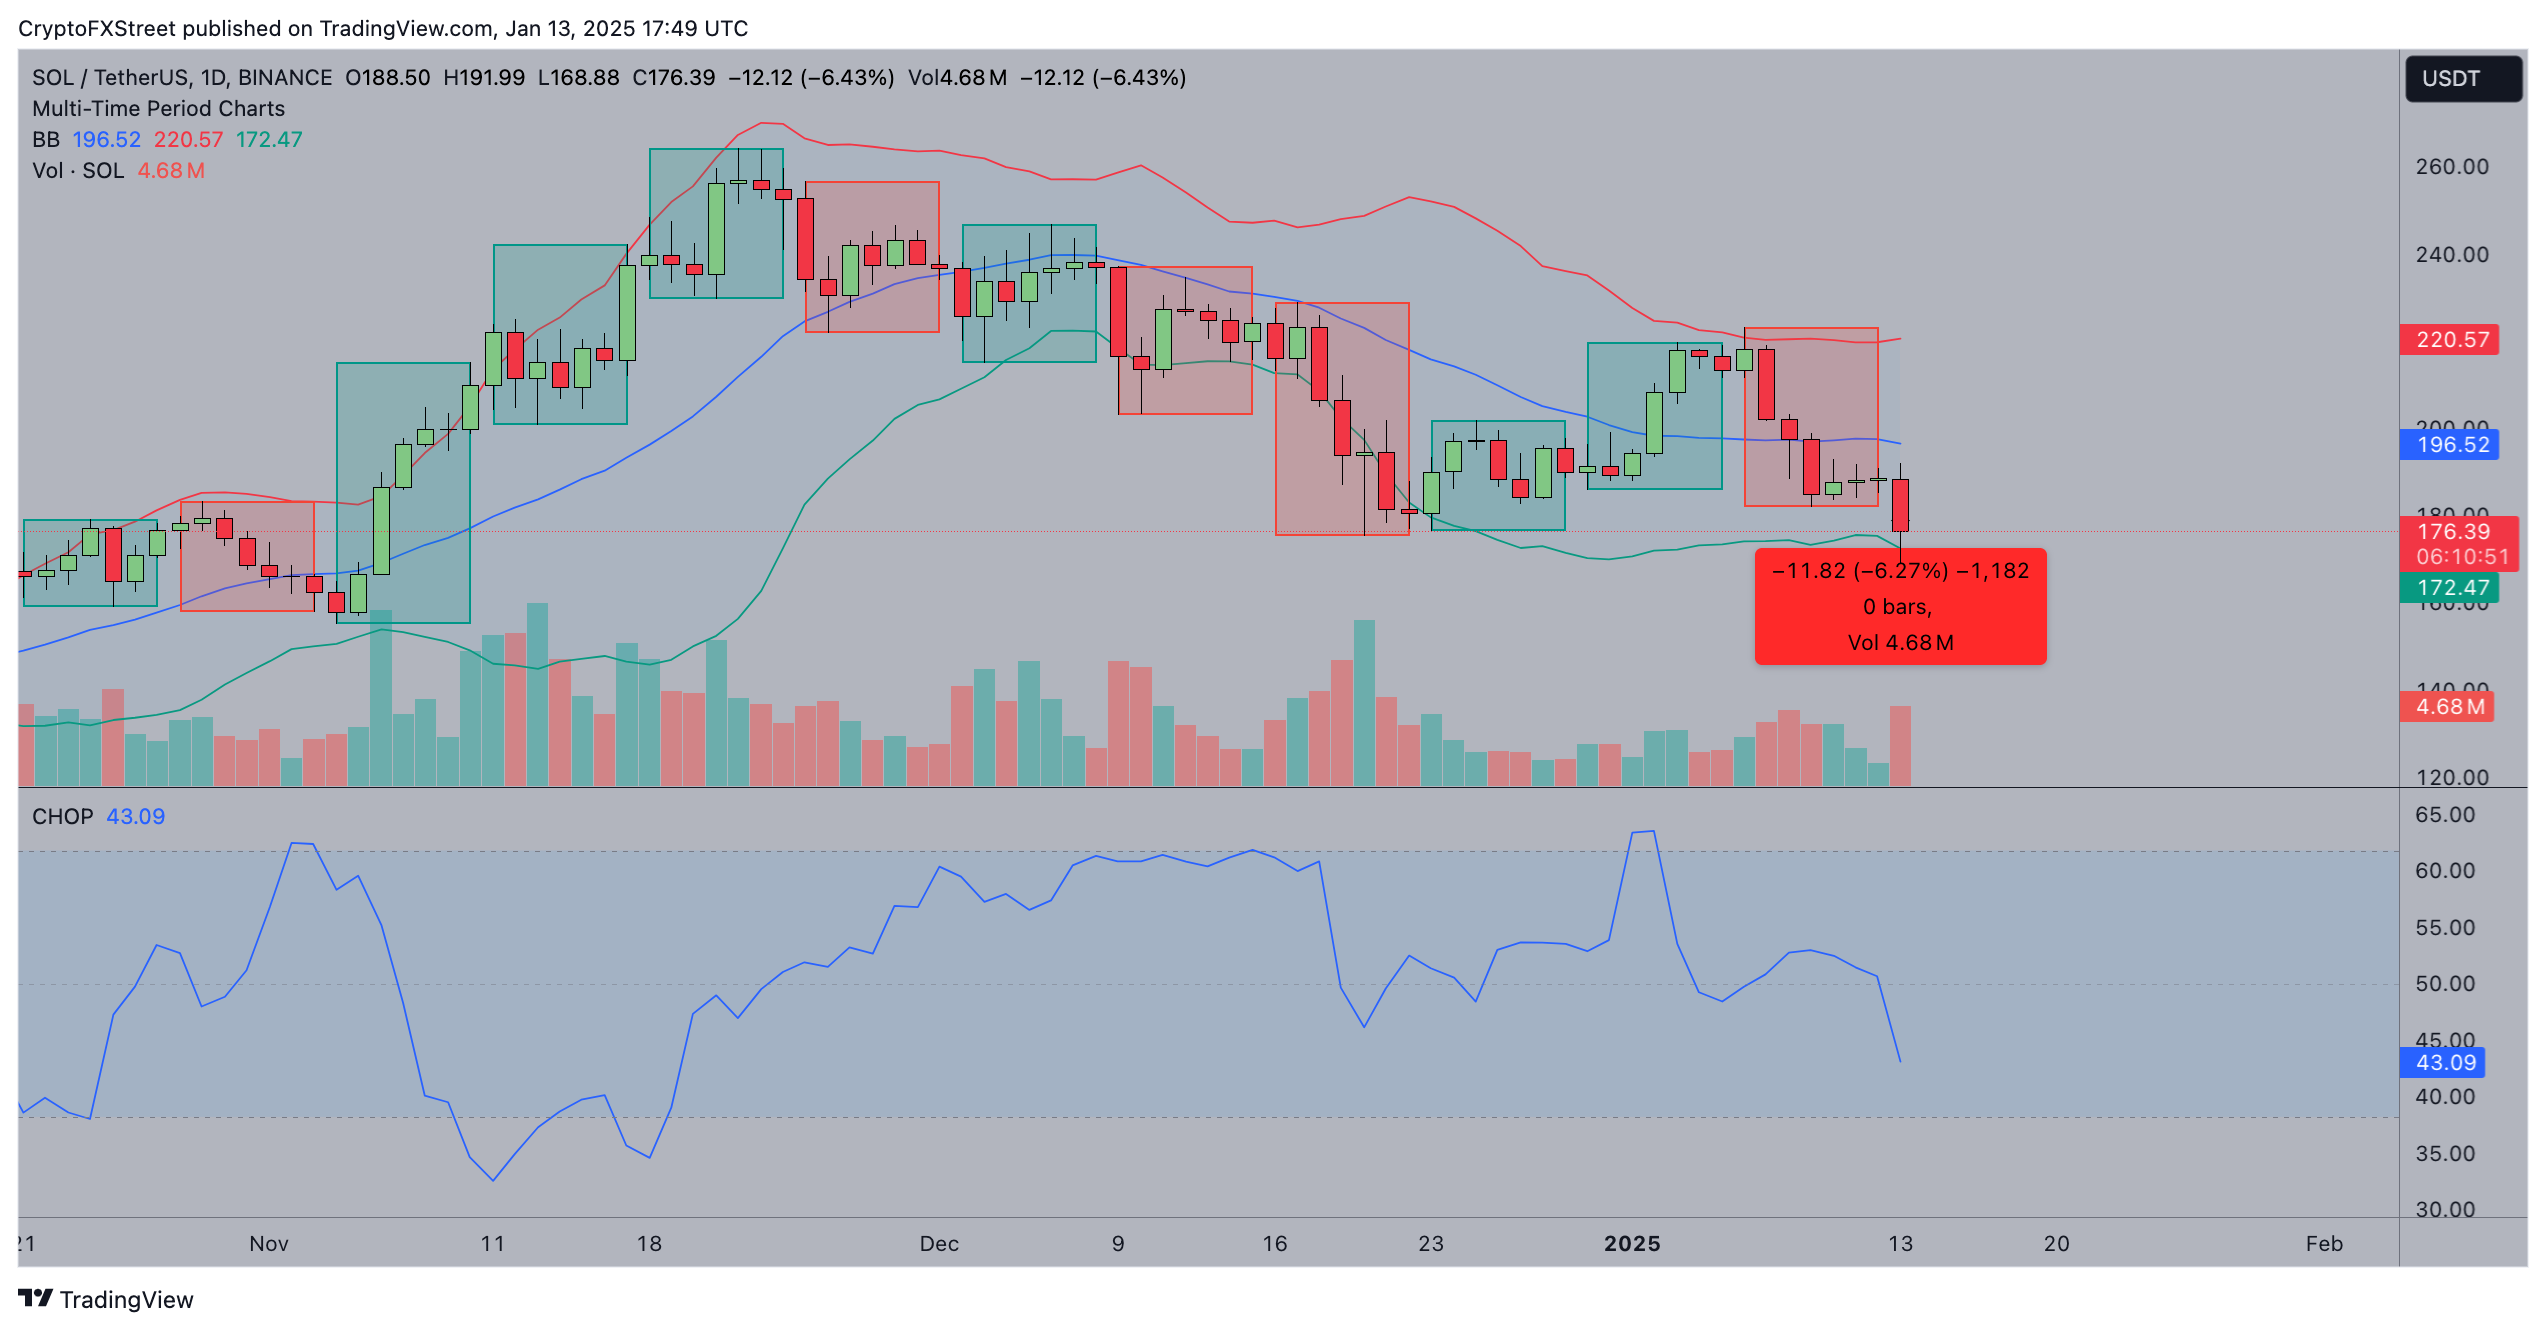 Solana Price Forecast | SOLUSDT (Binance)
The Choppiness Index (CHOP) reading of 43.09 suggests the market remains moderately directional.
If bearish sentiment intensifies, SOL risks breaching the $172.57 lower Bollinger Band, exposing $170 as the next critical support level.
A break below $170 could invite accelerated selling, driving the price toward $150.
However, should Solana defend the $172 support zone, a rebound towards the $196.54 resistance level remains plausible.
Such a move would depend on broader market recovery and improving sentiment.
The Bollinger Band’s widening range indicates potential volatility ahead, leaving the short-term bias tilted bearish but subject to sharp reversals if momentum shifts.
Disclaimer: The opinions expressed by our writers are their own and do not represent the views of U.Today. The financial and market information provided on U.Today is intended for informational purposes only. U.Today is not liable for any financial losses incurred while trading cryptocurrencies. Conduct your own research by contacting financial experts before making any investment decisions. We believe that all content is accurate as of the date of publication, but certain offers mentioned may no longer be available.
The market seems unlikely to make a reversal, according to CoinStats.
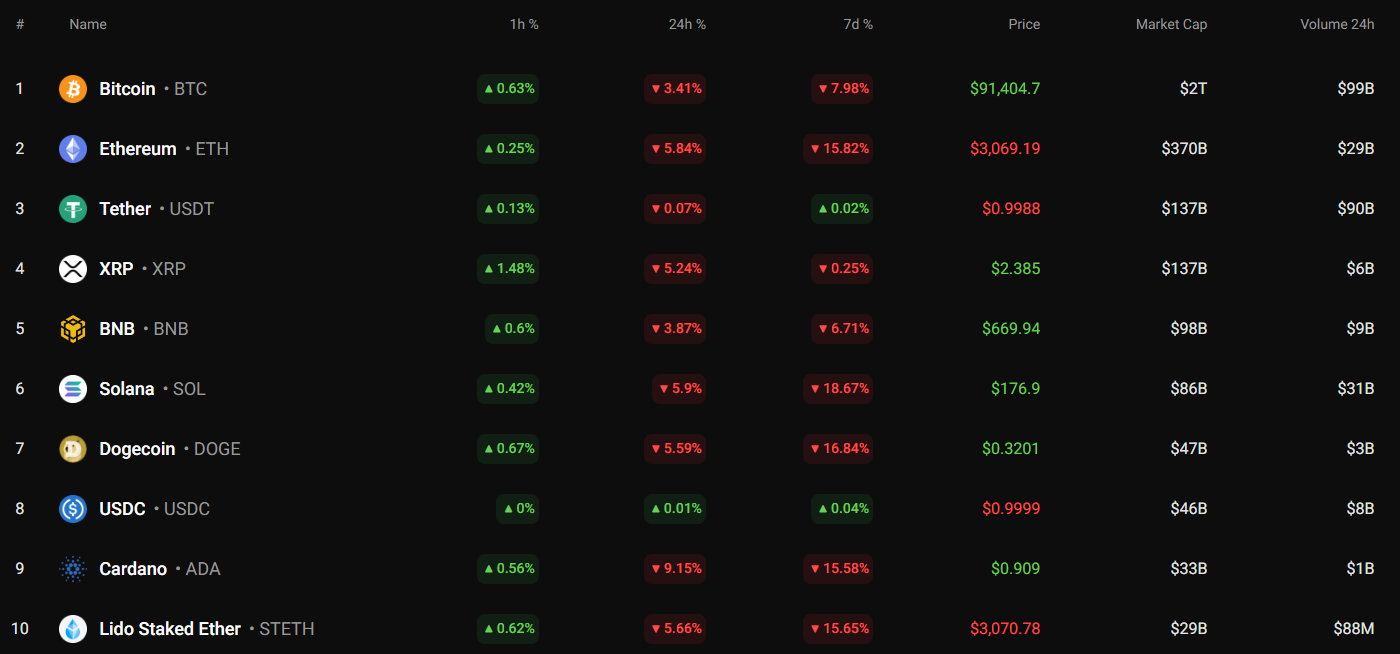
Cardano (ADA) is one of the biggest losers today, declining by almost 10%.
Despite today’s sharp fall, the rate of ADA keeps looking bearish. At the moment, one should pay attention to the nearest zone of $0.90. If it breaks out, one can expect an ongoing correction to the $0.80-$0.85 range.
ADA is trading at $0.9042 at press time.
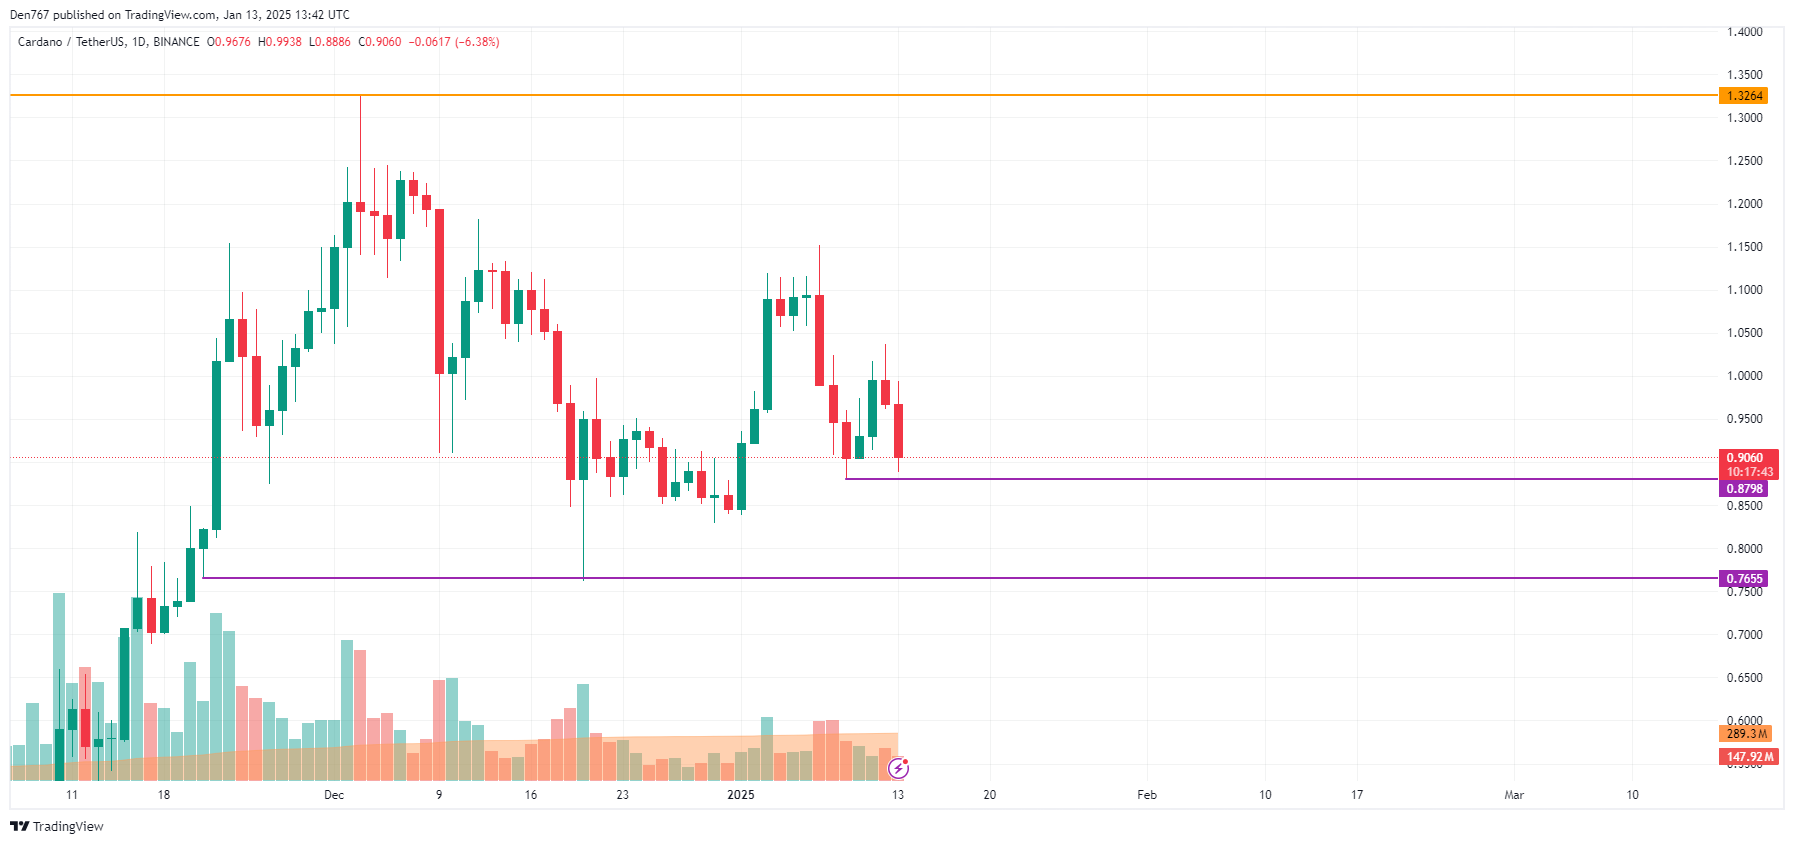
The rate of Binance Coin (BNB) has dropped by 3.87% since yesterday.
On the daily chart, the price of the native exchange coin is far from key levels. Thus, the volume has declined, which means there are low chances of seeing a quick bounce back.
Related

In this case, the correction is likely to continue to the interim zone of $640.
BNB is trading at $669.50 at press time.
Disclaimer: The opinions expressed by our writers are their
own and do not represent the views of U.Today. The financial and market information
provided on U.Today is intended for informational purposes only. U.Today is not
liable for any financial losses incurred while trading cryptocurrencies. Conduct
your own research by contacting financial experts before making any investment
decisions. We believe that all content is accurate as of the date of publication,
but certain offers mentioned may no longer be available.
Speculations of another Trump-led bull run following his inauguration have led to Dogecoin price predictions to reach $1. However, it’s PropiChain (PCHAIN) that’s breaking headlines as the new AI altcoin prepares for a 30,000% climb from $0.01 to $3 by Q2 2025.
With DOGE only offering a less than 300% surge, even Dogecoin traders will be looking to secure a spot in round two of the PropiChain presale before the next round price hike.
Seeing as the Dogecoin price shot up 250% following Trump’s presidential election victory, analysts now anticipate that DOGE can surge by another 300% after his inauguration, which is expected to trigger another bull run.
If this happens, the Dogecoin price can go from $0.3207 today to finally reach the psychological $1 mark it has strived for since its launch. However, even with the projections looking attainable, experts advise investors to remain cautious as Dogecoin (DOGE) has historically struggled to stay ahead of its critical $0.34 support levels.
With this fact combined with the significant Dogecoin price decline over the past day (4.48%), week (5.00%), and month (16.22%), DOGE holders should reconsider diversifying their portfolios.
While there are few options regarding the best altcoins to buy now as the crypto market recedes, investors are strongly considering the prospects of making huge profits with PropiChain, citing its transformative factor in the $634 trillion real estate market and 30,000% growth potential.
The tokenization of real-world assets (RWA) is redefining industries, and PropiChain (PCHAIN) is leading this transformation in real estate. By bridging blockchain technology and AI, PropiChain is creating a seamless, secure, and highly efficient way to buy, sell, and manage property investments.
Imagine transferring asset ownership was as effortlessly as sending a text. PropiChain makes this possible by converting physical assets into digital tokens stored on a tamper-proof blockchain. This process not only ensures unparalleled security but also enables near-instant transactions, eliminating the inefficiencies of traditional methods.
Yet, speed and security are just one part of a broader transformative story. PropiChain takes innovation a step further with fractional ownership, revolutionizing market access. Instead of needing six-figure sums to invest in real estate, individuals can now own unlimited fractions (such as 0.1%) of virtually any property.
Adding to this accessibility is PropiChain’s immersive metaverse marketplace, where users can explore, negotiate, and trade properties from anywhere on the globe. This borderless platform empowers everyone – from seasoned professionals to first-time buyers – to engage with real estate in a whole new way.
PropiChain isn’t just about tokenization or accessibility; it’s about creating a complete ecosystem. The platform integrates advanced smart contracts and AI to deliver a full-service solution for real estate management and investment.
Smart contracts automate time-consuming processes such as leasing, rent collection, and renewals, saving users both time and money by removing intermediaries.
Meanwhile, PropiChain’s proprietary AI tools, available exclusively to PCHAIN token holders, add a whole new dynamic to real estate investing. These tools provide 24/7 assistance, streamline property searches, automate property valuations, and enable intelligent asset trading to maximize investor returns.
With another bull cycle upon us, analysts believe the Dogecoin price may surge 300% or more to finally cross the $1 mark. However, even while ignoring Dogecoin’s historic struggle with the $0.34 resistance level, investors are banking on PropiChain instead, as the AI altcoin is projected to reach $3, ballooning 30,000% from its $0.01 price today.
Unsurprisingly, the potential Dogecoin price rally to $1 is going largely unnoticed as PropiChain’s stellar 30,000% financial opportunity emerges. This is evidenced by the massive participation in the PCHAIN presale from retail and institutional investors, with over $2.2 million raised in record time.
With the potential to grow a $1,200 investment today into $360,000 before Q2 2025, experts rightly call PCHAIN one of the best AI altcoins to invest in today.
However, as you might expect, investors are swarming the PropiChain presale not only for its massive profit potential but also because this is the final chance to acquire the PCHAIN crypto at $0.011, which is the lowest it’ll ever be again.
For interested investors, there’s no better time to act as news of the early presale success, the BlockAudit review, and the PropiChain CoinMarketCap listing have tripled traffic to the presale.
Remember, round three is coming with a 108.93% price hike, which will cut the 30,000% profit potential by more than half. Click the links below to join the second round of the PropiChain presale before it’s too late.
For more information about the PropiChain Presale:
Website: https://propichain.finance/
Join Community: https://linktr.ee/propichain
The crypto markets are experiencing an extended bearish action as the bulls remain passive, not necessarily facing exhaustion after the latest rise. The pullback has wiped out the gains incurred in the past couple of days and may create a massive FUD among the market participants. Meanwhile, the technicals suggest the ADA price is currently consolidating but may soon trigger a massive rebound above $1.
Now the question arises: whether the Cardano price will be able to sustain above $1?
In recent times, it is evident that the ADA price rally has failed to defend the support at $1 and faced a pullback each time it surged above $1. This supports the claim of bears capitulate the rally at these levels and hence, after constantly exerting pressure at this range, they may soon turn weak. This may be when the price breaches the resistance but a notable rise in the volume is also required to do so.
Adding icing to the cake, the technicals flash bearish signals that may drag the levels still lower. However, this move may trap the bears as a huge rebound is fast approaching.
The weekly price action of ADA appears to be bearish as the token is testing the lower support without enough buying pressure. Secondly, the MACD displays a drop in the selling pressure with the lines about to undergo a bearish crossover. Besides, the RSI failed to surpass the upper threshold, resulting in the levels dropping below 70. At this point, if the bulls manage to hold the support, then the bull flag pattern could be in play, which may initiate a strong rise to the resistance.
Otherwise, a failure could force the price to test the lower support close to $0.7, exhausting all the selling pressure. Therefore, the ADA price may then trigger a strong rebound, while the bulls may try hard to maintain a healthy ascending trend later. This could delay the token to reach $1, which may further differ the possibility of marking a new ATH in 2025. Hence, the upcoming week could be pretty important for the Cardano (ADA) price rally, as a weekly close within the range may revive the bullish possibilities.
Disclaimer: The opinions expressed by our writers are their own and do not represent the views of U.Today. The financial and market information provided on U.Today is intended for informational purposes only. U.Today is not liable for any financial losses incurred while trading cryptocurrencies. Conduct your own research by contacting financial experts before making any investment decisions. We believe that all content is accurate as of the date of publication, but certain offers mentioned may no longer be available.
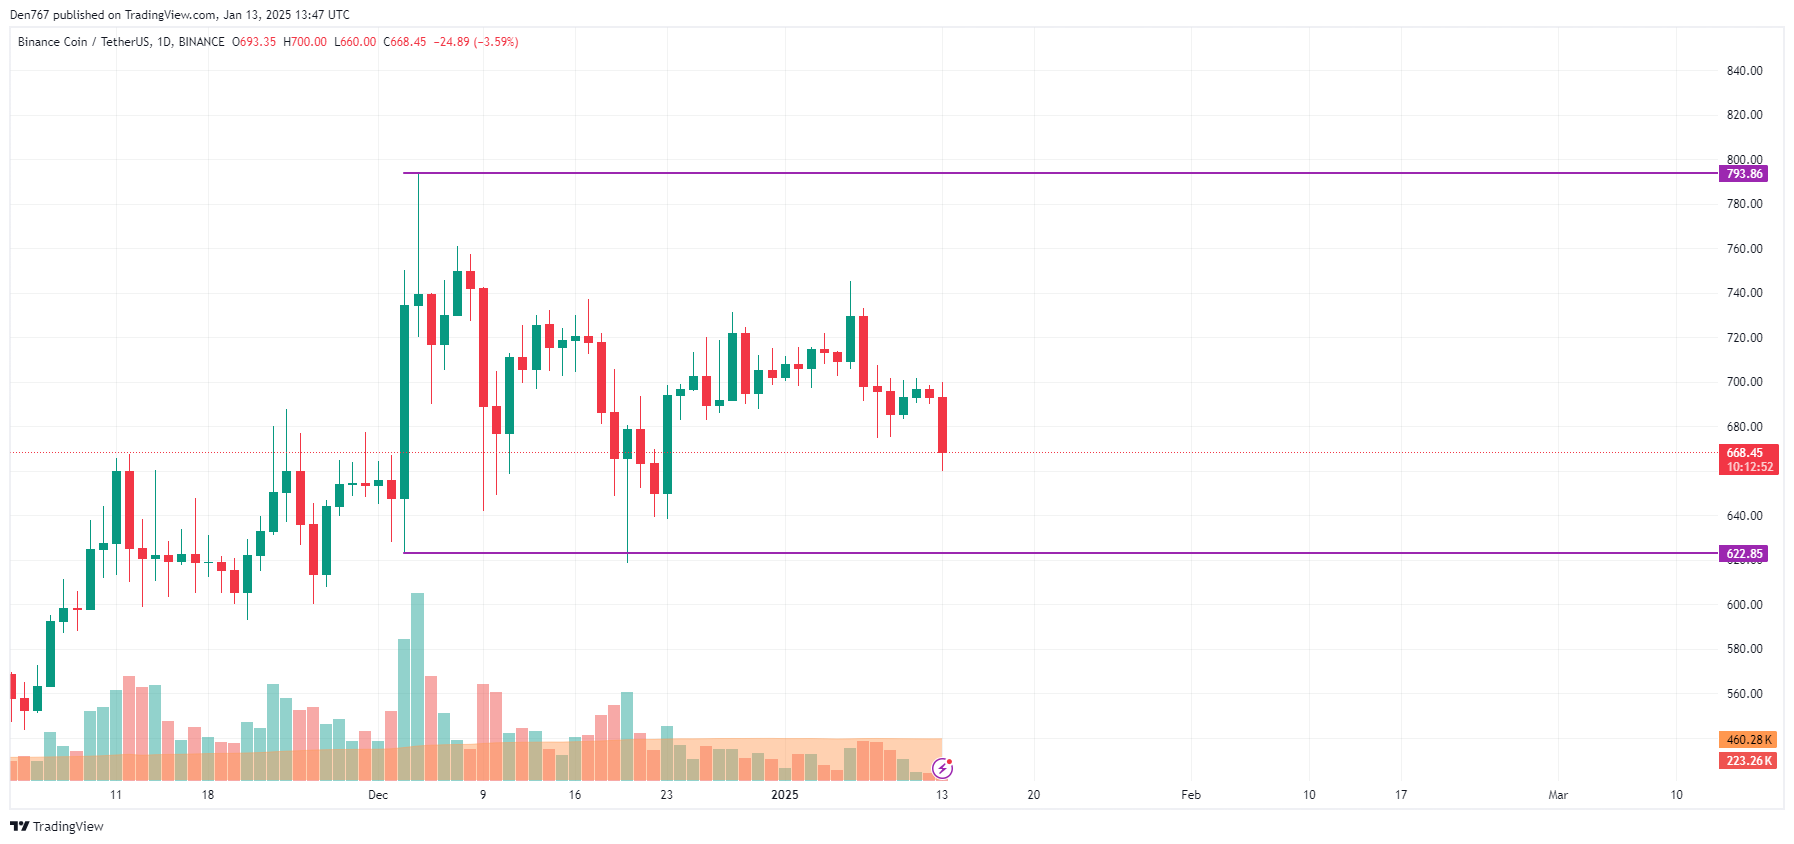
Following XRP‘s recent breakout above a crucial descending trendline, traders were expecting a big rally. However, the asset’s price is reversing back toward $2.40, suggesting that it is losing steam rather than gaining it. Let’s investigate the causes of this sudden slowdown and its potential implications for the market.
Even though XRP was able to break through the downward trendline, the rally was unable to maintain its upward momentum. This suggests that after the breakout, there was not much buying pressure, which is essential for sustaining a rally. XRP is now more susceptible to selling pressure because it has been unable to close firmly above $2.50, which has undermined bullish confidence.
There is a derisking phase going on on the larger cryptocurrency market as traders lock in gains from recent rallies. This pattern is especially apparent on assets like XRP that have already produced sizable gains. By restricting capital inflow into XRP, the decreased appetite for risk is further impeding the price growth of the cryptocurrency.
Related

Near $2.60, XRP encounters a sizable overhead resistance that has impeded its upward trajectory. The combination of this resistance and the drop in volume indicates that traders are reluctant to raise the price in the absence of more potent catalysts. A crucial support area to keep an eye on on the downside is the $2.30 level, which corresponds to the 50 EMA.
If XRP breaks through this barrier, it may retest lower supports at $1.20 or even $1.69. At the moment, the RSI is neutral at about 57, indicating that the market is unsure. XRP could lose more ground if selling pressure persists, especially if the market is still cautious overall. A robust recovery from the $2.30 support level, however, might rekindle optimism and present a chance for another breakout attempt.
The performance of XRP for the time being will be mostly determined by the state of the market as a whole and the asset’s capacity to draw in new buyers. Traders can predict the next move by keeping a close eye on important support and resistance levels.
Solana (SOL) has recently been making headlines with a remarkable V-shaped recovery, showing resilience in the face of market volatility. Traders have been closely monitoring the token’s price action, which is displaying promising signs of further upside potential. A combination of technical indicators and fundamental data suggests that Solana could be poised for a significant bullish rally in the near term. Here’s a detailed look at the factors influencing SOL’s price action and what traders can expect moving forward.
Solana’s price has seen an impressive rebound from a critical support level around $179.66. This level is notably aligned with the 61.8% Fibonacci retracement zone, a key area that often marks the end of bearish trends and signals the beginning of a reversal. Historically, this zone acts as a magnet for buyers, especially when bearish pressure begins to fade, and it seems to have done just that for Solana.
The recent bounce from this level validates the $179.66 support as a strong floor for the token, suggesting that Solana’s price could continue to trend upward in the coming weeks. Traders are eyeing potential bullish targets of $254.35, $302.02, and $345.76, which align with the Fibonacci extensions. These levels represent key resistance points where Solana could encounter selling pressure if it continues its upward momentum.
Solana’s overall market structure is looking increasingly positive as the token forms higher lows following the recovery from $179.66. This indicates renewed buyer interest and suggests that momentum could build in the weeks ahead. As long as the price holds above this support level, the potential for a breakout to new highs remains strong.
A break below $179.66 would invalidate the bullish setup, leading to a potential downside move. However, if market sentiment continues to favor the altcoin, Solana could move towards its first target of $254.35 in the near term, reinforcing the case for a V-shaped recovery.
Solana’s Market Value to Realized Value (MVRV) ratio is another key metric providing insight into the token’s recovery. At the time of writing, the MVRV ratio is steadily climbing, suggesting that most investors who entered during previous accumulation phases are either at break-even or slightly in profit. This indicates that the token is in the midst of a recovery phase, with new buyers entering the market.
The MVRV ratio has remained in a neutral zone, reflecting neither overvaluation nor undervaluation of the asset. This suggests that there is optimism in the market, with more investors beginning to buy into Solana as it recovers from the $179.66 support. If the MVRV ratio continues to rise, it could signal increased confidence in Solana’s price momentum, aligning with the bullish targets indicated by the Fibonacci analysis.
However, traders should remain cautious if the MVRV ratio spikes into overbought territory. This could signal a period of profit-taking, which may cause short-term pullbacks. A sustained MVRV ratio between 1.0 and 2.5 would suggest continued bullish momentum.
The Relative Strength Index (RSI) is another crucial indicator for assessing Solana’s price action. The recent RSI readings have indicated that Solana is currently in a neutral-to-bullish zone, with values trending between 55 and 60. This range suggests that Solana is not yet overbought, leaving room for further upward movement without triggering a reversal.
In previous rallies, Solana’s RSI has often peaked around the 70-75 range before experiencing pullbacks. Given that the current RSI is still in the neutral zone, there is ample room for the token to rise further without becoming overheated. This supports the case for a continued bullish trend, as Solana has not yet reached the overbought levels that could signal a reversal.
Overall, Solana’s technical and fundamental indicators are aligning to create a strong case for a bullish rally. Key support at $179.66, combined with Fibonacci retracement levels, a rising MVRV ratio, and a neutral-to-bullish RSI, all point to a potential continuation of the recovery. The V-shaped price action observed over the past few weeks highlights the resilience of the token and the growing optimism among traders.
As long as Solana can maintain support at $179.66, the altcoin could target its first major resistance at $254.35, with further upside potential to $302.02 and $345.76. Traders should closely monitor the MVRV ratio and RSI to gauge market sentiment and adjust their positions accordingly.
Solana’s recovery has been impressive, and the technical indicators suggest that there is more room for growth. With a strong support level at $179.66, bullish Fibonacci targets, and positive momentum in the MVRV ratio and RSI, Solana is positioning itself for a potential V-shaped recovery in the near term.
However, as always, traders should stay vigilant and watch for any shifts in market sentiment that could impact the token’s price action. If Solana continues to build on its recent recovery, it could deliver significant returns for investors in the coming weeks.
Post Views: 2


