The main tag of cryptocurrency price today Articles.
You can use the search box below to find what you need.
[wd_asp id=1]
The main tag of cryptocurrency price today Articles.
You can use the search box below to find what you need.
[wd_asp id=1]
Bitcoin’s (BTC) price continues to edge lower, trading below the $96,000 level on Wednesday after declining more than 5% the previous day. The recent price decline has triggered a wave of liquidations across the crypto market, resulting in $694.11 million in total liquidations in the last 24 hours. Moreover, CryptoQuant BTC’s Net Taker Volume on Binance has turned sharply negative, signaling increased selling pressure and hinting at further decline ahead.
Bitcoin price continues to trade in red, falling below $96,000 on Wednesday after declining more than 5% the previous day. This price correction triggered a wave of liquidations across the crypto market, resulting in $694.11 million in total liquidations in the last 24 hours, almost $125 million specifically in BTC, according to data from CoinGlass.
Liquidation chart. Source: Coinglass
CryptoQuant Bitcoin’s hourly Net Taker Volume on Binance has turned sharply negative on Tuesday, signaling increased selling pressure. This metric reached a peak of -$325 million, the highest value in 2025, during the release of the Institute for Supply Management (ISM) Manufacturing Purchasing Managers Index (PMI) and Job Openings and Labor Turnover Survey (JOLTs) data on Tuesday, which revealed unfavorable results for risky assets.
Traders should watch this indicator as it will be essential to determine whether fear is starting to dominate the markets over the long term or is temporary.
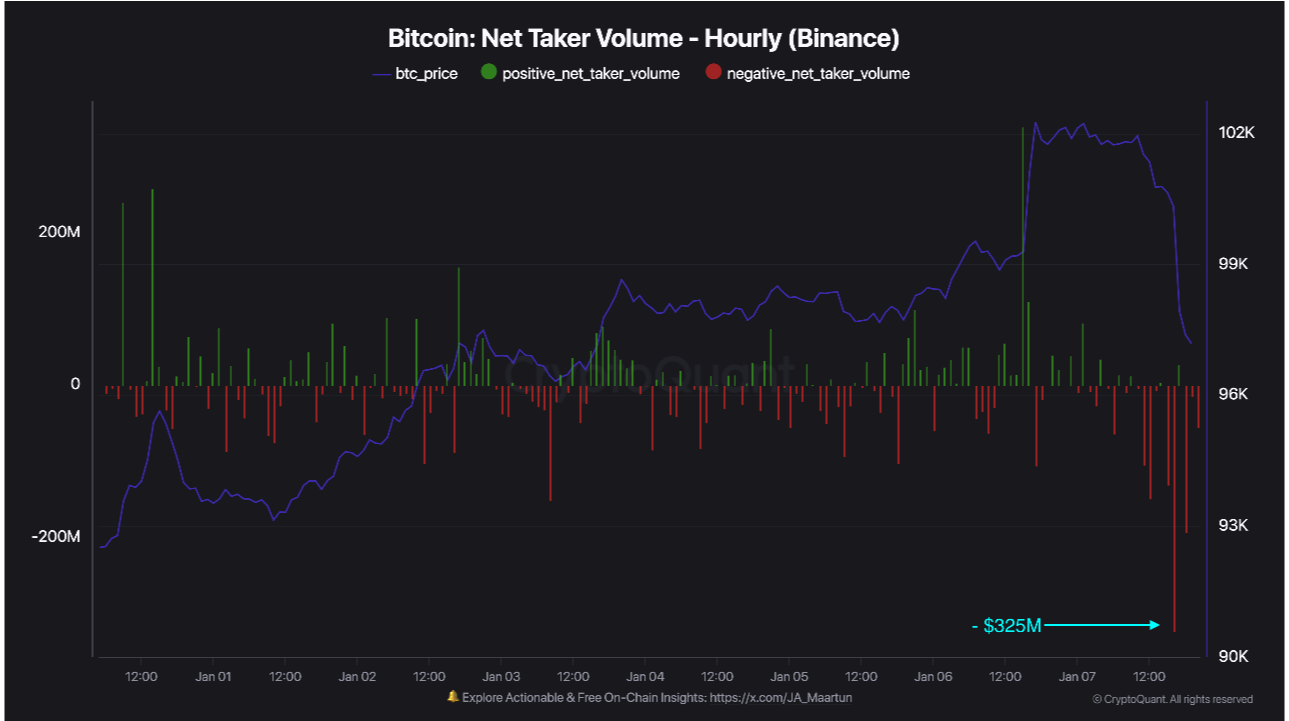
Bitcoin Net Taker Volume (Hourly) Binance chart. Source: CryptoQuant
Another sign of weakness is Coinglass’s Bitcoin long-to-short ratio, which reads 0.89, the lowest level in over a month. This ratio below one reflects bearish sentiment in the markets as more traders are betting for the BTC price to fall.
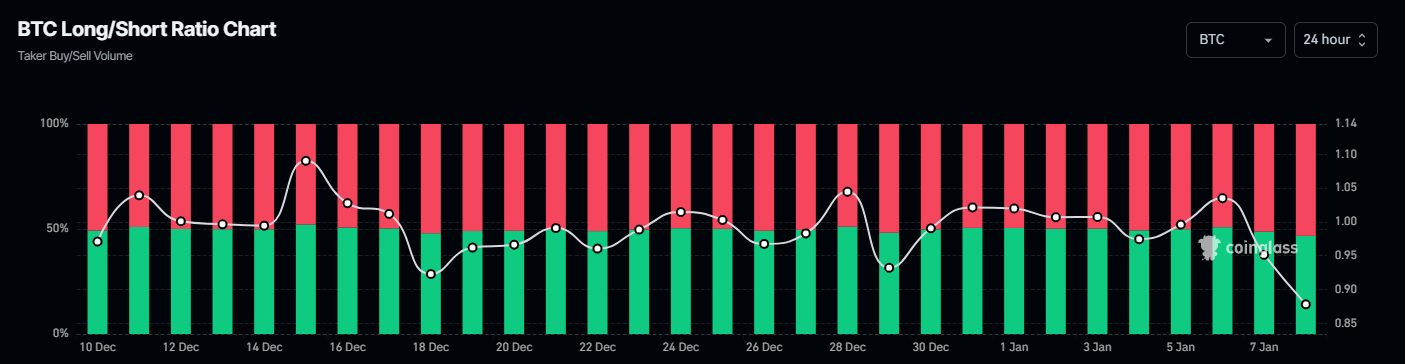
Bitcoin Long to Short Ratio Chart. Source: Coinglass
Moreover, institutional demand also shows signs of decreasing demand. According to Coinglass, Bitcoin spot Exchange Traded Funds (ETFs) recorded a mild inflow of $52.40 million on Tuesday, compared to $978.60 million on Monday. If the flow data decreases or records a strong outflow, Bitcoin price could decline further.
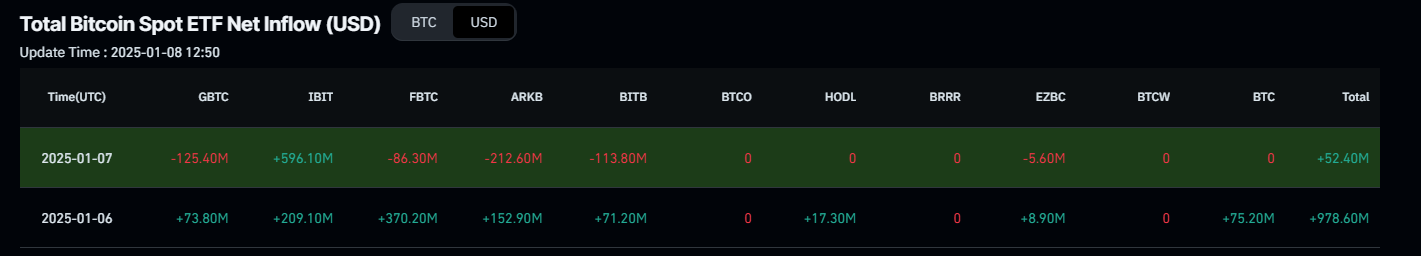
Total Bitcoin Spot ETF Net Inflow chart. Source: Coinglass
Bitcoin price declined 5.17% and closed below the $100,000 support level on Tuesday. At the time of writing on Wednesday, it hovers around $95,800.
If BTC continues its pullback, it could extend the decline to test its 38.2% Fibonacci retracement level at $92,493 (drawn from the November 4 low of $66,835 to the December 17 high of $108,353).
The Relative Strength Index on the daily chart read 47, below its neutral level of 50 and pointing downwards, indicating bearish momentum.
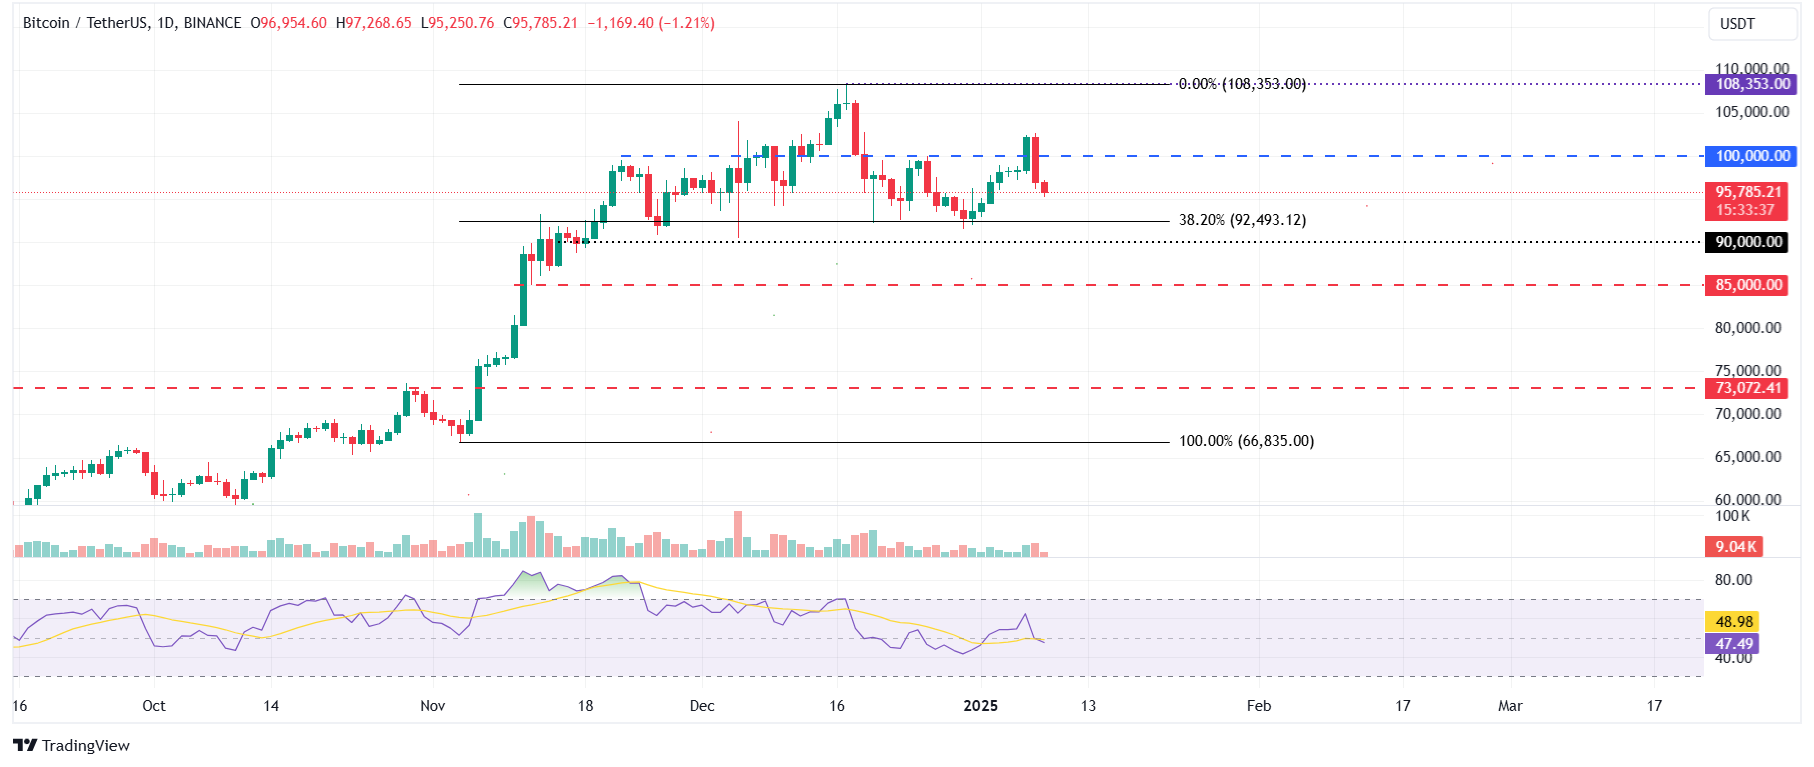
BTC/USDT daily chart
However, if BTC recovers and closes above the $100,000 level, it could extend the rally to retest its December 17, 2024, all-time high of $108,353.
Bitcoin is the largest cryptocurrency by market capitalization, a virtual currency designed to serve as money. This form of payment cannot be controlled by any one person, group, or entity, which eliminates the need for third-party participation during financial transactions.
Altcoins are any cryptocurrency apart from Bitcoin, but some also regard Ethereum as a non-altcoin because it is from these two cryptocurrencies that forking happens. If this is true, then Litecoin is the first altcoin, forked from the Bitcoin protocol and, therefore, an “improved” version of it.
Stablecoins are cryptocurrencies designed to have a stable price, with their value backed by a reserve of the asset it represents. To achieve this, the value of any one stablecoin is pegged to a commodity or financial instrument, such as the US Dollar (USD), with its supply regulated by an algorithm or demand. The main goal of stablecoins is to provide an on/off-ramp for investors willing to trade and invest in cryptocurrencies. Stablecoins also allow investors to store value since cryptocurrencies, in general, are subject to volatility.
Bitcoin dominance is the ratio of Bitcoin’s market capitalization to the total market capitalization of all cryptocurrencies combined. It provides a clear picture of Bitcoin’s interest among investors. A high BTC dominance typically happens before and during a bull run, in which investors resort to investing in relatively stable and high market capitalization cryptocurrency like Bitcoin. A drop in BTC dominance usually means that investors are moving their capital and/or profits to altcoins in a quest for higher returns, which usually triggers an explosion of altcoin rallies.
Disclaimer: The opinions expressed by our writers are their own and do not represent the views of U.Today. The financial and market information provided on U.Today is intended for informational purposes only. U.Today is not liable for any financial losses incurred while trading cryptocurrencies. Conduct your own research by contacting financial experts before making any investment decisions. We believe that all content is accurate as of the date of publication, but certain offers mentioned may no longer be available.
Bears have seized the initiative on the market, according to CoinMarketCap.
DOGE is one of the biggest losers today, falling by almost 12% since yesterday.
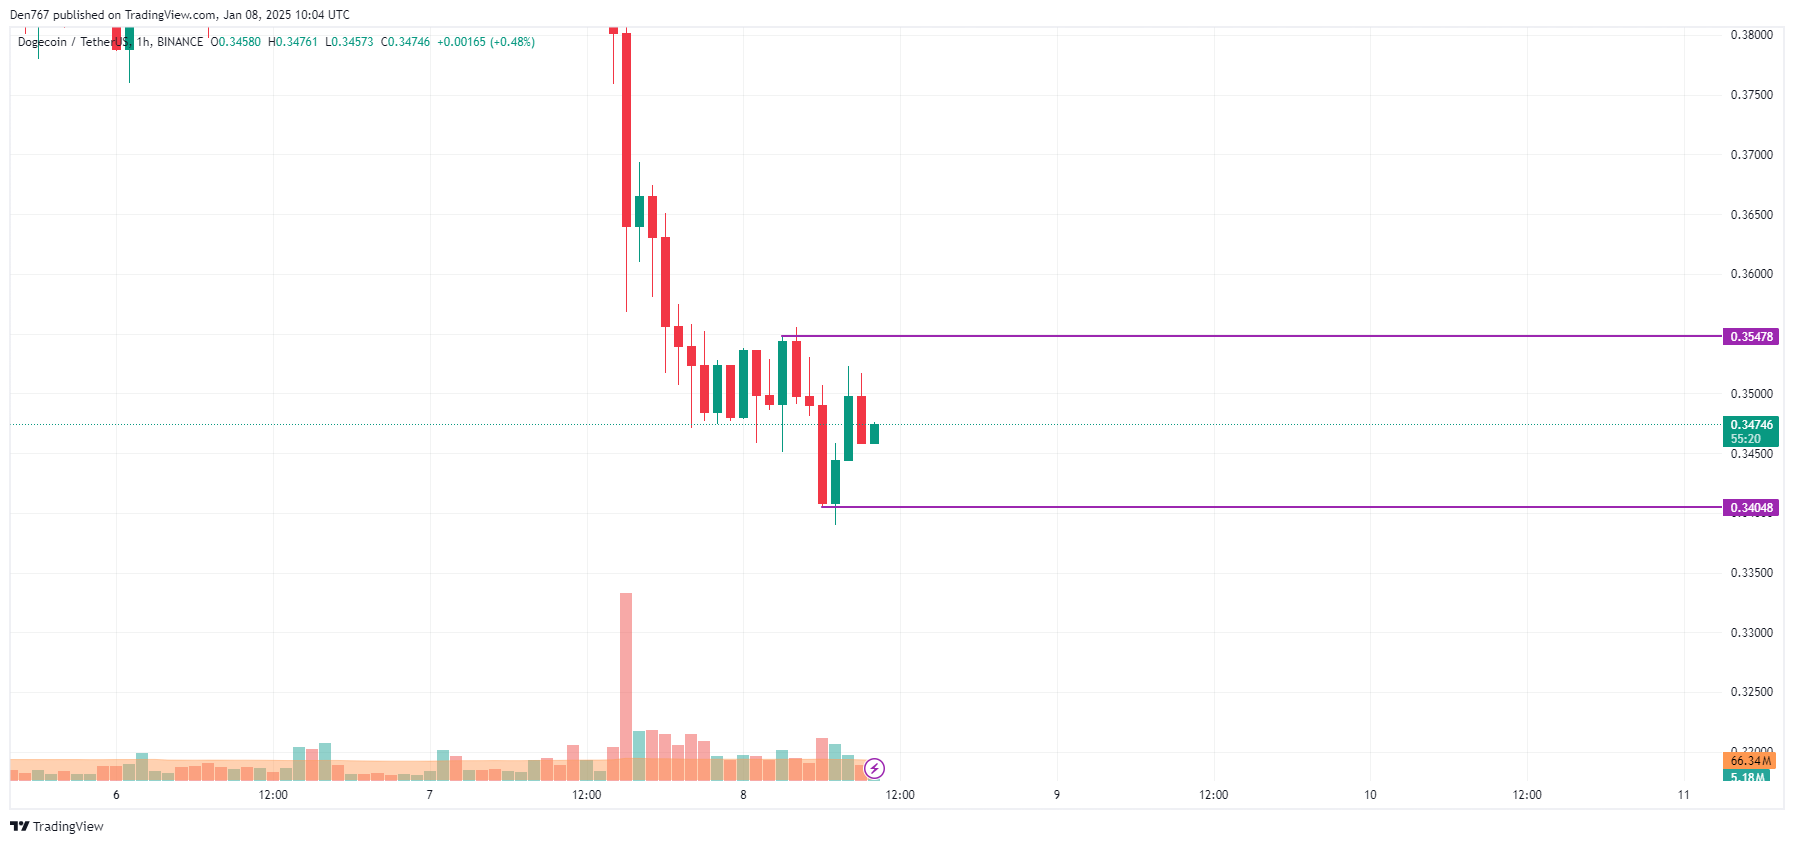
On the hourly chart, the rate of DOGE has made a false breakout of the local support of $0.3404.
Related
If the daily bar closes far from that mark, one can expect a test of the resistance level of $0.3547 by tomorrow.
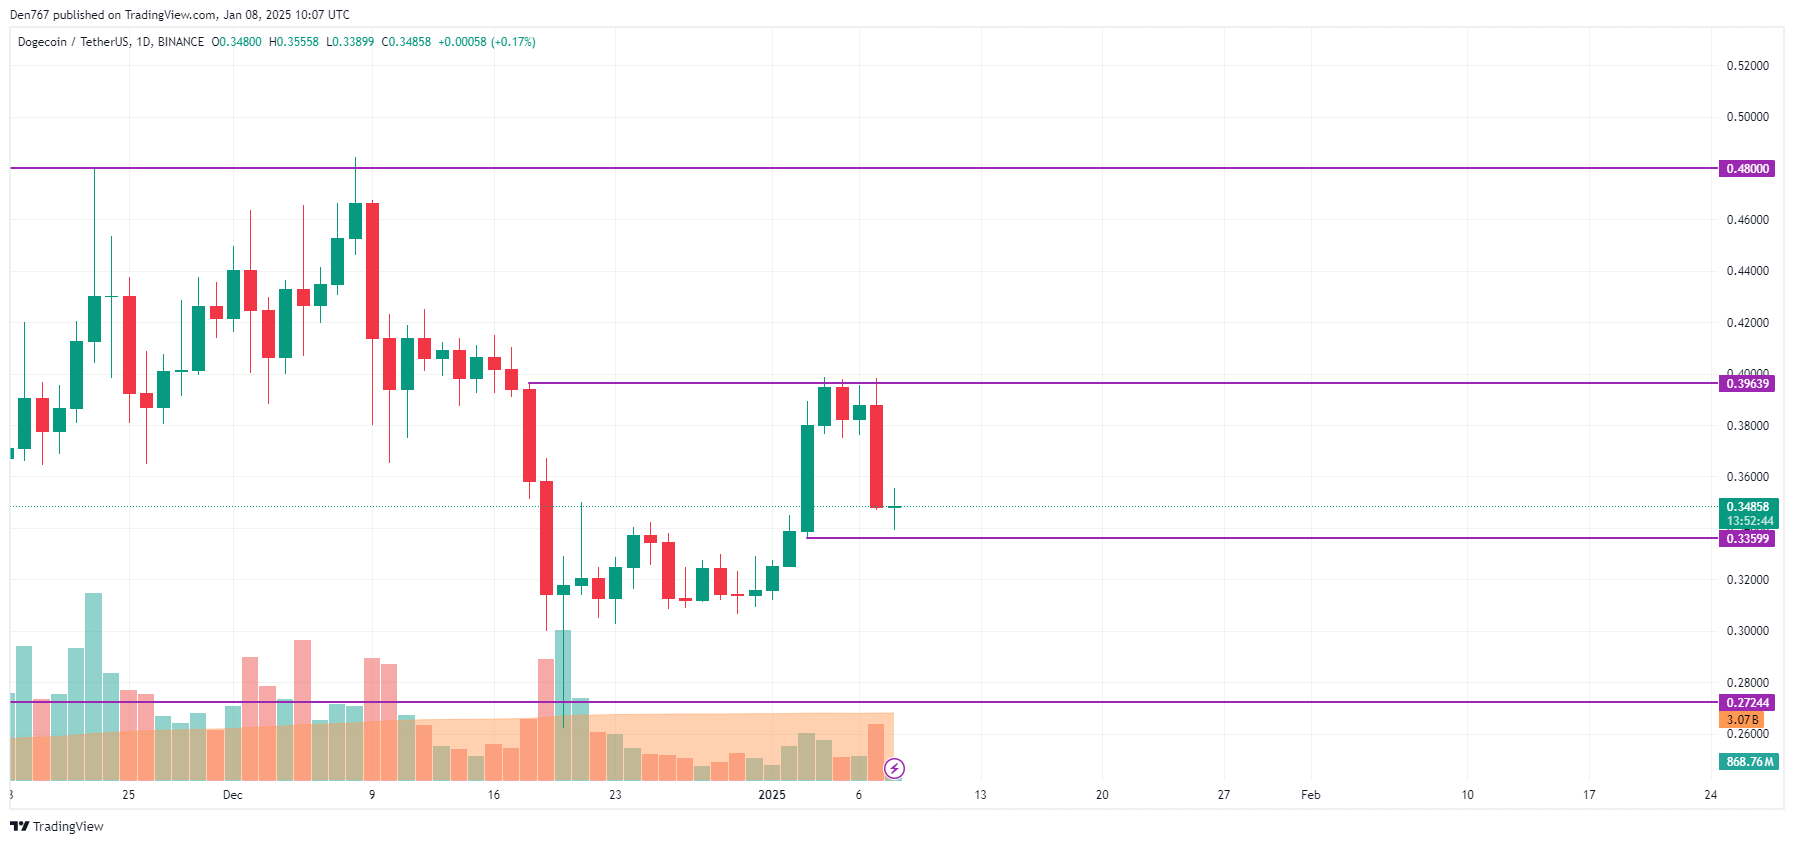
On the bigger time frame, one should pay attention to the interim zone of $0.3359. If its breakout occurs, the accumulated energy might be enough for a move to the $0.32 zone shortly.
From the midterm point of view, buyers have failed to maintain its growth after the previous bullish candle’s closure. If the situation does not change by the end of the day, there is a possibility of seeing a test of the $0.30 range soon.
DOGE is trading at $0.3481 at press time.
Disclaimer: The opinions expressed by our writers are their
own and do not represent the views of U.Today. The financial and market information
provided on U.Today is intended for informational purposes only. U.Today is not
liable for any financial losses incurred while trading cryptocurrencies. Conduct
your own research by contacting financial experts before making any investment
decisions. We believe that all content is accurate as of the date of publication,
but certain offers mentioned may no longer be available.
Layah Heilpern, a media personality and host of The Layah Heilpern Show, recently lent her voice to the growing list of XRP predictions for 2025.
In a tweet, Heilpern disclosed her outlook for the four leading cryptocurrencies: Bitcoin (BTC), Ethereum (ETH), Solana (SOL), and XRP.
As for XRP, she argued that the second-biggest altcoin could attain an unprecedented price level of $4. Notably, XRP is currently worth $2.33, with a 10% gain over the past week.
Reaching the $4 mark proposed by Heilpern would require a growth of 67.36%. While this percentage is relatively low, XRP has faced significant hurdles to further upside over the past four weeks. The asset has remained in a holding pattern, experiencing consistent dips and recoveries but failing to establish a major rally.
However, considering XRP’s performance in November 2024, a 67% upsurge is attainable for the token, even within a 24-hour window. Despite this reality, it is important to note that the market can behave erratically.
As for Bitcoin, Heilpern projects that the leading asset will climb to $200K this year. With Bitcoin currently trading at $99,500, this would represent an additional 101% gain from its current level.
Similarly, for the altcoin market leader, Ethereum, she predicts a high price of $7,000. This would also signify a 92% gain for Ethereum this year.
Notably, Heilpern’s predictions suggest that she expects XRP to underperform Bitcoin and Ethereum in the 2025 bull market. However, historical data suggests that XRP has a higher tendency to outperform the duo in a major bull run.
For instance, looking at the three assets on a weekly timeframe shows XRP as a better performer. XRP has surged by 15% in the last seven days, while Bitcoin and Ethereum have seen only half that growth in the same timeframe.
Moreover, a look at XRP’s performance over the last two months shows the altcoin boasts a 336% increase, more than ten times the figures for BTC and ETH.

Essentially, in a market where Bitcoin could trade as high as $200K, commanding a market cap of around $4 trillion, XRP is expected to see its value far beyond $4. Other market commentators have predicted double-digit prices are within reach for XRP in the 2025 bull run.
Interestingly, while some pundits, like Heilpern, believe $4 to $5 is where XRP will peak this season, more ambitious observers argue that this range represents a more near-term outlook.
Notably, Heilpern also suggested that Solana could reach $550 this year, implying a substantial 154% upside from its current price of $216.
DisClamier: This content is informational and should not be considered financial advice. The views expressed in this article may include the author’s personal opinions and do not reflect The Crypto Basic opinion. Readers are encouraged to do thorough research before making any investment decisions. The Crypto Basic is not responsible for any financial losses.
Ripple’s XRP has slipped back to fourth position after erasing almost three percent of the gains made in the last 24 hours. The price is now battling to stay above the $2.30 mark and if the price breaks below key support levels, particularly $2.24, it may hint at a change in market structure.
The current range has shown key phases like the automatic rally, secondary tests, and now a spring phase, where XRP is aiming for a breakout. This pattern has been observed before in other charts, like Binance Coin’s price action in 2023. We’re essentially waiting for the final breakout from the current range, which could happen soon.
The accumulation phase that began in early December seems to be nearing its conclusion. While the breakout may take some time to fully unfold, the range is close to completing, and the next move appears to be to the upside.
Support Levels to Watch
The key support levels to observe are $2.23, $2.21, $2.17, $2.29, and $2.24. These areas should be monitored for signs of reversal, but a clear breakout above certain levels will confirm further bullish movement.
Breakout Signals and Market Outlook
A breakout above the 50% Fibonacci level at $2.35 would signal the end of the immediate downside and potentially mark the start of an upside move. XRP is known to react quickly to such breakouts, so traders should stay alert.
The Patience Game
After over a month of range-bound movement, the end seems near. Whether viewed as a Wyckoff accumulation pattern or simply a series of tests and rallies, the final phase is underway. The next upward movement could be triggered by a catalyst or flush.
Join Our Telegram channel to stay up to date on breaking news coverage
The Solana price plummeted more than 7% in the last 24 hours to trade at $200.74 as of 9:58 p.m. EST as investors dump their holdings in the crypto.
This drop in the SOL price comes amid a broader crypto market correction, with the total capitalization of the digital asset space falling over 5%. Crypto market leaders Bitcoin (BTC) and Ethereum (ETH) saw their prices drop more than 4% and 8%, respectively.
4-hour chart for SOL/USD (Source: GeckoTerminal)
The Solana price dropped below the support at $216.88 in the last 24 hours, and is subsequently testing the next technical safety net at $200.12. Should sellers continue to exert pressure on SOL, the crypto might plunge to the $184.55 mark. In an extremely bearish case, the crypto could even fall to as low as $168.39.
On the other hand, traders identifying SOL’s current price as a buy opportunity might lead to a rebound from the $200.12 support. The Solana price could then try to reclaim the $216.88 support before potentially soaring to as high as $231.25.
A bearish scenario seems to be more likely to play out for the Solana price in the coming 24 hours. Indicators on the altcoin’s 4-hour chart, such as the Moving Average Convergence Divergence (MACD) and Relative Strength Index (RSI), warn SOL might keep falling through the course of the next trading day.
In the last few hours, RSI readings have undergone a steep drop from the high 70s to low 30s. This suggests overwhelming seller strength. With the negative slope of the RSI line, it appears bears have no intention of easing their pressure on the Solana price any time soon.
Momentum is also in favor of sellers after the MACD line broke away below the MACD Signal line in the last few hours. The growing gap between the two lines could also be seen as an indication that SOL’s negative momentum is picking up steam.
While SOL tries to hang onto support, investors are turning their attention to a new Solana layer-2 project by the name of Solaxy (SOLX) to grow their portfolios.
Investor sentiment in the market might have taken a knock in the last 24 hours, but several experts remain bullish on SOLX. Among them is an analyst from the 99Bitcoins YouTube channel, which has over 719K subscribers. In a recent video, the analyst said that the new crypto has the potential to soar 100X after its official launch.
Solana has gained a substantial amount of traction in the market in recent months due to its embrace of the booming meme coin space. However, the hype around these tokens is starting to test the blockchain’s computational capabilities. If something does not change soon, Solana could experience another outage, especially with talks of an impending meme coin supercycle.
Solaxy, with its native layer-2 network, is the first project aimed at alleviating some of the computational workload on the Solana blockchain. Through its scaling technologies, the project will unlock higher network speeds for the already-fast Solana while simultaneously slashing transaction fees.

In addition to scaling the Solana blockchain, Solaxy will also try to become a bridge between Solana and Ethereum through its token’s multi-chain presence.
Should the project successfully connect the two most prominent blockchains in the Web3 space, it will activate a new and improved ecosystem that combines Solana’s speeds and low fees with Ethereum’s robust infrastructure.
Investors are rushing to buy SOLX during its ongoing presale phase, as evident by the more than $9 million the project has raised so far. With the bullish predictions from experts combined with its mission to scale Solana and connect the chain to Ethereum, it’s easy to see why a buying frenzy has erupted around the new project.
Another factor that could be pulling investors in is the 383% staking APY on offer to presale buyers. To gain access to these rewards, investors will first need to acquire SOLX through the simple buy widget embedded on the project’s website.
Selling for $0.001594, the crypto can be bought with either crypto or bank card. Once purchased, investors will then need to navigate to the staking page on the website and lock up their tokens for the passive rewards.
Purchase and stake SOLX here for the 383% APY.
Newest Meme Coin ICO – Wall Street Pepe
Join Our Telegram channel to stay up to date on breaking news coverage
Amid the ongoing market crash, Cardano (ADA) has turned bearish and is poised to continue its price decline. Today, January 8, 2024, the sentiment across the cryptocurrency market has shifted, as the overall cryptocurrency market dropped by 5.5%.
This market crash has caused a breakdown of the four-day-long consolidation zone that ADA had been facing between the $1.047 and $1.11 levels. According to expert technical analysis, this breakout has turned ADA bearish, and there is a strong possibility it could initially decline by 8% to reach the support level of $0.95.
However, if this price decline continues and ADA fails to hold the support level of $0.75, there is also a possibility of another 20% price drop in the future, reaching the next support level at the $0.75 mark.
Currently, ADA is trading near $1.01 and has witnessed a price decline of over 10% in the past 24 hours, with an intraday high of $1.15. During the same period, trader and investor participation skyrocketed as the altcoin’s trading volume jumped by 57.7%.
This bearish price action and the overall market sentiment have created fear, but some long-term holders have been accumulating the token, as reported by the on-chain analytics firm Coinglass. Data from spot inflow/outflow revealed that, amid the market crash, exchanges have witnessed an outflow of over $36.16 million worth of ADA, the highest since December 18, 2024.
 Price Prediction for January 8")
In the cryptocurrency landscape, “outflow” refers to the flow of assets from exchanges to wallets, which is considered a potential sign of accumulation. This metric further highlights potential buying pressure, an upside rally, and also hints at ideal buying opportunities.
It will be crucial for traders and investors to monitor key levels such as $0.75, as it could create a make-or-break situation.
Ripple (XRP) has seen significant momentum recently, leading analysts to predict a major price surge that could take the cryptocurrency to new heights. With a potential 470% surge, XRP could reach $8.7 per token and a market capitalization of $500 billion. However, while this bullish forecast is based on technical analysis and market indicators, the possibility of a sharp downturn also looms if the rally fails to materialize.
XRP has made a stunning comeback, surging nearly 370% in the last two months. As of January 2025, XRP is trading at $2.42, with a market capitalization of $138.82 billion, making it the third-largest cryptocurrency by market cap. This surge comes despite some consolidation and setbacks in recent weeks, leaving many investors wondering whether XRP can maintain its bullish momentum.
Analysts have pointed to several key indicators that suggest a continuation of the rally. One such signal is the formation of a half-mast bull flag on XRP’s chart, a pattern often associated with strong price rallies. Additionally, a crypto analyst known as Ali has observed a super trend indicator flashing a buy signal on the 12-hour chart, marking the first such signal since early November 2024. The last time this occurred, XRP’s price surged by an impressive 470%, fueling speculation that the token could experience similar gains again.
Another important factor contributing to the bullish sentiment around XRP is the rising Open Interest (OI) in its futures market. Open Interest refers to the total number of outstanding contracts that have not been settled, and its increase typically signals growing investor interest and market confidence.
The current rise in XRP’s Open Interest suggests that more investors are positioning themselves for a potential breakout, which could drive the price higher. Analysts view this as a strong indicator that the XRP price may be on the verge of a significant rally, with the potential to push the price to $8.7 and a market cap of $500 billion.
While the outlook for XRP remains largely positive, experts caution that there is a risk of a sharp correction if the rally fails to materialize. If XRP cannot break through key resistance levels, it could fall back to $0.48, leading to a market cap of just $28 billion. This potential downside is something investors need to be aware of, especially in light of XRP’s ongoing consolidation.
XRP’s recent performance has certainly caught the attention of the crypto community. The token has shown resilience despite market fluctuations and is now positioned to capitalize on the growing interest from investors. The rising Open Interest and bullish technical indicators are key factors that could propel XRP to new heights, potentially reaching $8.7 and a $500 billion market cap.
However, it is essential to remain cautious. The volatility of the cryptocurrency market means that sudden downturns are always a possibility. As Ripple continues to consolidate, the next few weeks will be crucial in determining whether the current rally is sustainable or if a significant correction is imminent.
Post Views: 1
Solana price held firmly above $205 mark on Tuesday as hawkish undertones in the latest US JOLTs jobs sparked bearish market reactions. Can Solana’s rising network growth provide a buffer for SOL spot prices against rising volatility?
Solana price experienced intense volatility as the global crypto market’s positive start to 2025 hit a snag on Tuesday.
The crypto market experienced a considerable pullback as the US JOLTs jobs data published on Tuesday showed a stronger than expected labor market, sparking bearish reactions among traders.
Solana price plunged 6% to settle at $204 at press time on Tuesday, having opened trading at $218.
Market reports show that SOL price has shown considerable resilience compared to other mega cap assets like Avalanche and Chainlink, which suffered losses in excess of 10% on the day.
Despite volatile crypto spot prices, the Solana blockchain network continues to attract a steady flow of new investors.
Thanks to rising popularity of the crypto AI agent narrative, Solana-hosted projects like Pudgy Penguins and Fartcoin (FART) have dominated social discourse, attracting new entrants into the SOL ecosystem.
In confirmation of this trend, Hellomoon’s Daily First Signers Chart below tracks the total number of unique wallets or users interacting with a particular protocol, blockchain, or application for the first time. This metric provides insights into Solana network growth, adoption and user engagement trends.
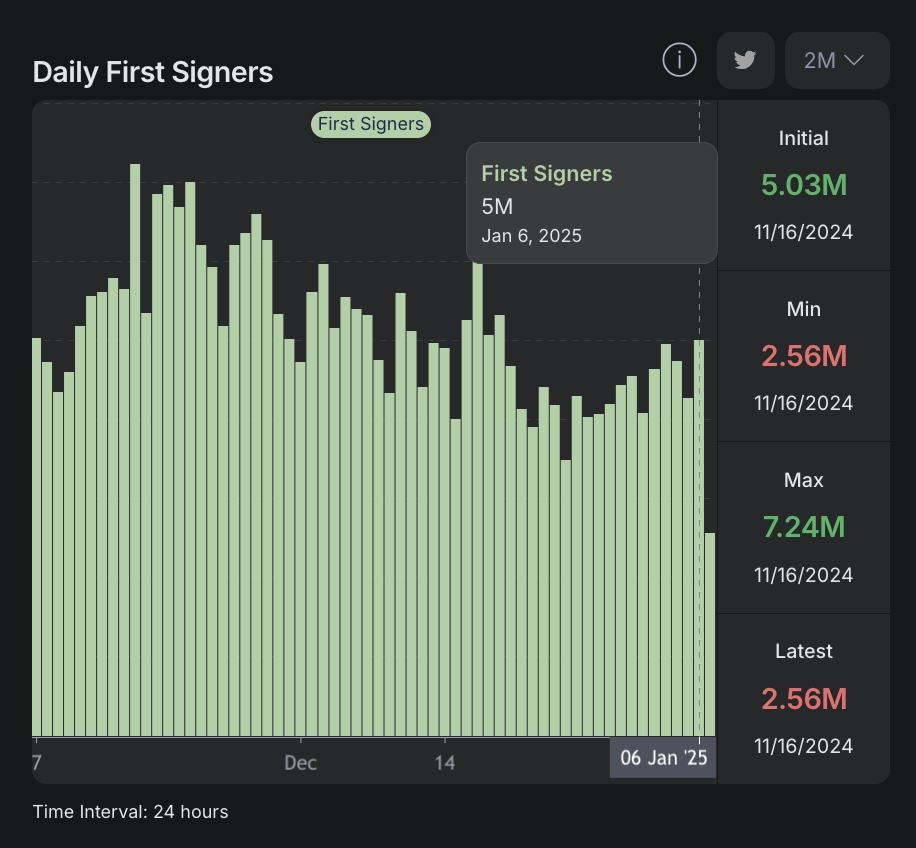
Solana Daily First Signers | Source: HelloMooon
The latest data shows Solana attracted 5 million Daily First Signers on January 6, its highest in over two weeks, dating back to December 19.
This signals a considerable number of new users join the Solana network, despite crypto markets wobbling in the last 24 hours.
The increased capital inflows from new entrants can help provide a buffer for SOL spot prices amid bearish tailwinds from the hawkish readings in US jobs data.
This partly explains why SOL bulls have managed to keep its daily time frame losses subdued at 6%, avoiding a major breakdown below the $200 support level.
The SOL/USD daily chart shows Solana declining 6.48% today to $204, with the $200 support in focus. Bollinger Bands (BB) indicate a contraction, suggesting reduced volatility. Price action remains below the upper BB ($220.52) but above the lower band ($174.15), hinting at potential stabilization.
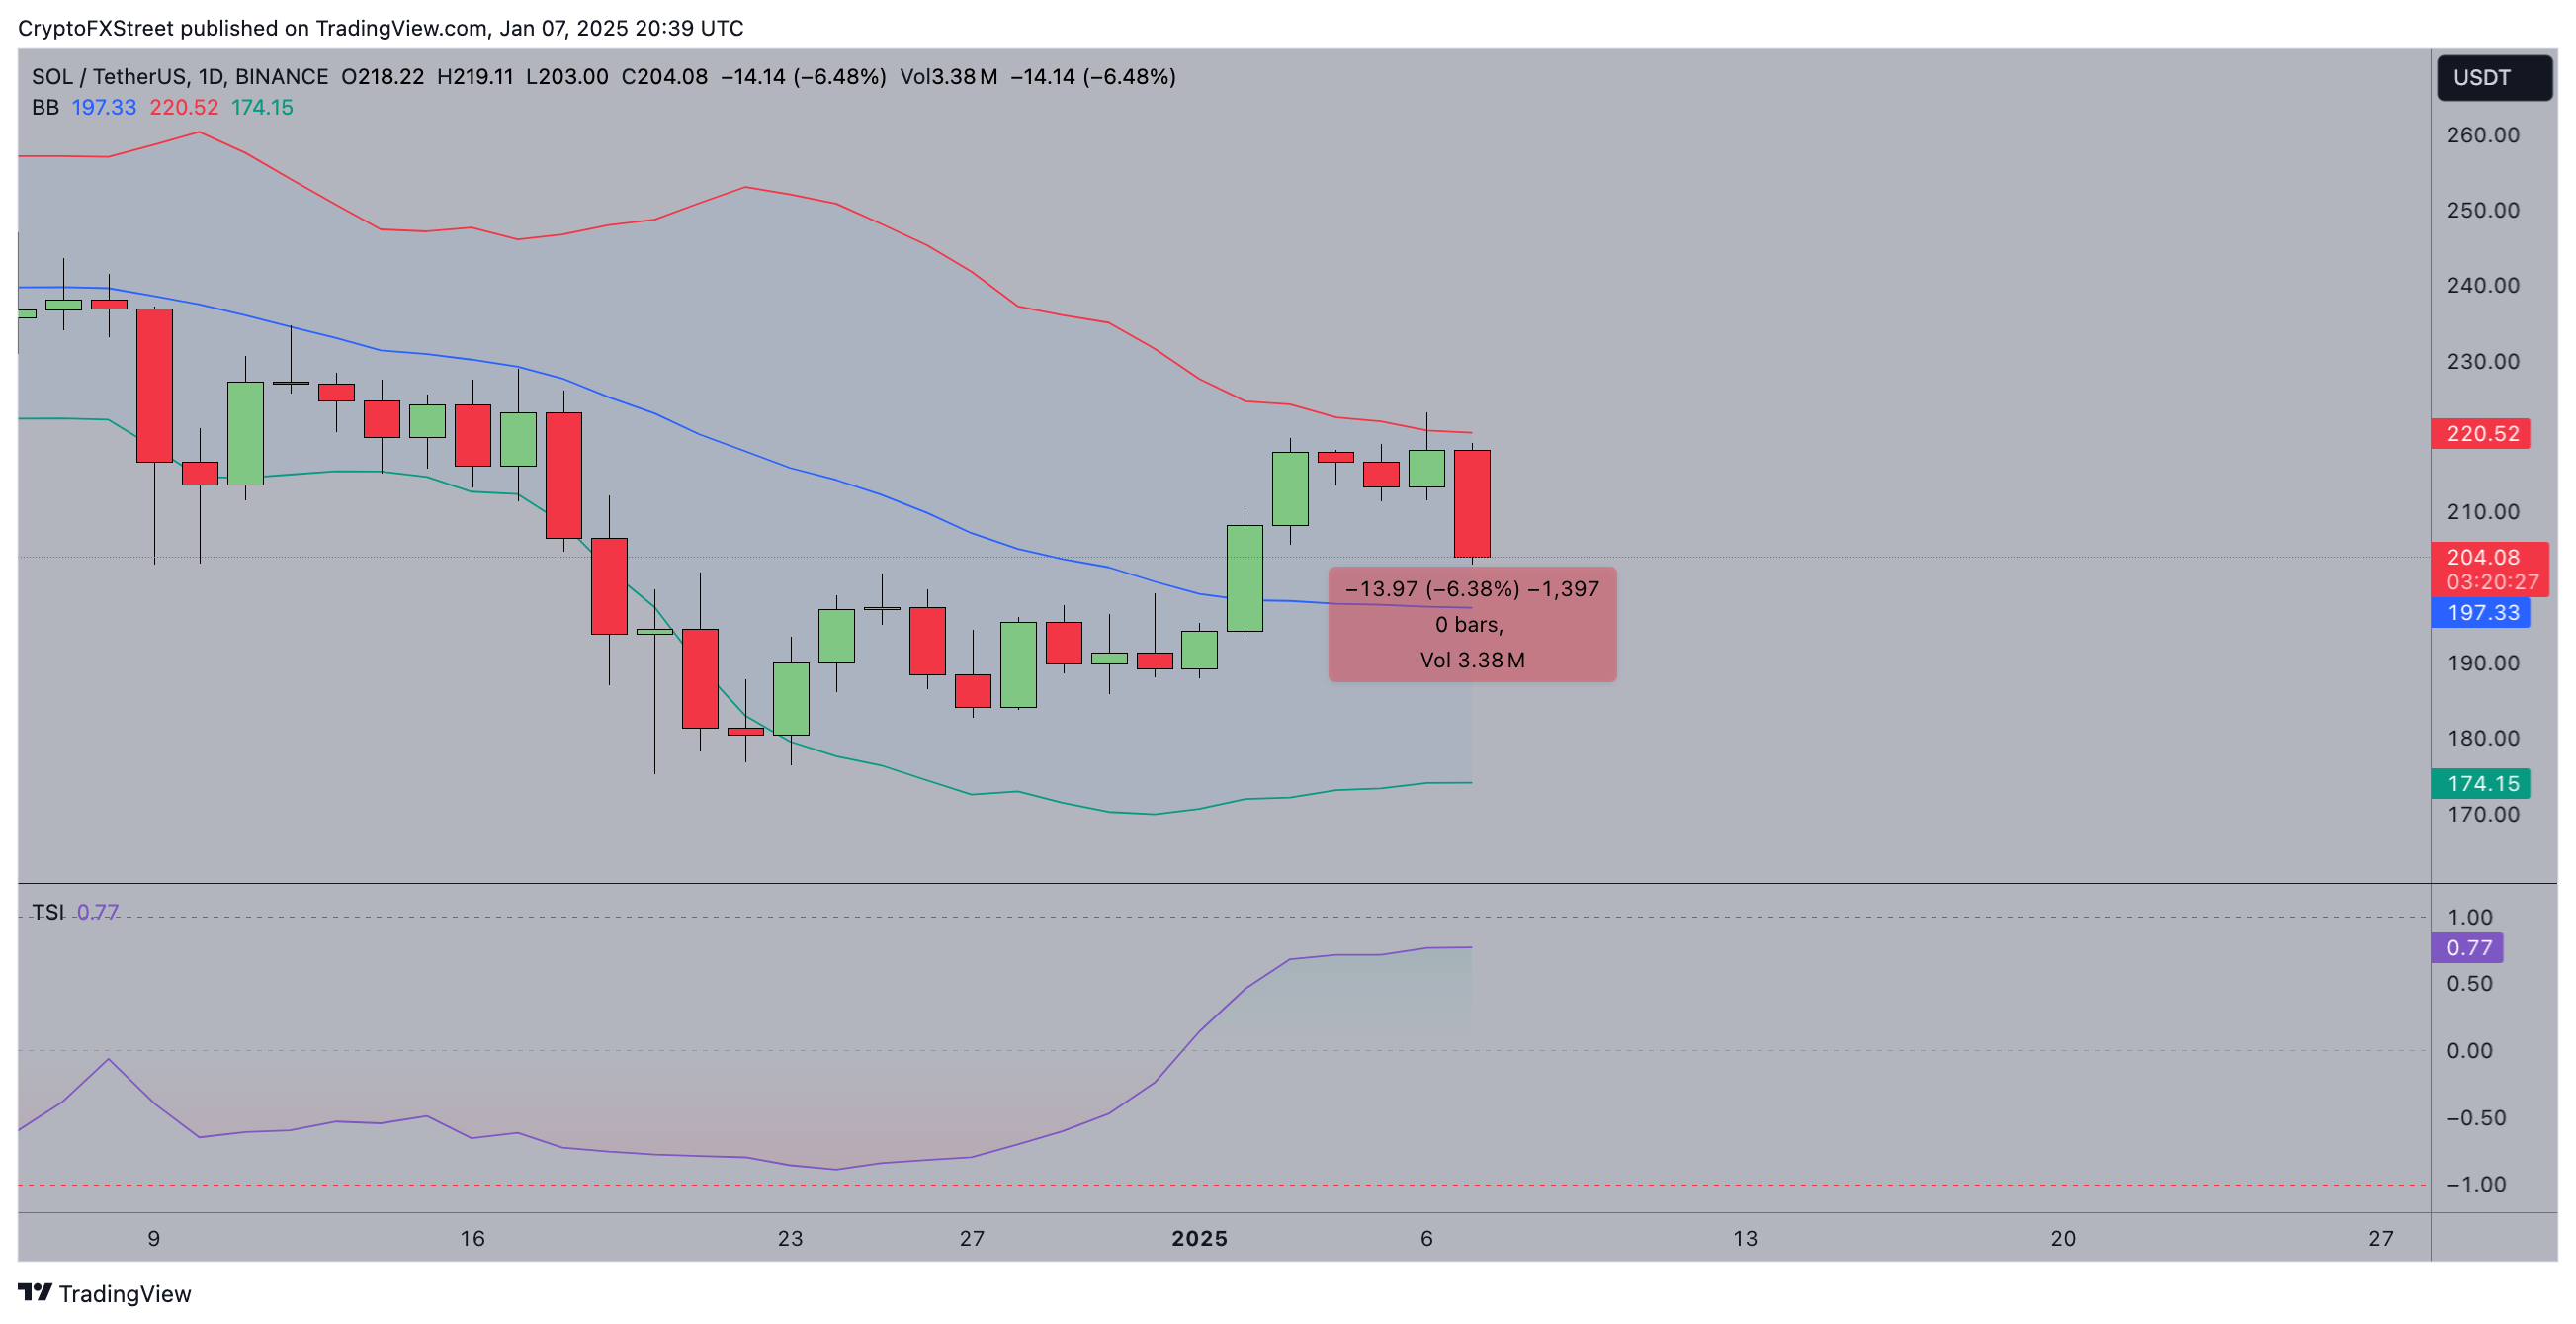
Solana Price Forecast | SOLUSD
The Total Strength Index (TSI) at 0.77 reflects bullish momentum despite today’s drop.
If $200 holds, buyers may attempt recovery, targeting the $220 resistance marked by the 50-day Moving Average (blue). A breakout above could signal renewed bullish momentum toward $240.
On the flip side major bearish risks could emerge if the $200 support caves.
In this scenario sellers may push prices toward $174, the lower BB boundary.
The market has turned to red again, according to CoinStats.CoinStats”>
The rate of Bitcoin ![]() BTCUSD has dropped by 1.91% over the last 24 hours.TradingView”>
BTCUSD has dropped by 1.91% over the last 24 hours.TradingView”>
On the hourly chart, the price of BTC is trying to break the local resistance of $94,623. If it happens, the rise may continue to the $95,000 zone by the end of the week.TradingView”>
A less positive picture is on the bigger time frame. If buyers lose the interim area of $94,000, there is a chance of a test of the nearest support of $92,092.TradingView”>
A similar situation is on the weekly chart. At the moment, there are no reversal signals yet, which means there is still a chance of an ongoing decline.
If the $92,000 level is broken, traders may witness a test of the $90,000 range shortly.
Bitcoin is trading at $94,544 at press time.
Ethereum (ETH) is down 6% on Tuesday after the recent general crypto market decline canceled out gains seen in the past five days. If ETH fails to bounce off the lower boundary support line of a symmetrical triangle pattern, it could crash to the $3,000 psychological level.
Cardano (ADA) loses 2% on Tuesday amidst profit-taking by traders. The altcoin’s large wallet investors are accumulating the token at a rapid pace. This is typically considered a bullish indicator for Cardano and could support a recovery.
%20[20.10.33,%2007%20Jan,%202025]-638718638601583010.png)
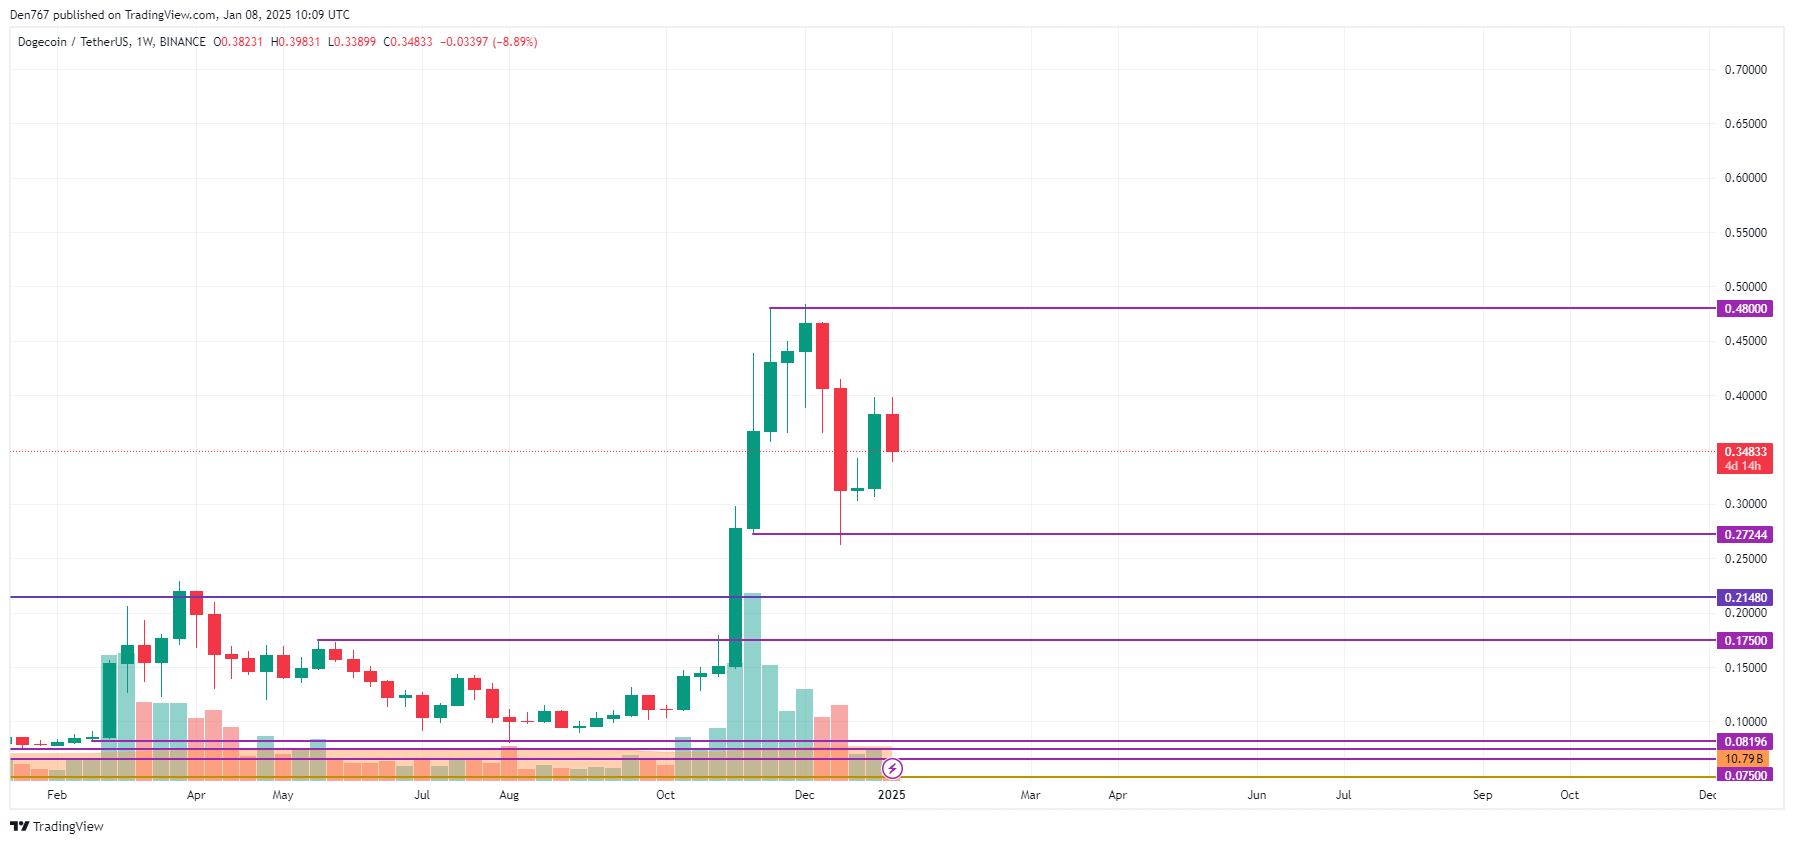
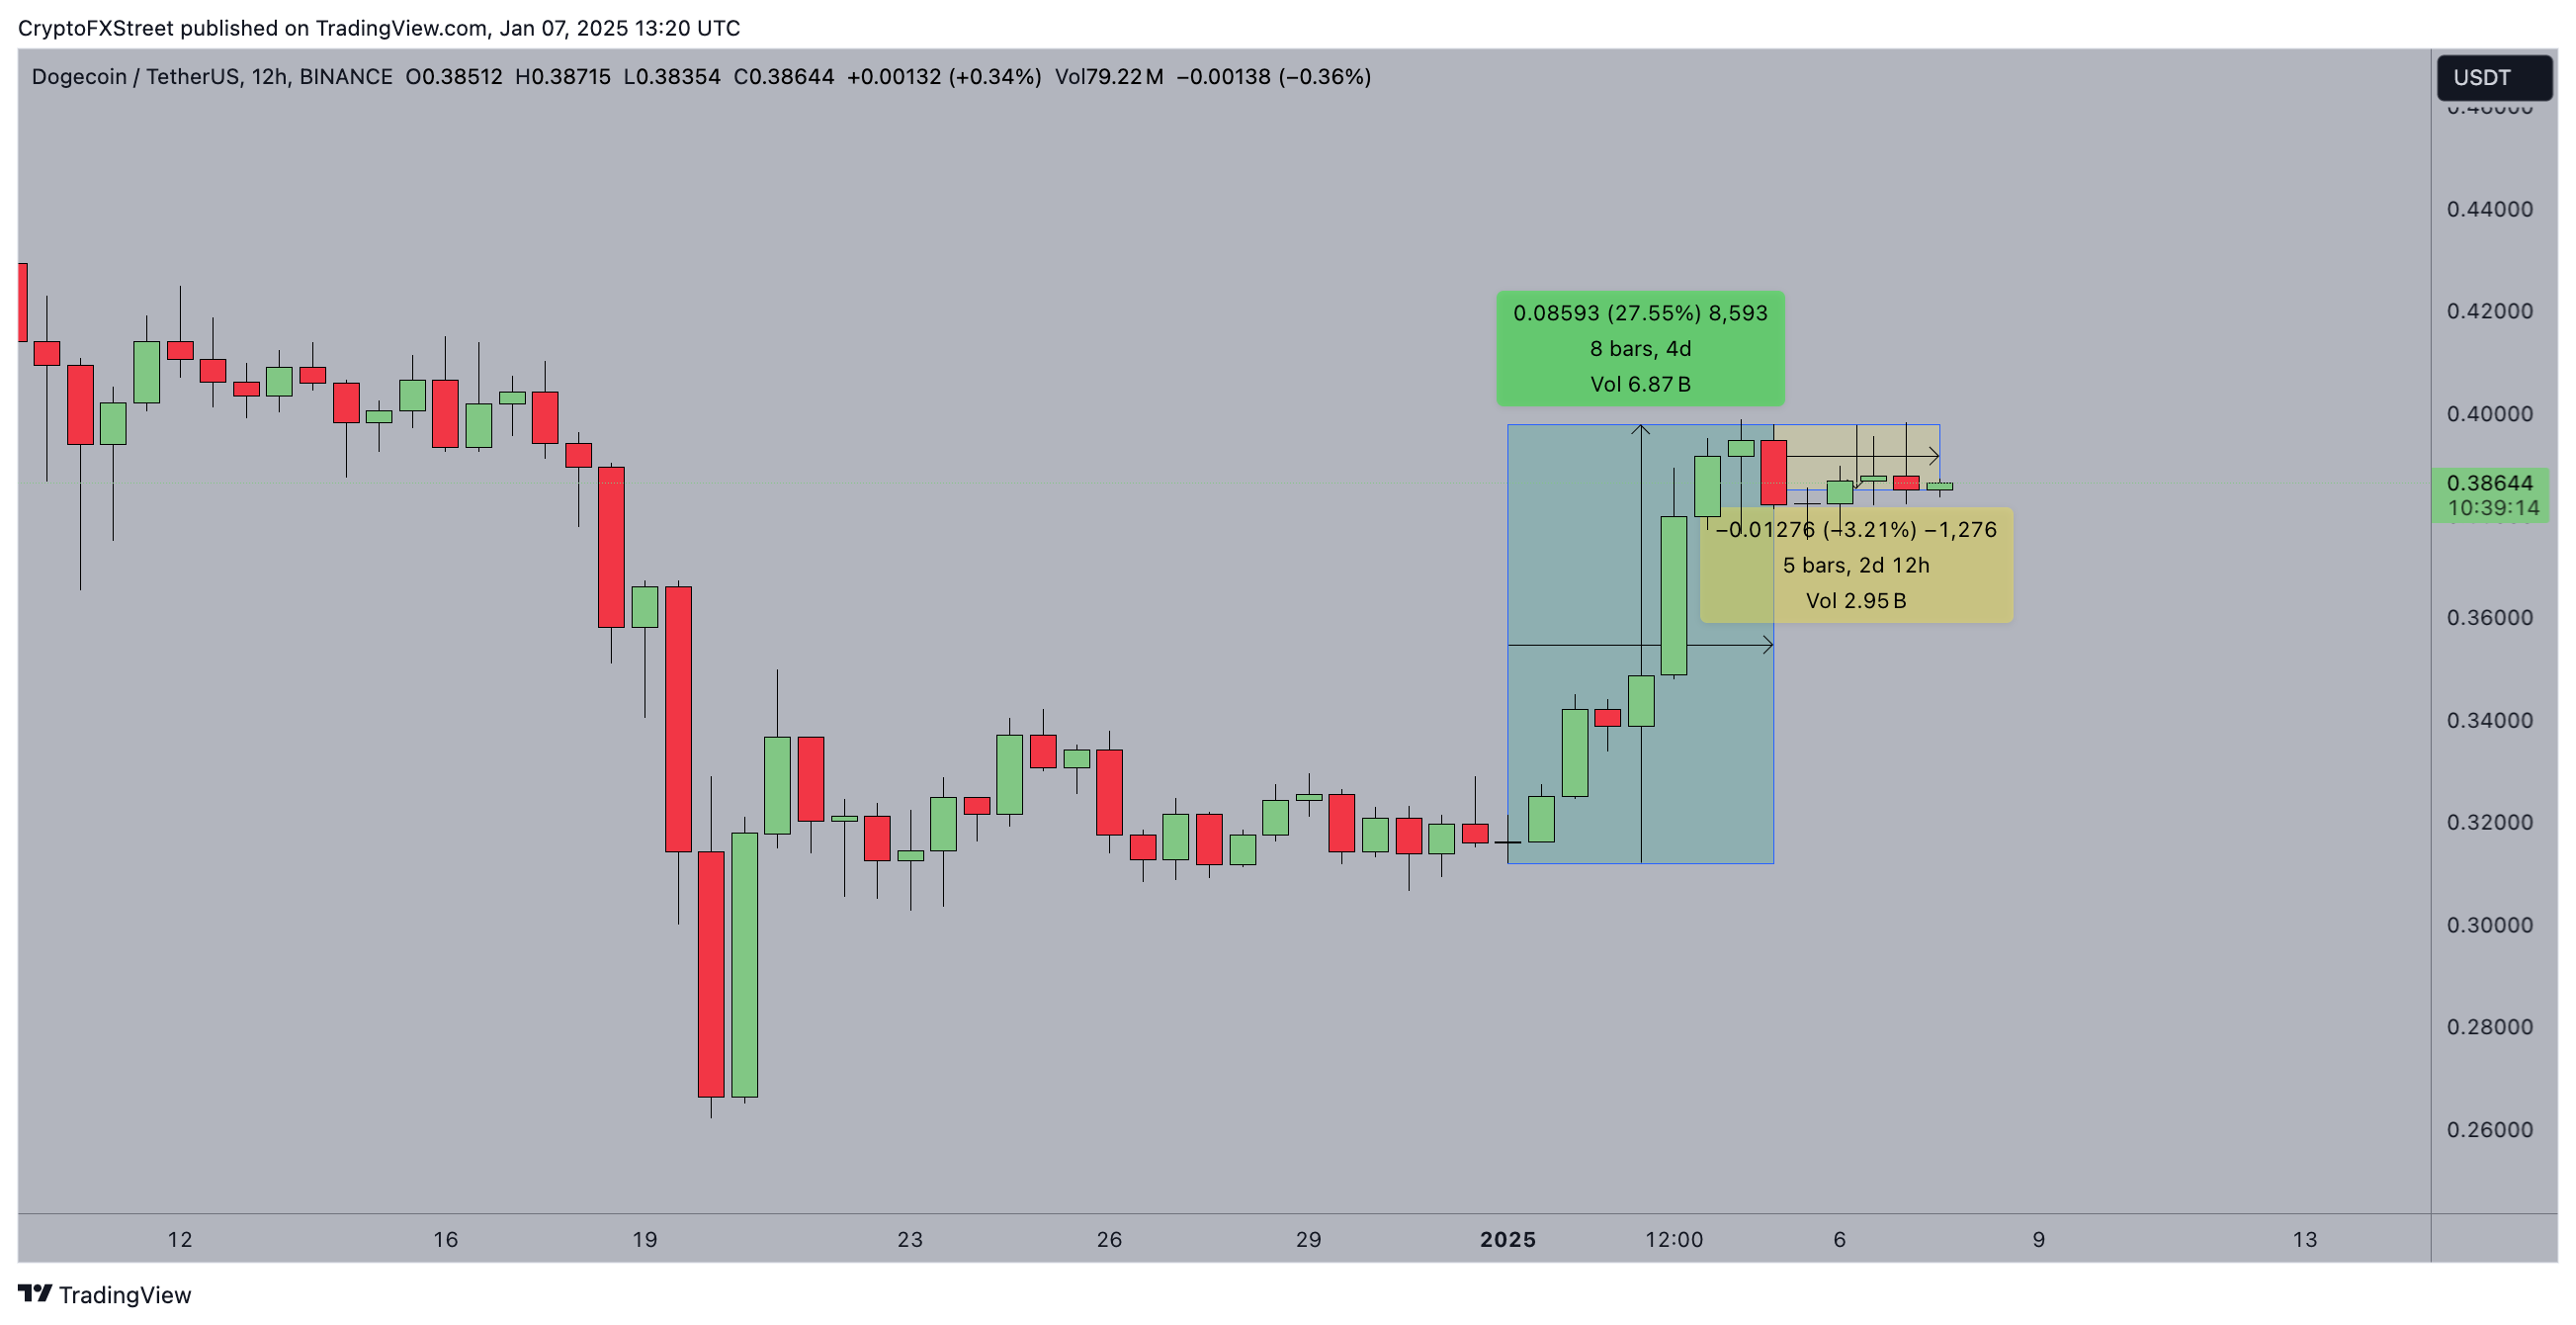
Dogecoin price consolidates below $0.40 on Tuesday, amid tailwinds from France’s President Emmanuel Macron raised election meddling allegations involving Elon Musk on Monday. DOGE traders have opened over $1.2 billion worth of new positions within 24 hours of the news. Is the DOGE price on the verge of abreakout to $1 or a reversal toward $0.30?

 Price Prediction for January 8")

%20%5B20.10.33,%2007%20Jan,%202025%5D-638718638601583010.png "Ethereum, Dogecoin & Cardano – American Wrap 07 January")